Quick answer
- Payback period = initial investment divided by annual savings (break-even years).
- ROI = (lifetime savings minus cost) divided by cost, expressed as a percentage.
- Indian C&I payback often lands at 3 to 5 years when grid tariffs exceed ₹8/kWh (2026 typical).
- Utility-scale EPC runs roughly ₹34 to 38 lakh/MW; soiling and O&M move ROI by whole points.
- Always model maintenance and cleaning in savings, not just capex and tariff.
How do you calculate solar plant ROI and payback period?
Payback divides upfront cost by annual electricity savings until cumulative savings equal investment. ROI compares total net savings over project life to initial cost. For a 1 MW industrial plant saving ₹80 lakh per year on ₹4 crore capex, simple payback is five years; 25-year ROI depends on tariff escalation, degradation, and O&M including cleaning.
Why ROI and Payback Period Matter Before Investing in Solar
A solar installation is a 25-year financial commitment. The upfront capital, whether ₹3 lakh for a residential rooftop or ₹5 crore for a 1 MW industrial plant, will sit locked in hardware for a generation. Before making that commitment, two financial metrics tell you whether the numbers work and how they compare against other uses of that capital.
The payback period tells you when your cumulative savings will equal your initial investment, the break-even point. After that date, every unit of solar electricity generated is effectively free. ROI tells you the percentage return your investment generates over its lifetime compared to what you spent, allowing you to compare solar against fixed deposits, equity investments, or business reinvestment.
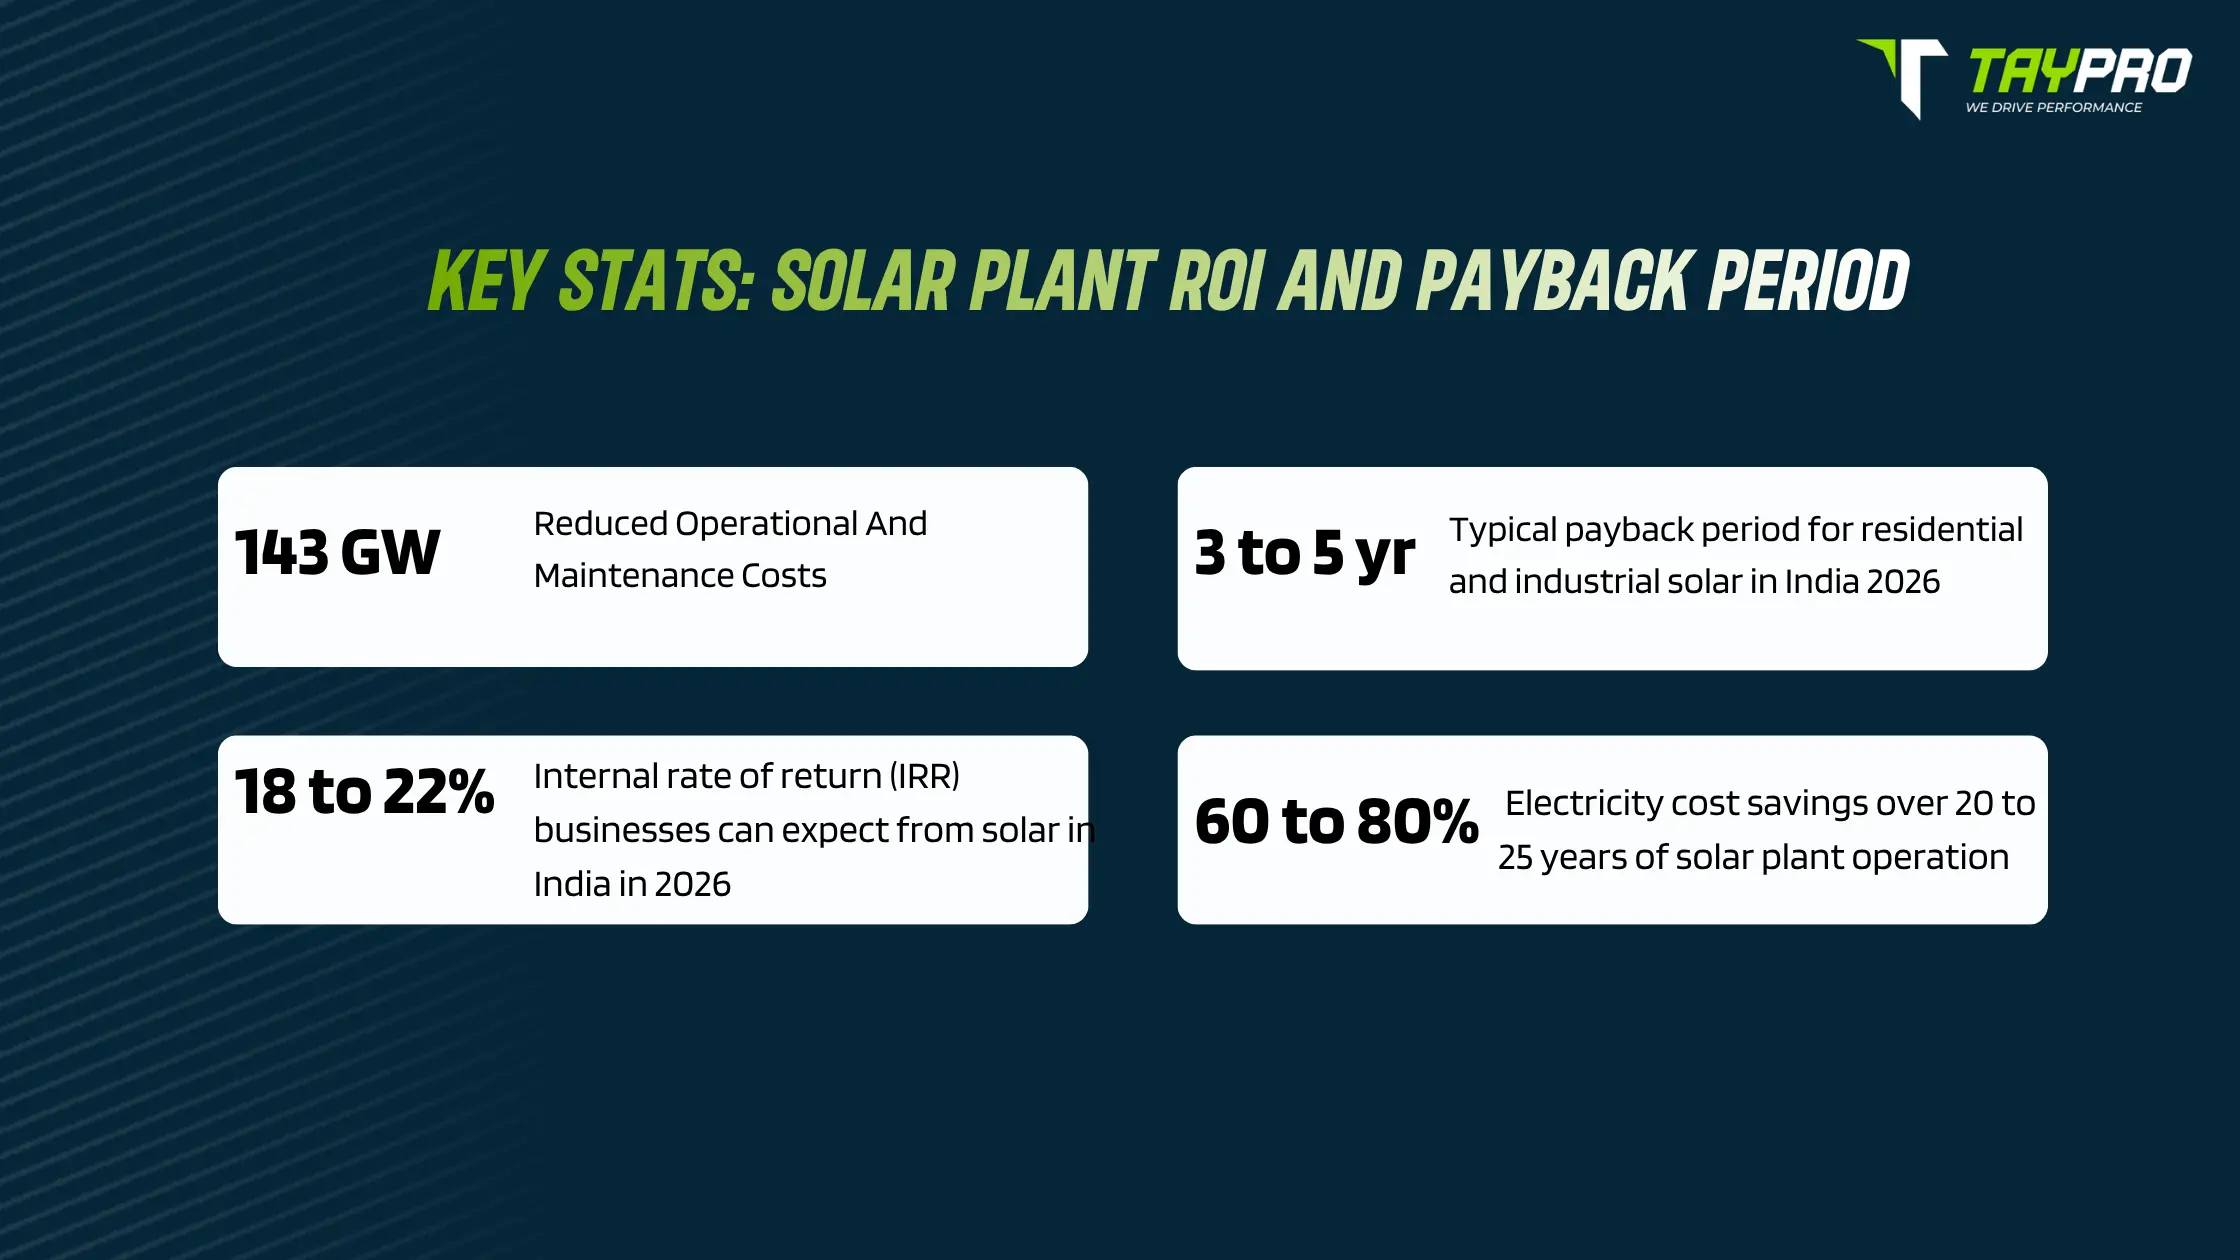
In 2026, with electricity prices in states like Maharashtra, Karnataka, and Delhi reaching ₹8 to 10 per unit, and solar generation costs stabilised at ₹3 to 4 per unit for captive systems, the financial case for solar has never been stronger. India's cumulative installed solar capacity crossed 143.60 GW by February 2026, with the country adding a record 36.6 GW in 2025, a 43% jump year on year. Behind those deployment numbers is a financial case that is being run by CFOs, asset managers, and homeowners across the country. This guide helps you run it accurately.
Sources: KPI Green Energy Solar Financing Guide, India 2026. SafEarth Industrial Solar ROI Analysis, April 2026. Ministry of New and Renewable Energy (MNRE) data, February 2026.
Key Factors That Affect Solar Plant ROI
Solar ROI is not a fixed number. It is the output of several interacting variables, each of which you can influence at the planning stage. Understanding which levers matter most determines how effectively you can optimise a project's financial performance.
Grid electricity tariff, the single biggest driver of solar ROI. The higher your current grid rate, the more each solar unit saves. Industrial consumers in India pay ₹8 to 12 per unit for grid electricity in 2026, while residential consumers in high-tariff states pay ₹8 to 10. Solar generation at ₹3 to 4 per unit delivers a ₹4 to 8 saving per unit at these rates. States with the highest tariffs, Maharashtra, Gujarat, Tamil Nadu, show the fastest payback periods.
System cost and technology choice, utility-scale EPC costs have declined to ₹34 to 38 lakh per MW, while rooftop solar for commercial and industrial use is priced at ₹40 to 55 lakh per MW due to import duties and advanced technology specifications. Higher-efficiency TOPCon and bifacial panels cost more but generate more per square metre, compressing payback on space-constrained sites.
Solar irradiation at the installation site, states like Rajasthan, Gujarat, and Karnataka deliver higher generation due to stronger and more consistent sunlight. A system in Rajasthan generating 1,600 kWh per kWp annually will outperform the same system in a lower-irradiance state, recovering its cost faster and generating more lifetime revenue.
Financing structure, CAPEX ownership delivers the highest IRR because the system owner captures the full spread between solar generation cost and grid tariff. PPA and OPEX models eliminate upfront cost but share savings with the developer. Loan-financed CAPEX sits between the two: the owner captures more savings than a PPA but subtracts loan servicing costs during the repayment period.
Tax incentives and subsidies, residential consumers can claim PM Surya Ghar subsidies of up to ₹78,000, which directly reduces the effective system cost and shortens payback by 12 to 18 months. Commercial and industrial entities cannot claim this capital subsidy but can claim 40% accelerated depreciation under Section 32 of the Income Tax Act, and manufacturing MSMEs can claim up to 60% in Year 1. At a 25% effective tax rate, a ₹5 crore solar investment generates ₹50 lakh in cash flow benefit from depreciation alone in the first year.
Grid tariff escalation, grid electricity tariffs in India have historically risen 4 to 6% annually. A solar plant locked in at ₹3 to 4 per unit becomes progressively more valuable each year as the grid rate rises. Plants installed five years ago at ₹7 per unit grid rates are now avoiding costs at ₹10 to 11 per unit, nearly 50% more than the original savings calculation.
O&M costs and soiling losses, ongoing maintenance costs reduce net annual savings and extend payback. More significantly, uncleaned panels experiencing soiling losses reduce generation, directly cutting the annual savings the system generates. This is one of the most controllable variables in post-commissioning ROI management, examined in detail in Section 9.
Net metering policy, in states with annual credit rollover (Gujarat, Haryana), excess generation exported to the grid is credited against night-time consumption on a 1:1 basis over 12 months. Without net metering, excess generation cannot be monetised, reducing effective savings by 30 to 40% for installations that generate more than they consume during the day.
How to Calculate Solar Payback Period
The payback period is the simplest and most widely used solar financial metric. It tells you how many years it takes for the cumulative savings generated by your solar system to equal the net cost of installing it. Once payback is achieved, the system continues generating electricity, and savings, for the remaining 15 to 20 years of its operational life.
Calculating it accurately requires three inputs: the net system cost after subsidies and incentives, the annual savings generated by the system, and the annual O&M costs that reduce those savings. The difference between gross annual savings and O&M costs is the net annual savings, the number that determines how quickly payback is reached.
The Step-by-Step Payback Calculation
Step 1: Determine net system cost, Total installation cost minus any subsidies (residential PM Surya Ghar), tax credits, or GST input tax credits applicable to your category.
Step 2: Calculate annual electricity generation, System size (kW) multiplied by average daily peak sun hours for your location multiplied by 365, adjusted for system efficiency and panel degradation in Year 1 (typically 0.5% from rated capacity).
Step 3: Calculate annual savings, Annual generation (kWh) multiplied by your applicable grid electricity tariff (₹ per unit). For net metering systems, include the value of exported units at the applicable feed-in or offset rate.
Step 4: Subtract annual O&M costs, Cleaning, monitoring, and routine maintenance typically cost 0.5 to 1% of system CAPEX per year at residential scale and 1 to 1.5% at commercial scale.
Step 5: Divide net system cost by net annual savings, The result is your simple payback period in years.
How to Calculate Solar Plant ROI
ROI measures the total financial return on your investment as a percentage of the capital deployed. Unlike payback period, which only tells you when you break even, ROI tells you how much you made across the full investment horizon. For a 25-year solar plant, the difference is substantial: a system with a 4-year payback still generates 21 more years of savings after that point.
The standard ROI formula captures this full lifetime return. It is worth noting, as industry practitioners have pointed out, that the standard formula understates true returns for commercial and industrial buyers who have access to depreciation benefits and GST credits. A more complete model adds the cash flow value of tax depreciation benefits and input tax credits to the numerator.
Standard vs Complete ROI Framework
The standard formula divides lifetime net savings by the net investment. The complete framework for commercial and industrial operators adds three components: annual energy savings (the core generation value), tax depreciation benefit (cash flow saved from reduced tax liability), and GST input tax credit (the GST paid on the system recovered as business input credit).
Solar ROI Formula (With Example)
Solar ROI (%) = [(Lifetime Net Savings − Net System Cost) ÷ Net System Cost] × 100
For commercial and industrial: add accelerated depreciation tax benefit to lifetime savings
Worked Example, 1 MW Industrial Ground-Mounted Plant, Rajasthan
A manufacturing facility invests ₹5 crore in a 1 MW captive solar plant
Total system cost: ₹5,00,00,000 (₹5 crore at ₹50/W all-in EPC cost)
GST input tax credit recovered: ~₹30,00,000
Net system cost: ₹4,70,00,000
Annual generation: 1 MW × 1,600 kWh/kWp (Rajasthan irradiance) = 16,00,000 kWh
Grid tariff avoided: ₹9 per unit
Annual energy savings: 16,00,000 × ₹9 = ₹1,44,00,000 (₹1.44 crore)
Annual O&M cost: ₹5,00,000 (1% of CAPEX)
Net annual savings: ₹1,39,00,000
Year 1 accelerated depreciation (40%): ₹2,00,00,000 depreciation
Tax benefit at 25% effective rate: ₹50,00,000 additional Year 1 cash flow
25-year lifetime net savings (without tariff escalation): ₹34.75 crore
With 4.5% annual grid tariff escalation: ₹55 to 70 crore
Simple Payback (without tax benefits): ₹4.70 cr ÷ ₹1.39 cr = 3.4 years
With accelerated depreciation: effective payback compresses to 2.8 to 3.2 years
25-year ROI (base case): [(₹34.75 cr − ₹4.70 cr) ÷ ₹4.70 cr] × 100 = 639%
IRR: 20 to 28% (depending on tariff escalation and financing model)
Solar ROI and Payback Period: Example Scenarios
ROI and payback period vary significantly across installation types, states, and financing structures. The table below maps benchmark figures for the primary solar installation categories in India in 2026, using current market cost, tariff, and irradiance data.
Scenario | System Size | Net Cost | Annual Savings | Payback Period | 25-Year IRR |
Residential rooftop (high-tariff state, with PM Surya Ghar subsidy) | 3 to 6 kW | ₹1.5 to 3 lakh | ₹40,000 to 1 lakh/yr | 3 to 4 years | 20 to 25% |
Residential rooftop (without subsidy) | 3 to 6 kW | ₹2.2 to 4 lakh | ₹40,000 to 1 lakh/yr | 4 to 6 years | 15 to 20% |
Commercial rooftop (industrial tariff ₹8 to 10/unit) | 50 to 500 kW | ₹35 to 200 lakh | ₹6 to 35 lakh/yr | 3 to 4 years | 22 to 28% |
Industrial rooftop with 40% accelerated depreciation | 500 kW to 1 MW | ₹1.75 to 3.5 crore (effective) | ₹25 to 80 lakh/yr | 2.5 to 3.5 years | 25 to 32% |
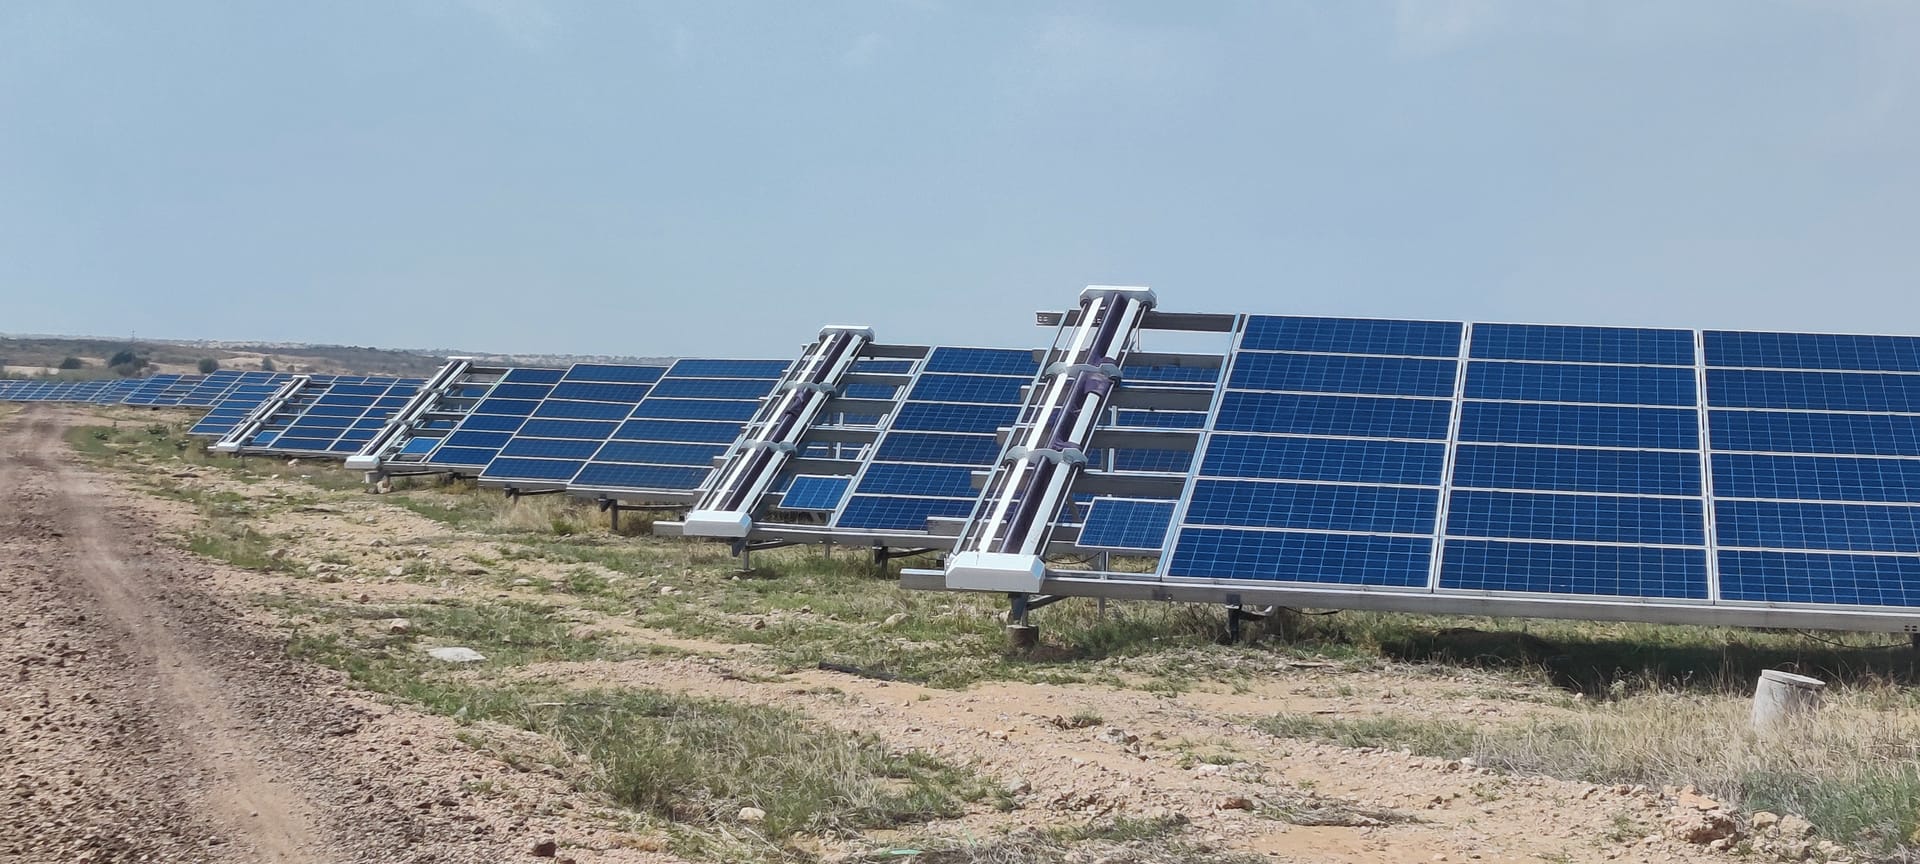
Utility-scale ground-mounted (PPA model) | 5 to 50 MW | Zero CAPEX | Immediate savings vs grid | Immediate (no capital deployed) | Developer captures; buyer saves 30 to 55% |
Utility-scale ground-mounted (CAPEX ownership) | 5 to 50 MW | ₹17 to 19 crore per 5 MW | ₹2.5 to 4 crore/yr per 5 MW | 4 to 6 years | 15 to 20% |
Sources: SafEarth Industrial Solar ROI, April 2026. KPI Green Energy Financing Guide, 2026. Avaada 5 MW Solar Cost Analysis, 2026. Heaven Green Energy ROI Calculator, March 2026.
What Impacts Solar Plant ROI the Most?
Of all the variables in a solar ROI calculation, three account for the majority of the variance between a 3-year payback and a 7-year payback at the same installation scale. Understanding where the biggest levers are allows investors to prioritise optimisation effort.
Grid Tariff: The Biggest Lever
The gap between your grid tariff and your solar generation cost is the engine of solar ROI. Grid rates for high-tension industrial consumers across India now range from ₹8 to ₹12 per unit depending on state and sanctioned load, a direct savings spread of ₹4 to 9 per solar unit generated. Every time your state electricity regulatory commission raises tariffs, historically every 1 to 3 years, the value of your captive solar generation increases automatically while your solar generation cost stays fixed.
Accelerated Depreciation: The Commercial Game-Changer
For profitable commercial and industrial entities, the 40% accelerated depreciation benefit under Section 32 of the Income Tax Act is transformative. On a ₹5 crore solar plant, a company can claim ₹2 crore in depreciation in Year 1 alone. At a 25% effective tax rate, that is ₹50 lakh in cash flow benefit in the first year, before a single rupee of electricity savings is counted. For typical commercial installations, the payback period can reduce from 5 to 6 years to 3 to 4 years when tax incentives are effectively utilised.
Grid Tariff Escalation: The Long-Term Compounder
Solar ROI is not static, it improves over time as grid tariffs rise. A plant installed at ₹9 per unit grid tariff that sees 4.5% annual escalation is avoiding ₹14.20 per unit by Year 12. The solar generation cost remains fixed at ₹3 to 4 per unit for the life of the system. The 25-year cumulative savings therefore substantially exceed what a simple Year 1 calculation suggests, and this compounding effect is what produces 25-year ROI figures of 600% or more for well-sited industrial plants.
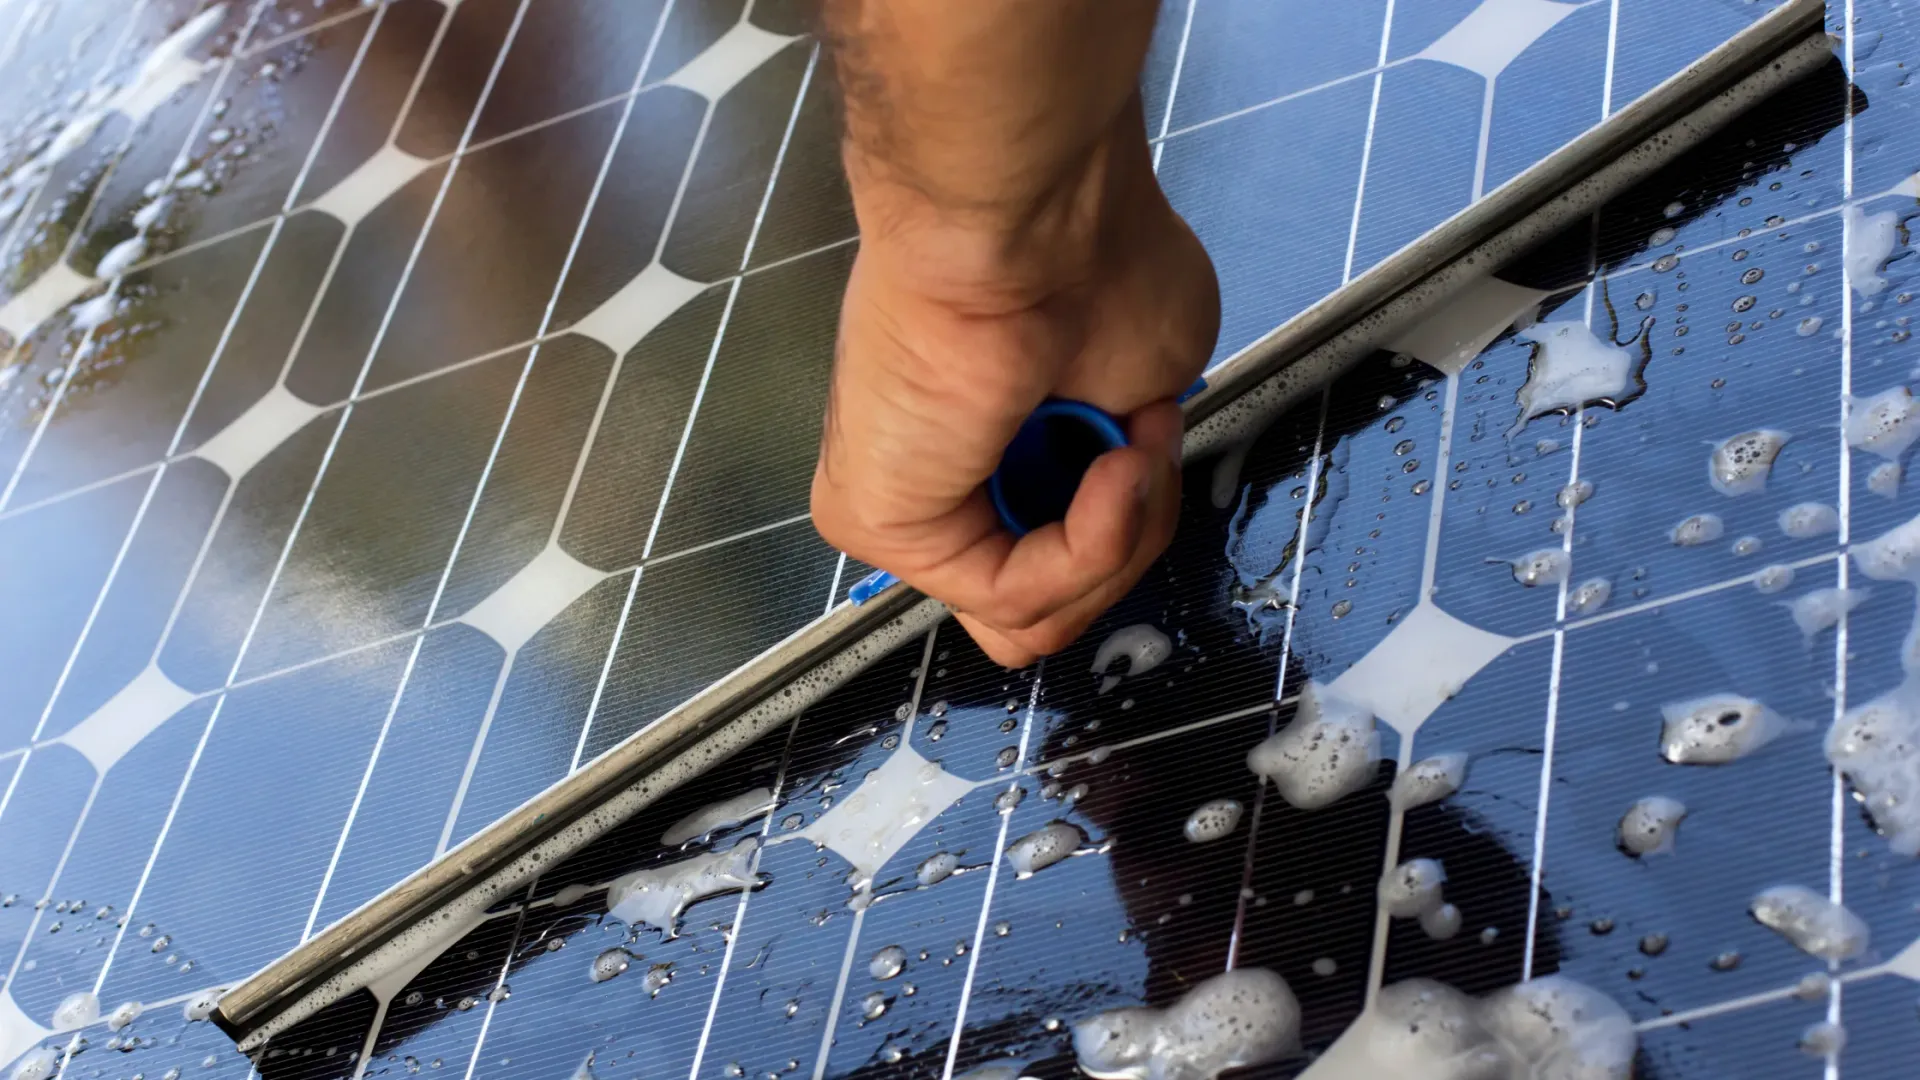
How Solar Panel Maintenance Affects ROI
Once a solar plant is commissioned, the primary variable within an operator's control is how well the panels are maintained. This is not a minor operational detail, it is a direct financial variable that can shift a plant's effective ROI by several percentage points.
After irradiance, soiling is the single most influential factor impacting solar PV system yield. Globally, soiling is estimated to cause annual PV energy production losses of 3 to 5%. In India's dusty environment, soiling losses can reduce generation by 15 to 20% without adequate cleaning, and in arid or agricultural zones, losses can exceed 50% at severely affected sites. Even a 1% error in soiling assumptions during the project planning phase can ripple through a financial model, shifting IRR calculations, distorting debt sizing, and creating a gap between projected and actual generation that widens year after year.
The Maintenance-ROI Relationship:
A 10% soiling-induced generation deficit on a 1 MW plant generating ₹1.44 crore annually represents ₹14.4 lakh in foregone revenue per year. Over 25 years, even without tariff escalation, that is ₹3.6 crore in lost revenue from panels that were not kept clean. The O&M cost to prevent that loss is a fraction of the revenue at stake.
Inadequate maintenance also creates compounding risks beyond soiling. Hotspot formation from localised dust concentration causes encapsulant browning and cell damage that permanently reduces module output. Inverter thermal shutdowns from blocked air filters create unplanned downtime. These failure modes translate directly into revenue loss and asset degradation that reduce both short-term generation and long-term plant value.
Choosing the Right Cleaning Approach
For residential systems in India, a fortnightly cleaning cycle using a soft brush and gentle water is the standard recommendation for maintaining peak ROI. Dust accumulation in Indian summers can reduce output by 15 to 25%, a monthly cleaning schedule in dusty regions is the minimum standard.
For utility-scale plants, manual cleaning is operationally impractical at the frequency required, particularly in high-soiling agricultural and arid zones where daily cleaning may be necessary during peak dust seasons. The India market for automated waterless robotic cleaning, now valued at USD 45 to 65 million and growing at 18 to 25% CAGR, has been driven precisely by this requirement.
TAYPRO's Solar Cleaning ROI Calculator allows plant operators and investors to quantify the generation revenue recovered through systematic cleaning against the cost of deploying an automated cleaning system, providing a site-specific calculation of cleaning ROI and payback period for utility-scale installations. The tool is available at taypro.in.
How to Improve Solar Plant ROI and Reduce Payback Time
Solar ROI is not fixed at the commissioning date. Several decisions made before and after installation materially improve the financial outcome. The following levers have the highest impact on payback compression and lifetime return optimisation.
Maximise accelerated depreciation utilisation, commission the plant before September 30 to ensure it is operational for more than 180 days in the financial year, qualifying for 60% combined depreciation (40% standard plus 20% additional for manufacturing entities). The cash flow benefit in Year 1 directly offsets CAPEX and compresses effective payback.
Match system size to daytime load precisely, the optimal system size is determined by your daytime consumption, not total daily consumption. Over-sizing creates surplus generation you cannot consume or monetise efficiently. Under-sizing leaves large portions of the grid bill untouched and extends payback. A Detailed Project Report (DPR) built on your actual load profile is the correct starting point.
Negotiate zero or 1% PPA escalation clauses, for PPA and OPEX model buyers, the escalation clause is the most financially significant negotiating point. A 3% annual escalation on a ₹4 per unit PPA reaches ₹8.38 per unit by Year 25, potentially approaching grid tariff. Grid rates historically rise 5 to 7% annually, so even a 1% escalation PPA delivers growing savings every year.
Select high-irradiance locations and south-facing tilt angles, in India, south-facing panels at 15 to 25 degrees tilt capture maximum year-round irradiance. Even small deviations of ±15 degrees cost only 2 to 3% in annual output. For ground-mounted utility-scale plants, site selection in Rajasthan, Gujarat, or Karnataka delivers materially higher generation than equivalent capacity in lower-irradiance states.
Implement systematic cleaning and maintenance from Day 1, soiling losses begin accumulating immediately after commissioning. A cleaning programme that prevents 10% average soiling loss on a 1 MW plant generating ₹1.44 crore annually is protecting ₹14.4 lakh per year in revenue. The cost of a structured cleaning programme is a fraction of the revenue it protects.
Use performance monitoring to detect faults early, AI-powered SCADA monitoring systems can identify generation anomalies within hours, compared to the weeks it takes for manual quarterly inspections to detect the same fault. Early detection prevents weeks of compounding generation loss per fault event.
Leverage net metering credits strategically, in states with annual rollover (Gujarat, Haryana), bank surplus credits generated in high-irradiance summer months against winter night-time consumption. Understanding your state's net metering settlement window allows you to maximise the value of every exported unit.
Key Takeaways
Payback period is calculated by dividing the net system cost (after subsidies) by the net annual savings (generation value minus O&M costs). The result tells you when the system breaks even.
Solar ROI measures lifetime net savings as a percentage of net investment. For a 1 MW industrial plant in a high-tariff state, 25-year ROI of 600% or more is achievable under realistic tariff escalation assumptions.
Grid tariff is the single biggest ROI driver. At ₹8 to 12 per unit for industrial consumers, the savings spread against solar generation cost of ₹3 to 4 per unit is the widest in the sector's history.
Accelerated depreciation compresses commercial payback dramatically. The 40% (up to 60% for manufacturing MSMEs) first-year depreciation under Section 32 of the Income Tax Act reduces effective payback from 5 to 6 years to 2.5 to 3.5 years for profitable businesses.
Soiling losses are the most controllable post-commissioning ROI risk. Inadequate cleaning can reduce generation by 15 to 20% in India's dusty environment, costing lakhs of rupees in foregone revenue annually on systems of any size.
Residential payback in 2026 is 3 to 5 years with the PM Surya Ghar subsidy and 4 to 6 years without. For commercial and industrial operators, 2.5 to 4 years with accelerated depreciation, and immediate savings under PPA models.
Grid tariff escalation makes solar more valuable every year. Plants that installed five years ago at ₹7 per unit grid rates are now avoiding ₹10 to 11 per unit, delivering 50% more than their original savings projection.
Solar is a compelling investment in 2026, but only if the plant is maintained. A well-maintained system with structured cleaning and preventive O&M will deliver the modelled 18 to 22% IRR. A poorly maintained system will not.
FAQs
What is a good payback period for a solar plant in India in 2026?
A payback period of 3 to 5 years is considered strong for residential and commercial solar in India in 2026. Industrial systems with accelerated depreciation often achieve payback in 2.5 to 3.5 years. Utility-scale CAPEX projects typically see 4 to 6 year payback depending on tariff and state. PPA and OPEX models show immediate savings with zero capital deployed. Anything beyond 7 years warrants scrutiny of the tariff assumptions, system cost, or subsidy calculation used in the projection.
What is the difference between payback period and ROI for solar?
Payback period tells you when your cumulative savings equal your initial investment, the break-even point. ROI tells you the total percentage return on that investment over the system's full lifetime. A system with a 4-year payback and 25-year operational life generates 21 more years of savings after break-even. Those 21 years are what produce ROI figures of 400 to 700% for well-sited industrial systems. Payback answers "when do I get my money back?" ROI answers "how much do I make in total?"
How does the PM Surya Ghar subsidy affect solar ROI for residential consumers?
The PM Surya Ghar Muft Bijli Yojana subsidy provides up to ₹78,000 in capital subsidy for residential rooftop systems above 3 kW. This directly reduces the net system cost, the denominator in the payback calculation, and shortens payback by 12 to 18 months compared to an unsubsidised system. On a ₹2.8 lakh system (6 kW, post-subsidy) at ₹9 per unit grid tariff in Maharashtra, payback falls below 3 years. Commercial and industrial systems are not eligible for this capital subsidy but access accelerated depreciation benefits that produce comparable or better payback compression for profitable businesses.
How does soiling affect solar ROI and what can be done about it?
Soiling, the accumulation of dust, agricultural particulate, and bird fouling on module surfaces, reduces irradiance reaching solar cells and suppresses generation proportionally. In India's dusty environment, inadequate cleaning causes generation losses of 15 to 20% for residential systems and 3 to 5% annually on a global average basis. For utility-scale plants in arid or agricultural zones, losses can exceed 50% at severely affected sites. The financial impact is direct: a 10% average soiling loss on a 1 MW plant generating ₹1.44 crore annually costs ₹14.4 lakh per year in foregone revenue. A systematic cleaning programme, fortnightly for residential, automated robotic cleaning for utility-scale, prevents these losses and protects the modelled ROI.
What is the IRR of a solar plant in India in 2026?
IRR for solar projects in India in 2026 ranges from 15 to 32% depending on installation type, state, tariff, and financing model. Residential systems typically deliver 15 to 25% IRR. Commercial rooftop with accelerated depreciation delivers 22 to 28%. Industrial CAPEX systems in high-tariff states with full tax benefit utilisation reach 25 to 32%. These figures compare strongly against alternative investments, bank fixed deposits at 7 to 8%, equity mutual funds targeting 12 to 15%, particularly given that solar returns are generated from avoided electricity costs rather than market-dependent returns, providing downside protection against market volatility.
Does solar ROI improve over time?
Yes, materially and structurally. Grid electricity tariffs in India have historically risen 4 to 6% annually, while the solar generation cost for a commissioned plant remains fixed for its operational life. Every tariff revision increases the value of each solar unit generated without changing what the plant cost to build. A plant installed at ₹7 per unit grid tariff in 2019 is now avoiding ₹10 to 11 per unit, delivering nearly 50% more annual savings than its original model projected. This compounding effect is why 25-year ROI projections for industrial solar in high-tariff states routinely reach 600% or more when realistic tariff escalation is modelled.
What is the difference between CAPEX and PPA solar models in terms of ROI?
CAPEX ownership delivers the highest IRR because the owner captures the full spread between solar generation cost and grid tariff, plus accelerated depreciation tax benefits. PPA models require zero capital deployment and provide immediate savings, typically 30 to 55% below grid tariff, but the developer captures a share of the economics in exchange for providing the system. For businesses with strong balance sheets, high tax liability, and depreciation capacity, CAPEX consistently delivers higher lifetime ROI. For businesses prioritising capital preservation, off-balance-sheet treatment, or operational simplicity, PPA is the correct choice. The right model depends on capital position, tax situation, and risk appetite, not on which produces the highest headline percentage.
How can I calculate my specific solar ROI?
Calculating your specific solar ROI requires five inputs: your total system cost, applicable subsidies or tax benefits (PM Surya Ghar for residential; accelerated depreciation for commercial), your location's peak sun hours, your current grid electricity tariff, and your expected annual O&M costs. Multiply your system size in kW by peak sun hours by 365 to estimate annual generation. Multiply annual generation by your grid tariff to get annual savings. Subtract O&M costs to get net annual savings. Divide net system cost by net annual savings for payback period. For full lifetime ROI, add tariff escalation assumptions and project savings year by year across the system's operational life. Online solar ROI calculators, including TAYPRO's Solar Cleaning ROI Calculator for assessing the specific financial impact of cleaning on generation revenue, can automate this calculation with site-specific inputs.
Related resources
For procurement and O&M teams evaluating robotic cleaning in India:
- waterless vs water-based solar cleaning
- robotic vs manual solar panel cleaning
- Taypro robotic solar panel cleaning service
Related reading
Frequently asked questions
Payback period equals total project cost divided by annual savings (cost divided by yearly bill offset). ROI equals (total lifetime savings minus initial investment) divided by initial investment, times 100. Use consistent 25-year life, degradation, and O&M assumptions for India utility and C&I models.
Commercial and industrial rooftop systems in high-tariff states often pay back in 3 to 5 years when grid rates reach ₹8 to 12 per unit and generation cost stays near ₹3 to 4 per unit. Utility-scale projects may show 5 to 7 year payback depending on PPA tariff, EPC cost near ₹34 to 38 lakh per MW, and availability.
Grid tariff or PPA rate is the largest lever: each rupee per kWh changes annual savings directly. System cost, capacity utilization factor, inverter availability, and soiling losses on the generation side matter equally on operating plants. Financing cost and accelerated depreciation affect investor ROI but not simple payback.
Soiling can suppress output 3 to 8 percent between cleans on dusty Indian sites, which reduces savings and lengthens payback. Cleaning spends should enter O&M models; when recovered MWh value exceeds clean cost, ROI improves. Ignoring soiling overstates both payback speed and lifetime returns.
Use net present value or IRR for lender-grade analysis; simple ROI for board summaries. Annual ROI approximates (year savings minus O&M) divided by remaining book value early in life. Include cleaning, tracker maintenance, and insurance in O&M, not just inverter spares.