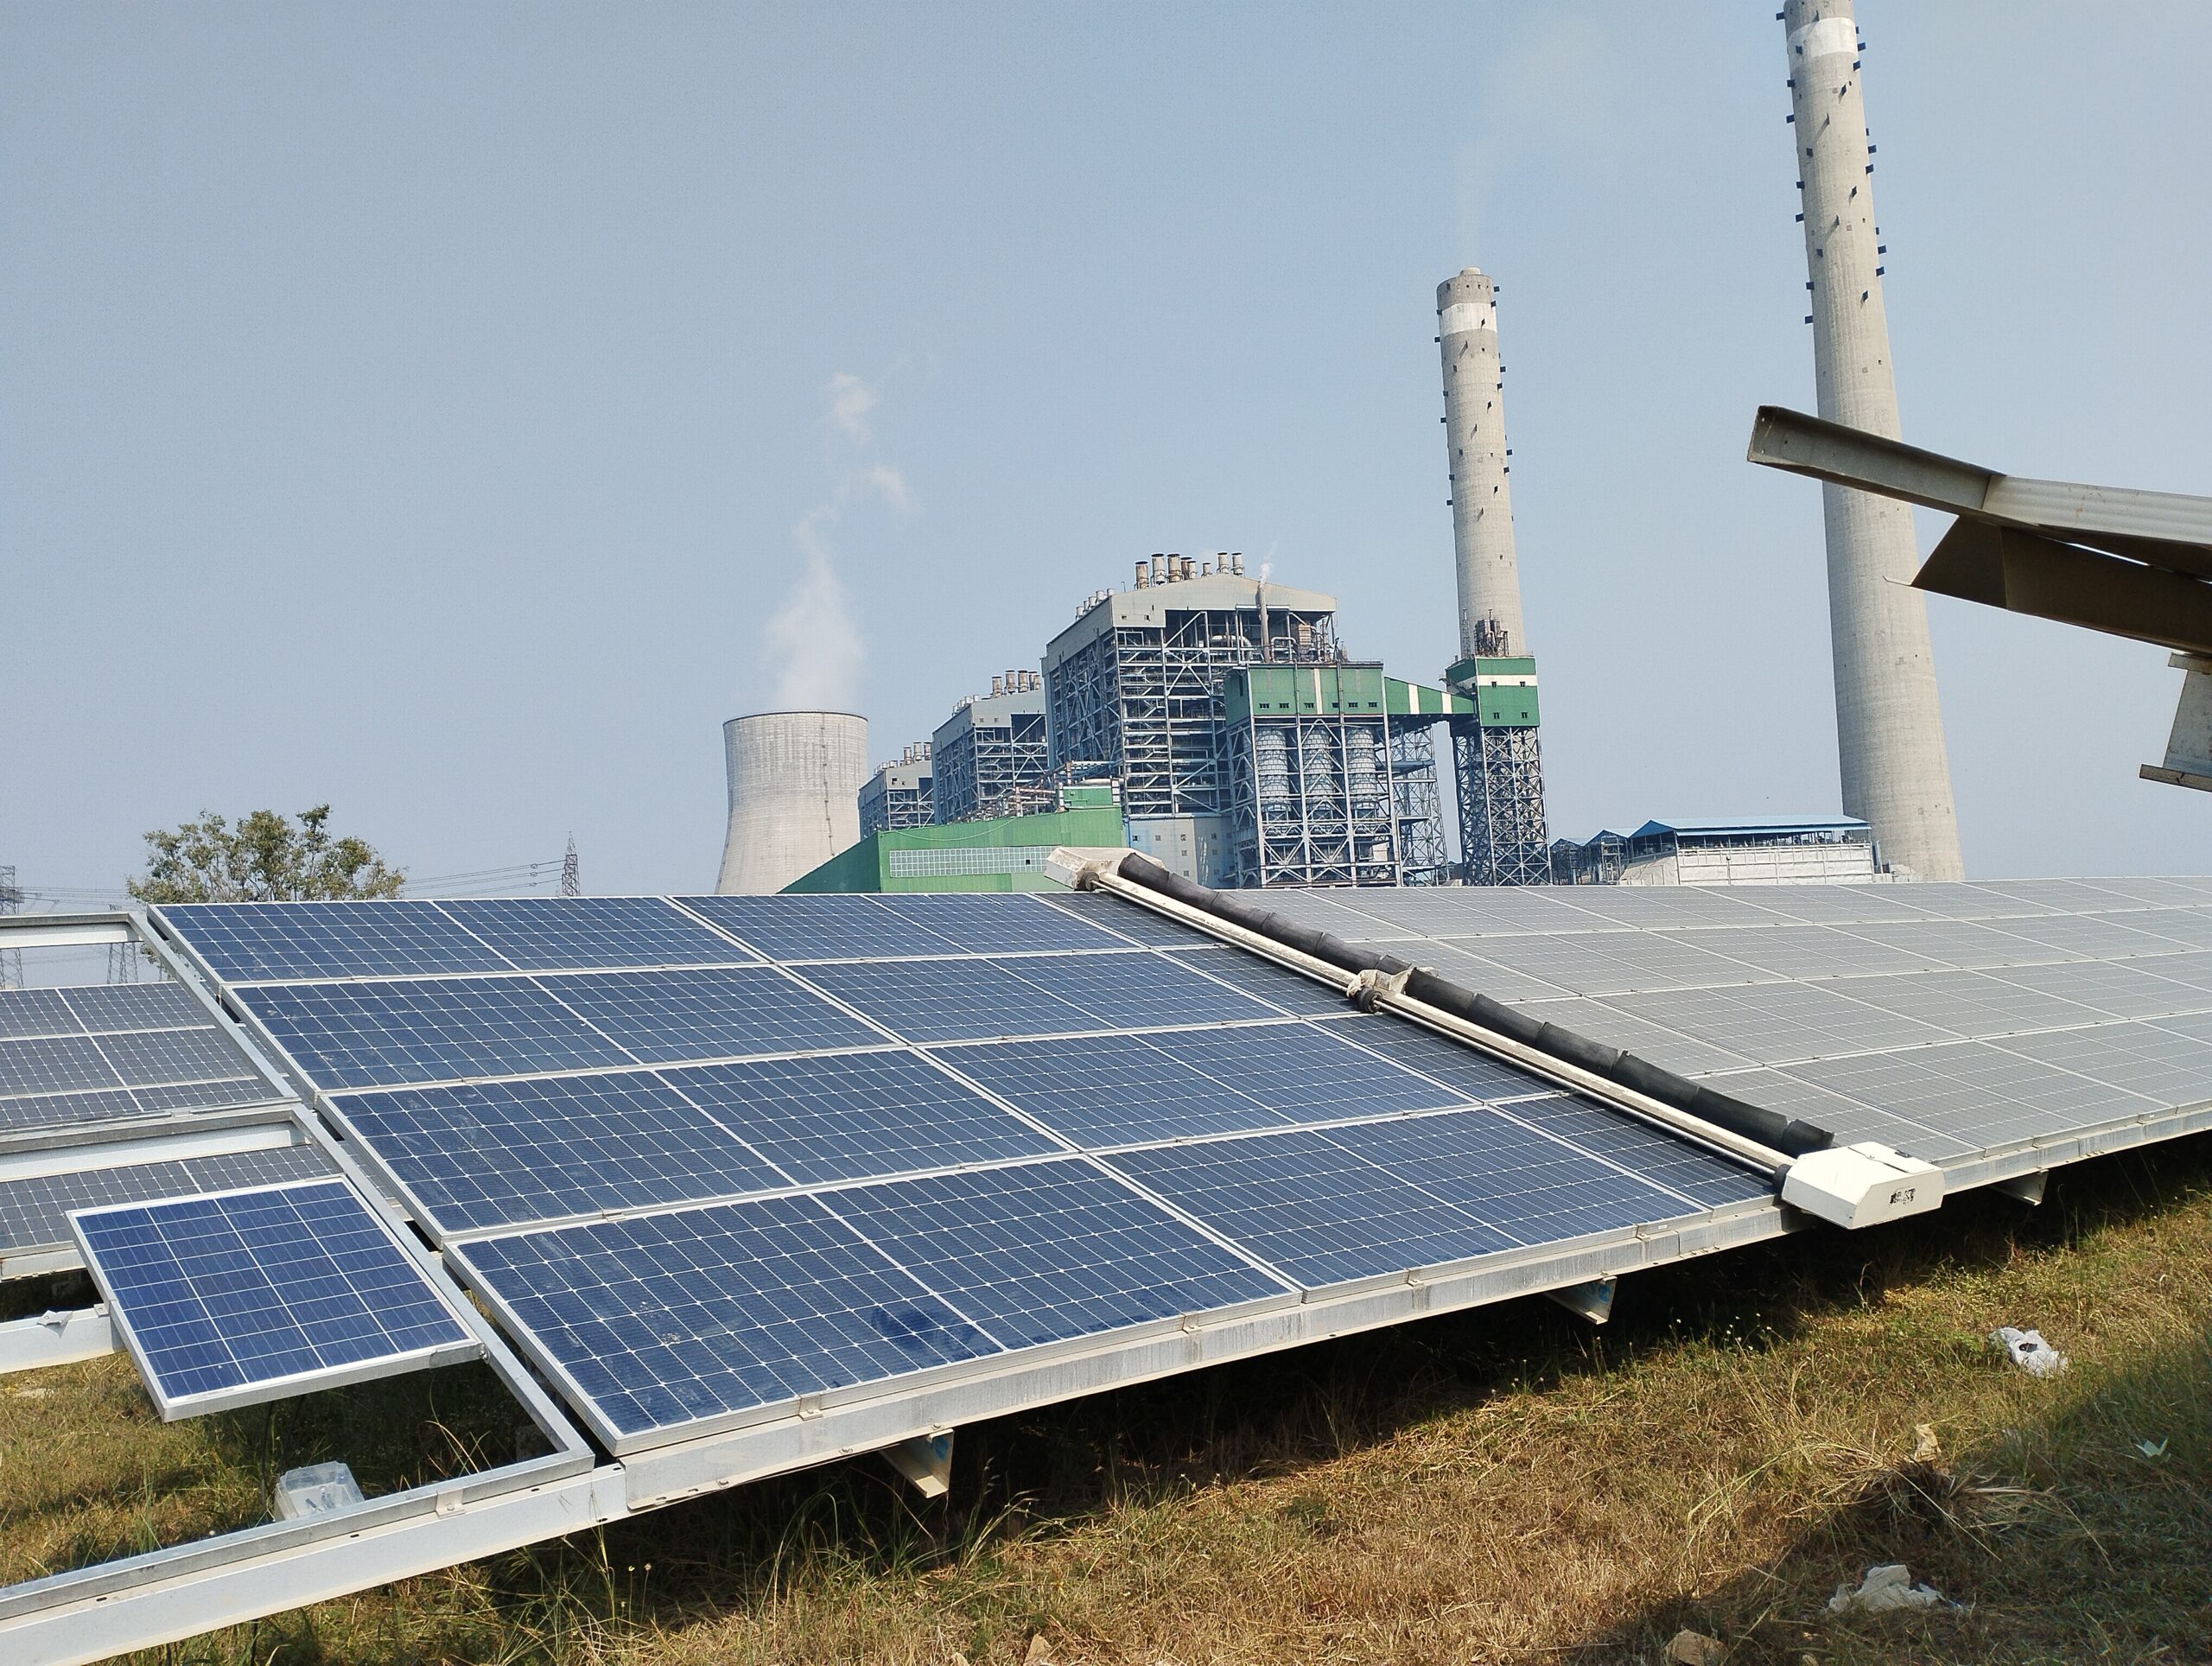
"Keep panels clean" sounds like rooftop advice. On a 100 MW PPA asset, cleanliness is a line item next to inverter spares and tracker grease, because dust is a predictable tax on performance ratio unless someone pays to remove it.
This article explains why cleaning matters at utility scale in India: how much revenue soiling costs, when rain is not enough, how regional dust profiles change the math, and how plant managers decide between manual wet crews, waterless robots, and disciplined neglect when loss is truly negligible.
Quick answer
- Soiling commonly costs 3-8% energy between cleans on dry Indian utility sites (industry-typical).
- Cleaning pays when recovered ₹/MWh exceeds fully loaded clean cost, including water, labour, downtime, and robot O&M.
- Rain is not a strategy in western dust belts or coastal salt zones.
- Measure loss with reference modules or PR baselines, not visual guesses.
- Align cleaning with utility O&M KPIs, not aesthetics.
The economics plant managers use
Take a simplified 50 MW example in Gujarat:
- Annual generation at target PR: ~80-85 GWh (site dependent)
- 5% soiling for 6 dry months: roughly 2+ GWh lost if unaddressed
- At ₹3-4/kWh PPA: that is crores in energy, not minor dust
- Fully loaded manual wet program: often ₹60 lakh to ₹1.2 crore annually at 50 MW scale
- Net benefit positive when soiling loss exceeds roughly 2-3% on average across the year
Finance teams should see cleaning as revenue recovery, not discretionary landscaping. Model options with cleaning ROI tools and 10 MW cost comparison.
Worked example: 10 MW block after a dust storm
| Metric | Before clean | After clean | Notes |
|---|---|---|---|
| PR (normalized) | 76.2% | 80.1% | 3.9 point recovery |
| Daily energy (kWh AC) | 48,500 | 50,900 | Clear May day |
| Incremental daily MWh | - | ~2.4 MWh | Storm week impact |
| Value at ₹3.50/kWh | - | ~₹8,400/day | Scales if loss persists |
One week at this loss level approaches ₹58,000 in foregone energy on a 10 MW block. Scale to 50 MW and a full dry season without recovery and the case for cleaning becomes obvious in board reviews.
Regional reality in India
| Region profile | Soiling character | Typical dry-season loss range | Cleaning note |
|---|---|---|---|
| Rajasthan / Gujarat arid | Fine dust, frequent events | 4-8% between infrequent cleans | Short intervals; water logistics costly |
| Indo-Gangetic agricultural | Harvest dust, crop burn haze | 2-5% seasonal spikes | Post-harvest surge plans |
| Coastal TN / Gujarat | Salt plus dust film | 2-4% if rinses slip | Rinse plans; corrosion watch |
| High rainfall hills | Moss, pollen, bird droppings | 1-3% localized | Less frequent but targeted |
Deep dive: average soiling losses in high-dust regions and seasonal variation in India.
What happens if you skip cleaning?
- Sustained PR depression and PPA under-performance vs financial models
- Hotspots on unevenly soiled strings where partial shading interacts with dust patterns
- Harder cemented films that need more water and labour later
- Disputes with lenders who assumed modeled cleaning in DSCR and energy yield reports
- ESG gaps when delivered green MWh trails contracted avoidance claims
Cleaning also supports safety and warranty: crews inspect while working, catching cracked glass, loose clamps, and cable tray damage early. That value rarely appears in ROI spreadsheets but shows up in availability metrics.
Manual, wet, or robotic: does method change importance?
The importance of cleanliness is fixed. The cost to achieve it varies by method, water availability, and row geometry.
| Method | Best fit | Risk if misapplied |
|---|---|---|
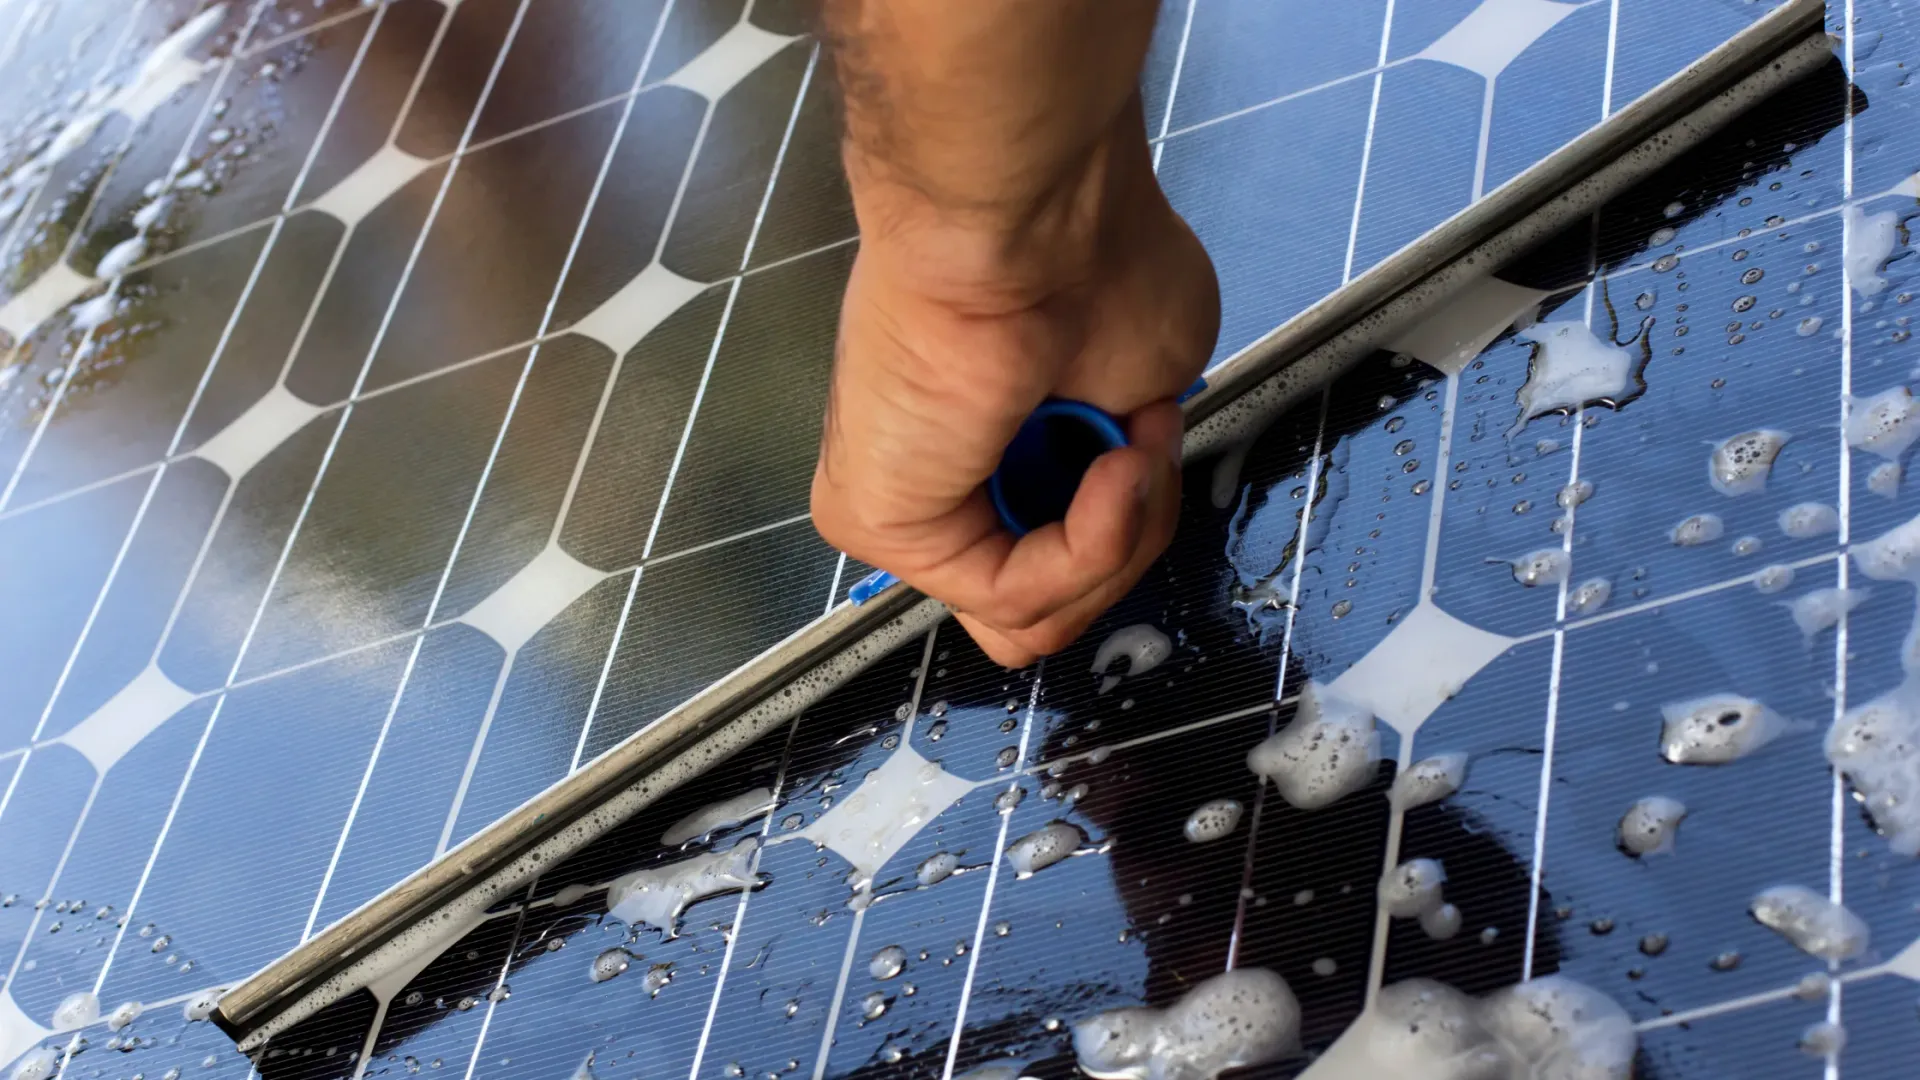
| Manual wet | Smaller fixed tilt, reliable water | Slow cycles on 50 MW+ after storms |
| Waterless robots | Arid sites, trackers, water caps | Partial row coverage after aborts |
| Hybrid by block | Mixed geometry sites | Inconsistent PR if not logged |
Compare robotic vs manual, waterless vs wet, and traditional vs waterless robots. On trackers, method must fit row geometry: tracker cleaning systems.
How do you know panels are dirty enough to clean?
Use one primary signal, not visual inspection alone:
- Soiling % from reference modules (clean vs exposed pair), or
- PR drop vs 30-day clean baseline exceeding policy (often 1.5-2.5%), or
- Forecast revenue loss over the dirty period exceeds fully loaded clean cost
Uniform dust can cut 4% output while modules still look acceptably gray to a drive-by inspection. Reference data settles arguments between O&M and asset management.
When cleaning is wasted spend
Cleaning is not always rational:
- Measured soiling below 1.5% with flat PR trend
- Upcoming monsoon rain event with verified rinse history on your site
- Block under curtailment or inverter outage where availability dominates loss
- Geometry prevents complete passes without unacceptable generation downtime
Data-driven skip decisions save water and labour for blocks that actually bleed MWh. See how often to clean in India.
Lender and off-taker questions you should expect
Debt and green power buyers increasingly ask:
- What soiling assumption was in the P90 energy model?
- How do you measure actual soiling loss on site?
- What triggers an unscheduled clean?
- What method is OEM-approved for your modules?
- How fast do you respond after dust storms?
Plants with documented answers keep covenant reviews short. Plants without data face margin calls on O&M reserves or green delivery shortfall discussions.
Cleaning ROI decision tree for plant managers
- Measure soiling % or PR delta vs clean baseline.
- Forecast dirty days until next rain or scheduled pass.
- Multiply loss by PPA tariff for forecast period.
- Compare to fully loaded clean cost including downtime.
- Clean if net positive or if loss exceeds policy cap.
- Log decision in monthly pack for audit trail.
See maintenance checklist for where this fits in monthly workflow.
Module warranty and cleaning documentation
OEM warranties permit cleaning with approved methods. Risk rises when crews use metal scrapers, unapproved solvents, or high-pressure jets near junction boxes. Document training certificates, brush specifications, and robot OEM approvals in the same folder as monthly PR packs.
Warranty disputes after dust abrasion storms are easier to navigate when cleaning logs prove timely response. Insurers and OEMs ask when the plant knew modules were soiled and what action followed.
Coastal vs interior: same importance, different method
Coastal Tamil Nadu and Gujarat blocks face salt films that reduce transmission even when dust looks light. Interior Rajasthan blocks face volume dust with different adhesion. Both need cleaning discipline; only the method and interval differ. Compare weather impact on cleanliness for regional method notes.
Stakeholder summary one-pager
For boards: soiling is predictable revenue leakage on MW assets in Indian dust belts. Measure it, price recovery at PPA tariff, compare to fully loaded clean cost, execute when net positive. Method is secondary to measurement discipline.
Key takeaways
- Cleaning is revenue protection on MW assets, not vanity.
- Budget from measured loss, not habit or calendar alone.
- Pick methods that match site water, labour, and geometry.
- Document cycles for warranty, lender, and performance audits.
Quantify soiling in rupees per month on your worst block. That single number aligns O&M and asset management faster than another generic cleanliness reminder.
Related resources
Frequently asked questions
At ₹3.50/kWh and 80% PR baseline, 5% soiling loss on a 50 MW plant can approach roughly ₹2-3 crore per year in foregone energy (order-of-magnitude; depends on yield, PPA rate, and hours). Loss scales linearly with soiling percentage.
Light rain may rinse dust in some regions; monsoon mud, agricultural residue, and post-storm cemented films often need mechanical cleaning. Coastal salt films also need planned rinses.
Frequency should follow measured soiling, not a universal calendar. High-dust sites may need weekly to biweekly attention in dry months; moderate sites may run 2-4 week cycles.
OEM warranties allow proper cleaning with approved methods. Abrasive tools, high-pressure jets aimed at junction boxes, or harsh chemicals are what create warranty risk. Document methods and training.
When measured soiling loss stays below 1.5-2% and fully loaded clean cost exceeds recovered PPA value for the forecast dirty period. Also when geometry prevents safe or complete passes without excessive downtime.
Show PR vs clean baseline, reference module data, and recovered MWh valued at PPA tariff. Tie assumptions to the energy model used in DSCR. Lenders increasingly ask why actual MWh trails P50 without a soiling narrative.