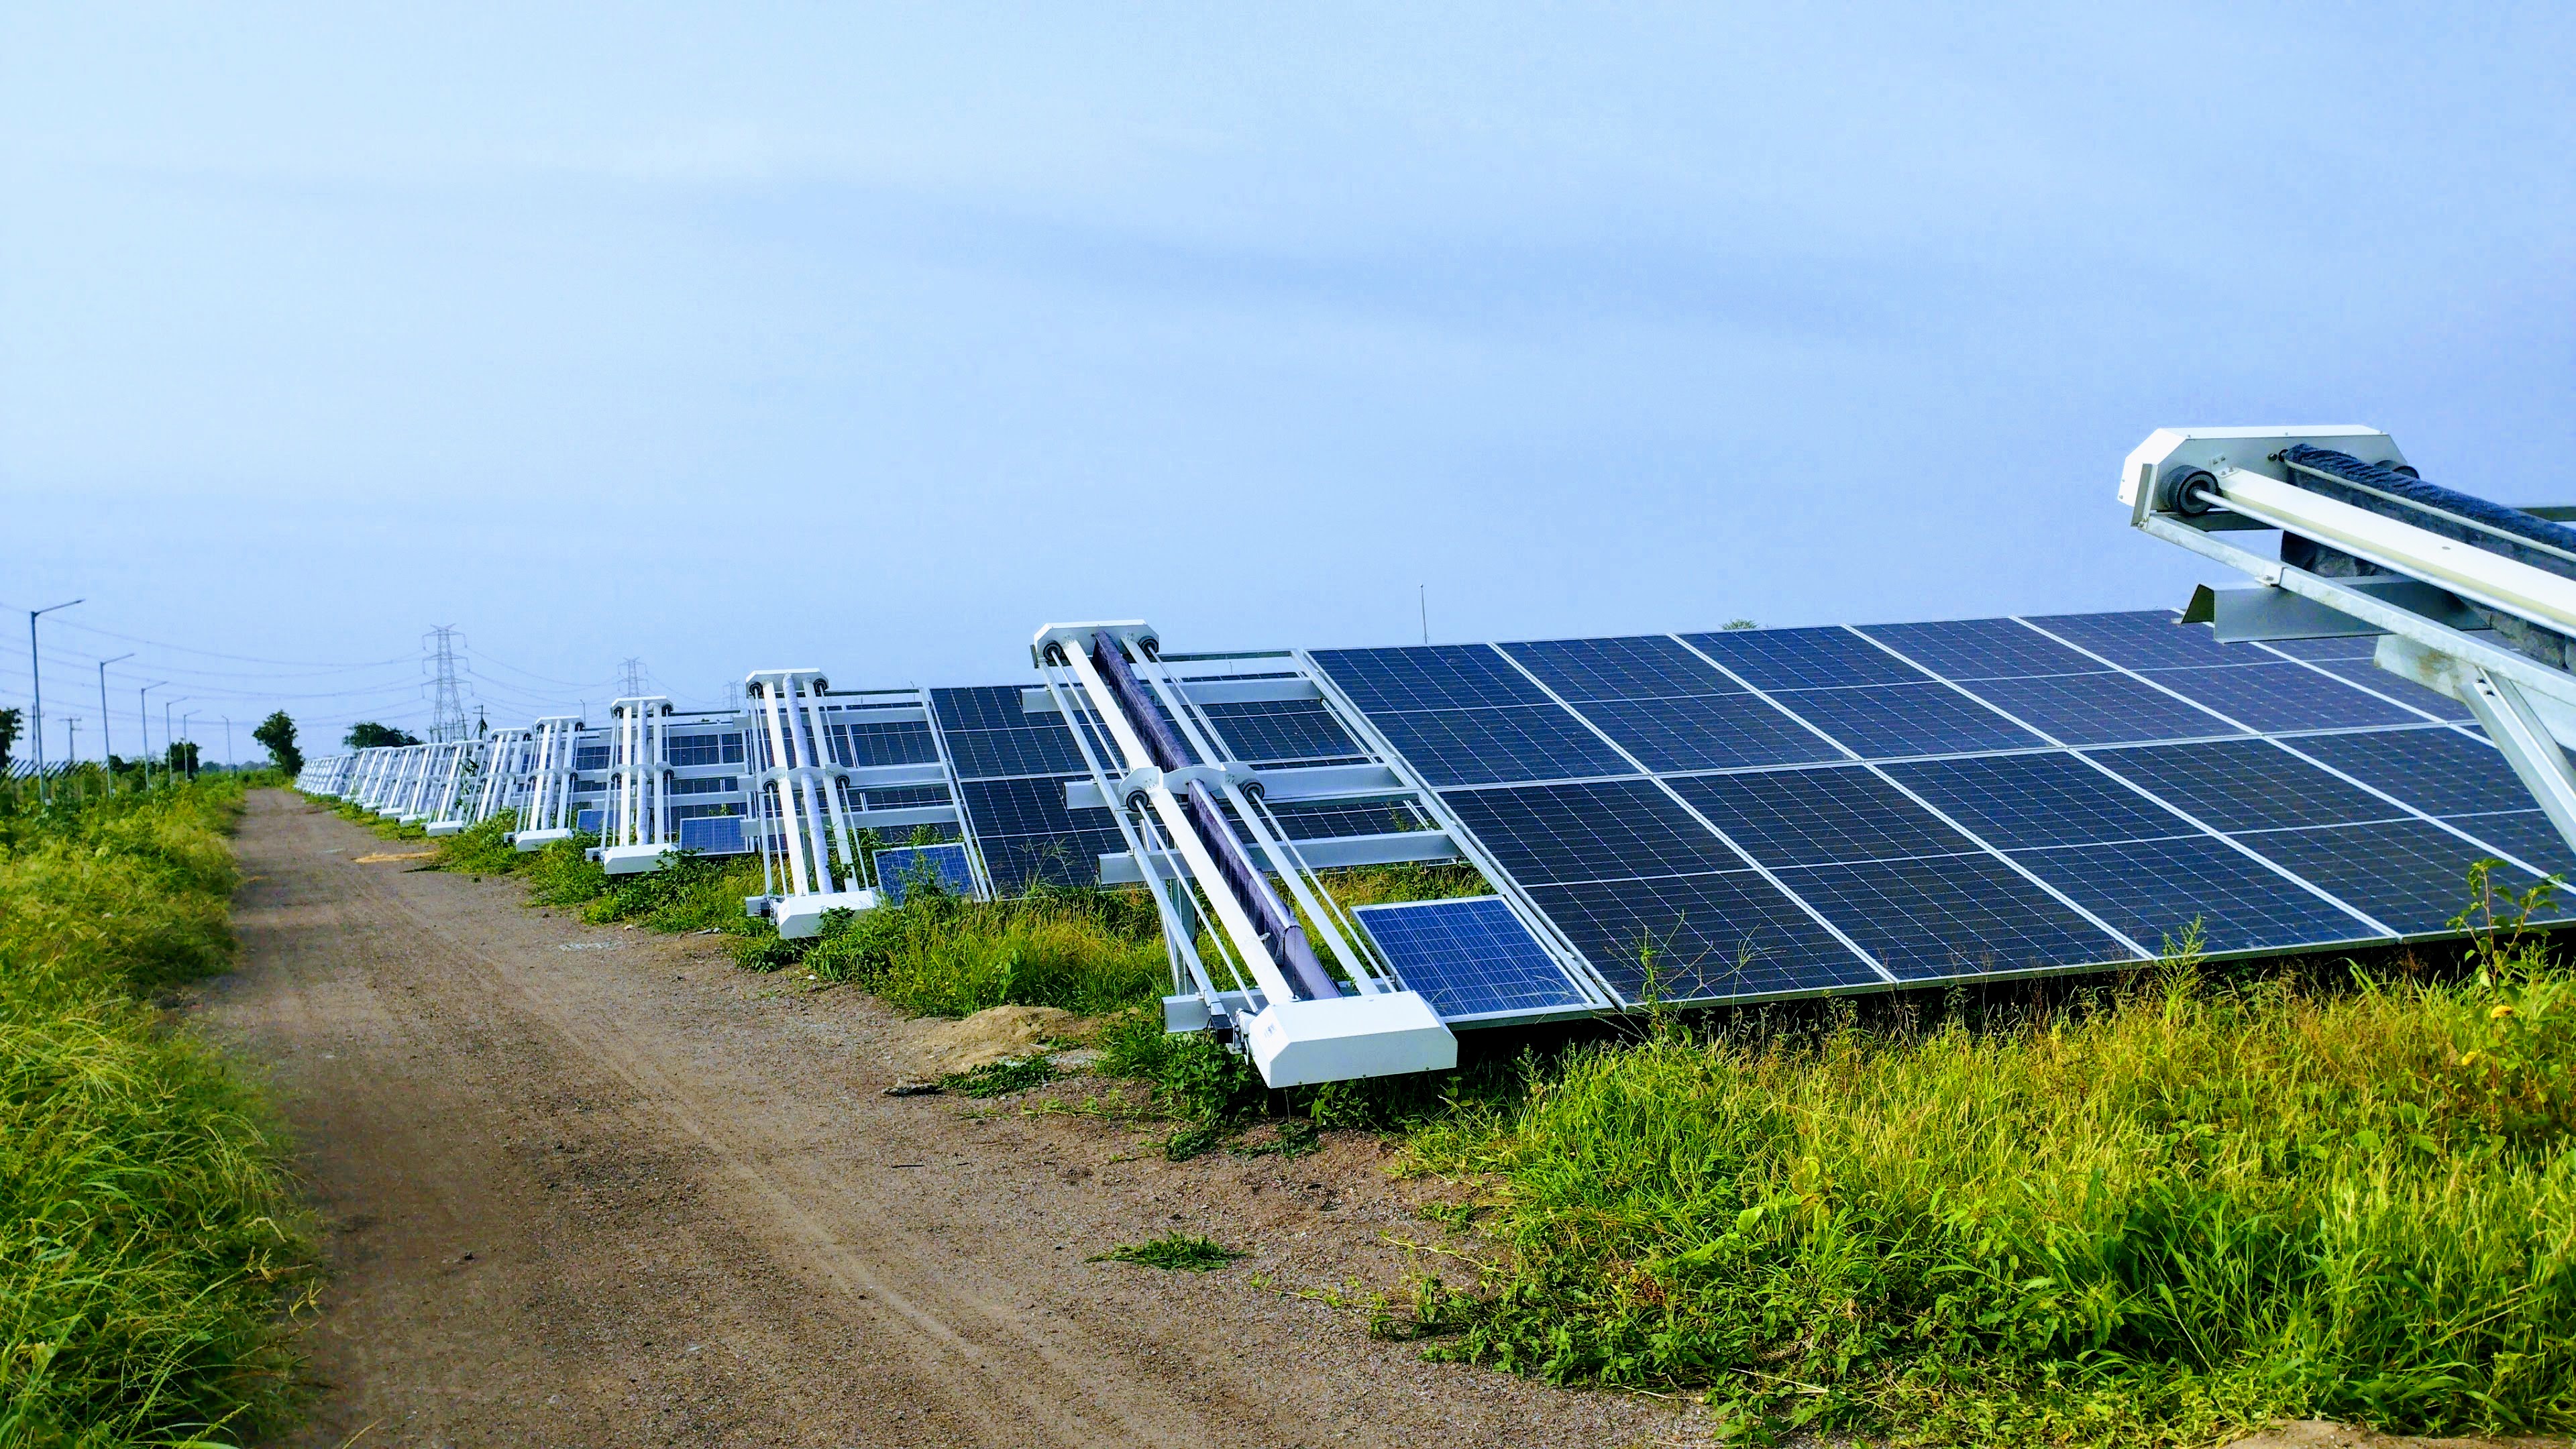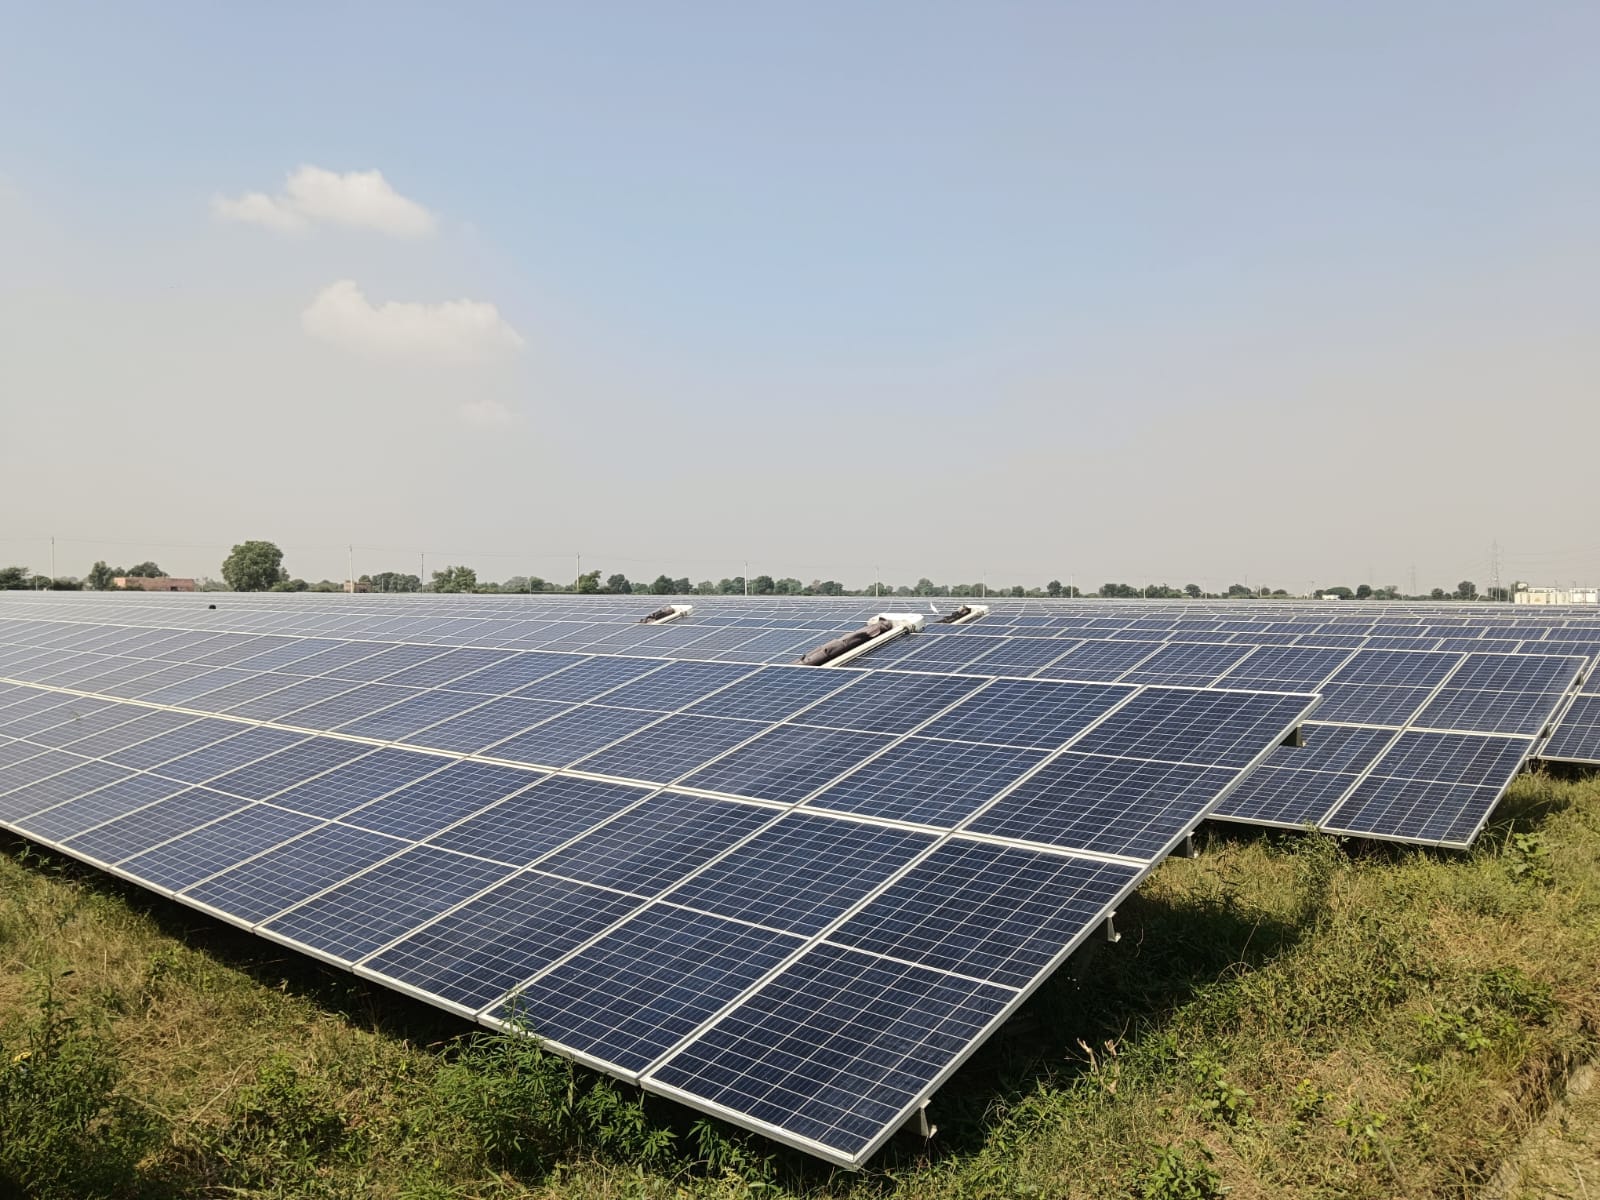
Performance ratio is how boards ask if the plant is healthy. Indian O&M teams need a repeatable PR method that separates dust from breakdowns, curtailment from clipping, and weather from neglect. Without that discipline, cleaning budgets get cut because "PR looks fine averaged across the month" while dirty blocks silently lose MWh.
This guide walks through PR calculation for 10 to 100 MW utility sites, soiling attribution, monthly reporting cadence, and how asset owners use PR to justify cleaning spend.
Quick answer
- PR = actual AC kWh divided by expected kWh from measured irradiance, normalized.
- Track a clean baseline PR after each major cleaning campaign on reference blocks.
- Flag sustained PR drops before assuming module degradation.
- Report PR separately from availability so soiling is visible.
- Connect PR trends to cleaning frequency decisions.
PR formula and definitions
At plant level over a period (day, week, month):
PR (%) = (Actual AC Energy / Expected AC Energy) × 100
Expected AC Energy derives from measured POA irradiance, installed DC capacity, inverter efficiency assumptions, and optional temperature corrections per your asset management standard. Use the same method across portfolio sites so lenders compare apples to apples.
PR is not the same as capacity utilization factor (CUF). CUF compares output to a 24-hour nameplate envelope; PR compares output to available sunlight during the period. Both matter; cleaning debates use PR.
Step-by-step monthly calculation
- Sum monthly AC energy per inverter, block, or plant from revenue-grade meters or SCADA with known calibration dates.
- Integrate onsite pyranometer POA irradiance over the same period. Apply quality flags to exclude sensor faults or soiled sensor domes.
- Compute expected energy using your AM standard (often a modeled kWh/kWp per kWh/m² ratio from commissioning baseline).
- Subtract or tag curtailment intervals per grid dispatch logs; do not blame cleaning for dispatched-down hours.
- PR = actual divided by expected, times 100%. Store block-level and plant-level values.
Data quality checklist
| Input | Common error | Fix |
|---|---|---|
| Pyranometer | Soiled dome reads low irradiance, inflates PR | Clean dome monthly; cross-check satellite |
| SCADA energy | Communication gaps filled with estimates | Flag gaps; exclude from PR or impute conservatively |
| Capacity | Offline strings still in nameplate | Use active DC capacity register |
| Curtailment | Not tagged in monthly roll-up | Separate availability metric |
Separating soiling from faults
Uniform PR drop across a block with stable inverter availability points to soiling or sensor issues. Sharp row-level dips with tracking alarms point to mechanical faults. Gradual plant-wide drift over years may indicate degradation, but Indian dry seasons often mimic degradation until a clean recovers PR within days.
Use reference modules, soiling stations, or IV curve sampling on suspect blocks. If PR jumps 2 to 4 points after clean with no hardware change, dust was the driver. See module efficiency vs PR and how cleaning increases output.
Worked example: 10 MW plant, monthly PR (illustrative)
10 MW AC plant, May period, measured POA irradiance 210 kWh/m², expected specific yield 4.8 kWh/kWp per kWh/m² (from commissioning model), active DC capacity 12 MWp.
Expected energy ≈ 210 × 4.8 × 12,000 kWp / 1000 ≈ 12,096 MWh (illustrative simplification). Actual AC export 9,320 MWh after curtailment tagging. Curtailment accounted separately; PR computed on available resource window.
| Metric | Value (illustrative) |
|---|---|
| Actual AC (available hours) | 9,320 MWh |
| Expected AC (same hours) | 11,650 MWh |
| PR | 80.0% |
| Clean baseline PR (April post-clean) | 83.5% |
| Implied soiling gap | ~3.5 PR points |
At ₹3.50/kWh, recovering 3.5 PR points might represent ₹15 to 25 lakh/month on this block depending on loss distribution. Justify cleaning spend with this delta.
Regional and seasonal context in India
Western dry-season PR swings of 3 to 8 points between cleans are common on uncleaned or under-cleaned blocks. Monsoon may lift PR temporarily from rain rinse while mud under tables creates localized dips. Coastal salt films depress PR gradually without dramatic visual dust. Build seasonal baselines rather than one annual target.
Weather triggers: weather impact on panel cleanliness. Seasonal guide: soiling variation in India.
Reporting cadence for asset owners
- Daily: availability and major alarms for control room.
- Weekly: block PR trend vs clean baseline during dust season.
- Monthly: formal PR and availability pack for asset management and lenders.
- Post-clean: before/after PR memo on reference blocks within 14 days.
O&M hub: utility-scale solar operations. Broader maintenance: improving solar output.
How should plant managers use PR to set cleaning frequency?
Define an economic PR floor relative to clean baseline (example: clean when block PR drops more than 2 to 4 points for five consecutive days above availability threshold). Combine with storm protocols from weather playbooks. Avoid calendar-only schedules that ignore measured drift.
Block-level vs plant-level PR for cleaning decisions
Plant-level PR averaging hides dirty blocks. Compute PR per inverter group or block where SCADA allows. Cleaning dispatch should target blocks with largest gap to clean baseline, not plant average alone. On 10 MW sites, one dirty 2 MW segment can justify targeted clean while others wait.
Clipping, curtailment, and PR interaction
High irradiance days with inverter clipping flatten PR peaks. Do not misread clipped days as soiling recovery failure after cleans. Tag curtailment intervals separately. Availability metrics should exclude grid-down hours from PR denominator per your asset standard.
Annual PR review agenda for asset managers
- Compare each block dry-season PR vs monsoon PR.
- Map cleaning dates to PR inflection points.
- Flag blocks where clean baseline decays year-on-year (possible degradation vs sensor drift).
- Update cleaning frequency model with measured soiling, not assumptions.
Connect to importance of clean panels and cleaning efficiency gains.
Software and spreadsheet implementation tips
Most operators use SCADA exports plus Excel or asset management SaaS. Lock formula cells to prevent analyst drift. Document irradiance source hierarchy: onsite pyranometer primary, satellite secondary with bias correction updated quarterly. Version-control PR templates across portfolio sites.
Communicating PR to non-technical boards
Translate PR point changes to rupee revenue at PPA tariff and MWh equivalents. A 3-point PR drop on 10 MW in May is easier to fund cleaning against when shown as ₹ lakh per week rather than percentage alone.
Common PR reporting errors on Indian utility sites
Teams often mix availability into PR narratives, hiding soiling behind inverter outages. Others use satellite irradiance when on-site pyranometers drift, inflating expected energy and masking loss. Curtailment not normalized makes March look like a cleaning problem when the grid limited export.
Fix the methodology once in the O&M manual: irradiance source, temperature correction, curtailment treatment, and clean baseline definition. Auditors and lenders compare year-on-year only when the formula is stable.
Key takeaways
- One PR methodology across portfolio sites enables comparison and audit defense.
- Always report availability separately from PR.
- Use clean baselines and reference blocks to attribute soiling.
- Monthly PR packs justify cleaning ROI to finance teams.
- Fix data quality before blaming modules or vendors.
Document your PR formula in the O&M manual and use the same method across blocks. Mixed methodologies are the fastest path to cleaning budget disputes.
Related resources
Frequently asked questions
Performance ratio is actual AC energy output divided by theoretical output given measured plane-of-array irradiance and installed capacity, expressed as a percentage after normalization for temperature and known curtailment. It is the primary health metric for comparing weeks and blocks on the same site.
Many operators target roughly 75 to 85% depending on trackers, age, inverter make, and cleaning intensity. Dusty uncleaned blocks in Rajasthan or Gujarat dry season may sit several points lower until cleaned. Compare against your own clean baseline, not a national sticker target.
Uniform dust reduces effective irradiance on modules, lowering PR across a block until cleaned. Soiling typically presents as gradual drift without matching inverter fault alarms. Separate soiling from breakdowns using availability metrics and reference modules.
Inverter AC energy at block or plant level, onsite pyranometer or quality-flagged satellite irradiance, DC nameplate capacity, temperature data if applying corrections, and curtailment or grid outage logs with timestamps.
Establish 14 days of pre-clean PR on a soiled reference block, execute the clean, then measure 7 days post-clean PR with similar irradiance conditions. A sustained PR lift without inverter availability change strongly indicates soiling recovery.