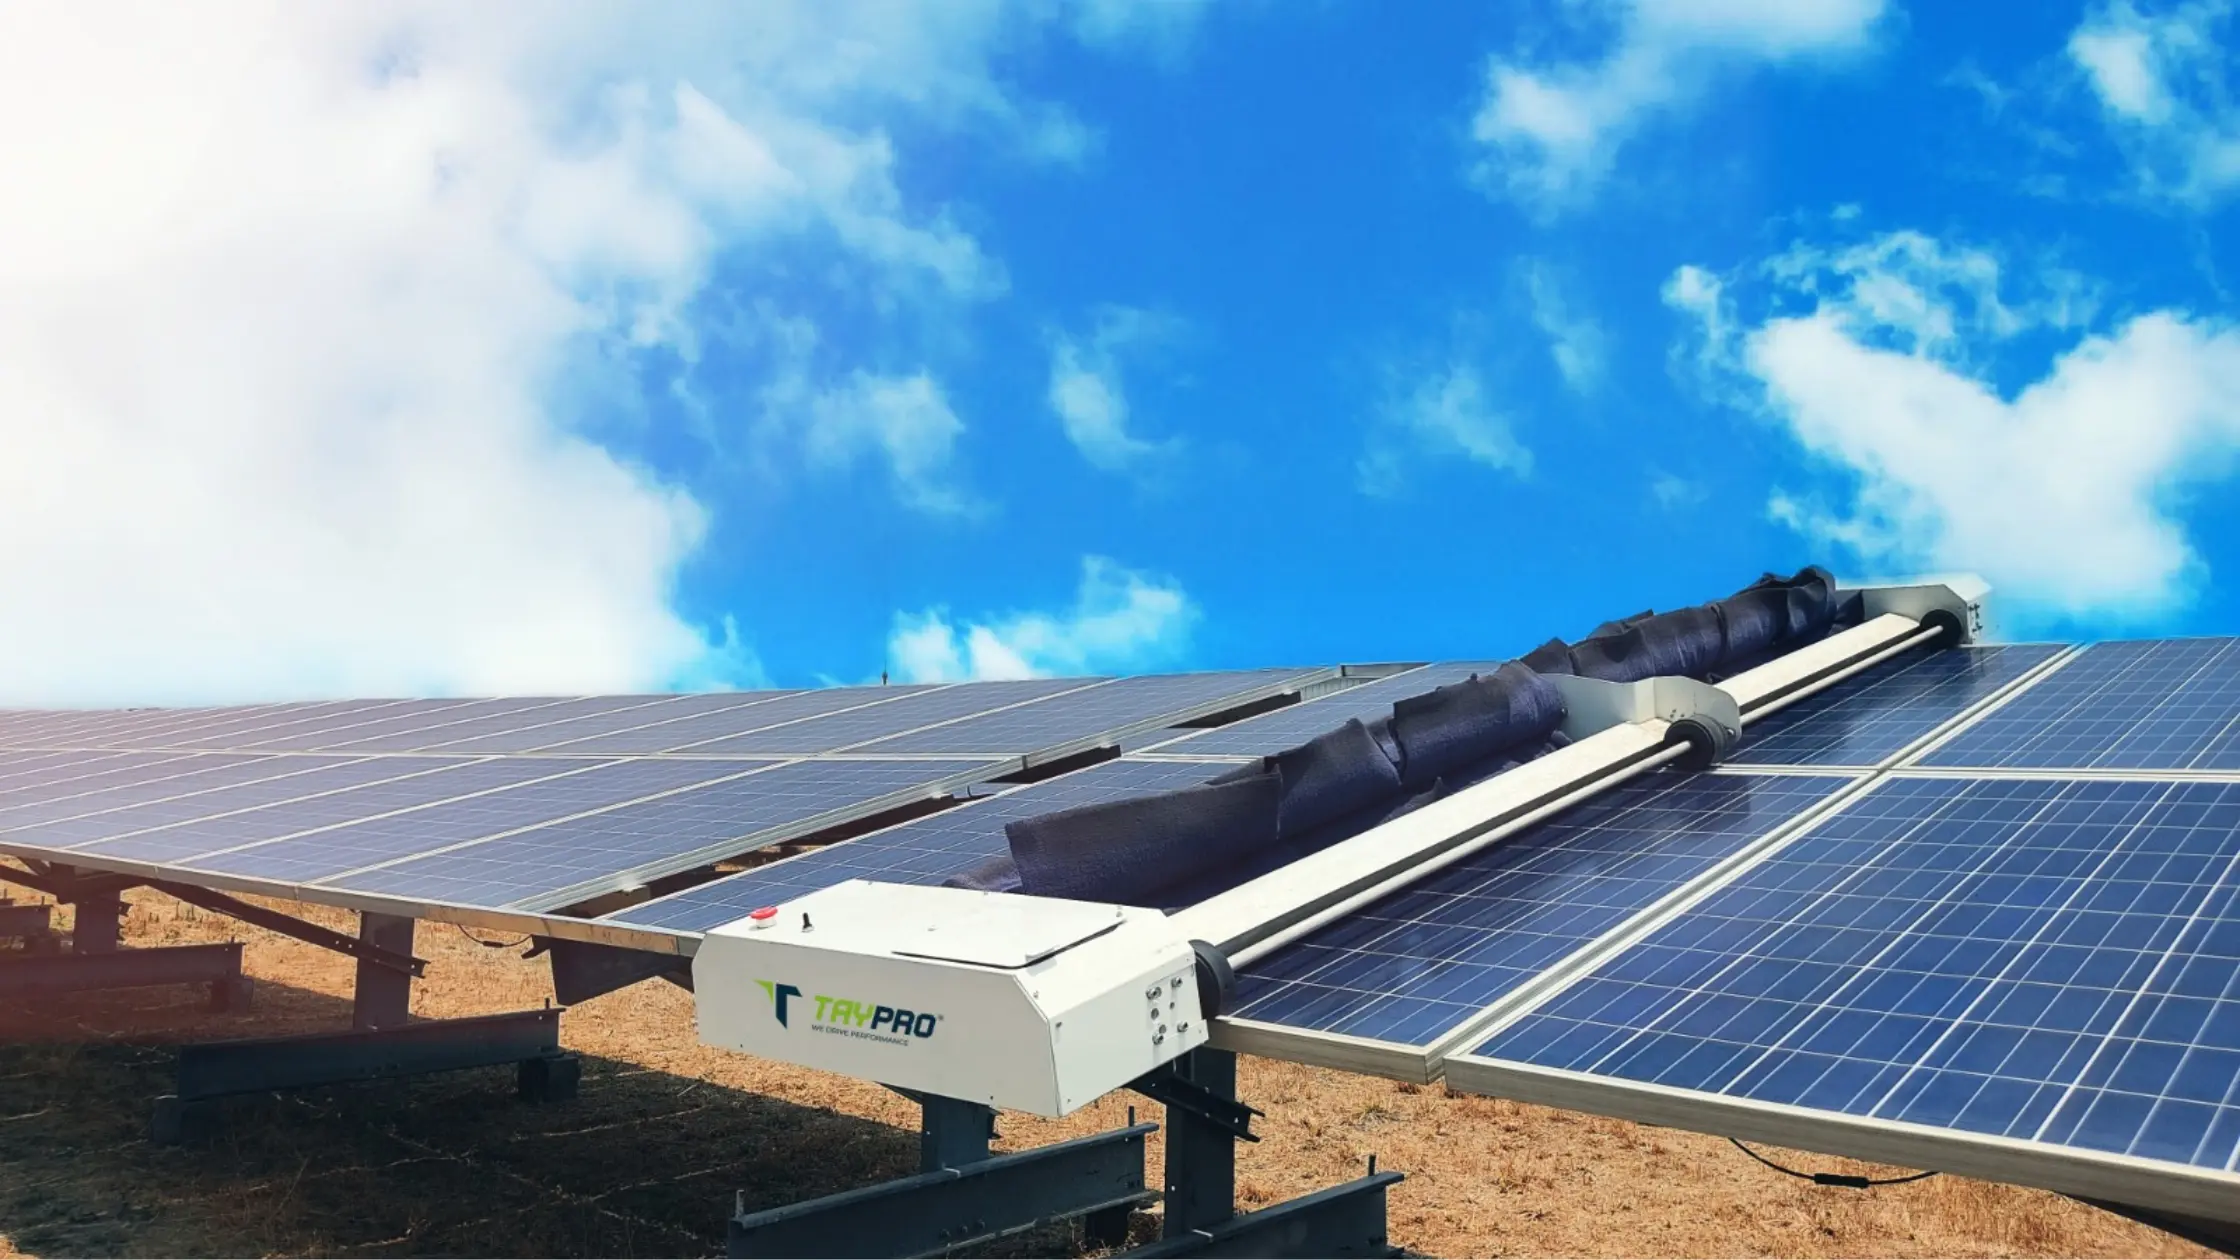
Cleaning robots and SCADA platforms both get labeled automation, but performance monitoring answers a different question: where is energy leaking right now, and is the loss soiling, mechanical, or electrical? For Indian utility fleets, the shift is from monthly PDFs to continuous signals that trigger field work within hours.
This article maps the monitoring stack for 10 MW to 100 MW plants, shows how automated cleaning systems feed performance data back to control rooms, and gives worked examples for when numbers should open a ticket.
Quick answer
- Layer SCADA PR, reference modules, and weather for daily visibility.
- Automated cleaning systems should report coverage and timing, not replace PR analytics.
- Set economic thresholds (e.g., 3% soiling loss) to open tickets.
- Integrate tracker, inverter, and cleaning data in one O&M view.
- Start with worst blocks first on 50 MW+ sites.
Monitoring stack for MW plants
| Layer | What it catches | Typical cadence | Typical owner |
|---|---|---|---|
| Inverter SCADA | String outages, clipping, comms loss | Real time | Control room |
| Weather / irradiance | PR normalization errors | 1-15 minute | SCADA / met team |
| Reference modules | Soiling % | Daily compare | O&M lead |
| Thermography | Hotspots, PID suspects | Quarterly rotate | Electrical contractor |
| Cleaning fleet logs | Missed rows, downtime | Per pass | Robot operator |
| Tracker telemetry | Stuck rows, stow faults | Real time | Mechanical team |
Beyond cleaning: electrical performance monitoring
Soiling is visible in PR trends. Connector degradation, fuse fatigue, and tracker misalignment are not. Automated performance workflows should include:
- String-level deviation rules (percent from block median)
- Tracker row availability tied to shadow patterns on neighbors
- Repeat alarm clustering so technicians fix root causes, not symptoms
- IV curve sampling on strings flagged by persistent deviation
Read how to calculate performance ratio so monitoring KPIs match finance models used in DSCR and board packs.
Worked example: ranking blocks by rupee loss
A 60 MW plant splits into four 15 MW blocks. Weekly PR vs clean baseline:
| Block | PR delta | Est. daily MWh loss | Daily ₹ at ₹3.50/kWh | Likely cause |
|---|---|---|---|---|
| A | -4.2% | ~25 MWh | ~₹8.75 lakh | Soiling post-storm |
| B | -1.1% | ~6.5 MWh | ~₹2.3 lakh | Monitor |
| C | -0.4% | ~2.4 MWh | ~₹0.84 lakh | Within noise |
| D | -2.8% | ~17 MWh | ~₹5.95 lakh | Tracker row offline |
Block A gets cleaning surge. Block D gets mechanical ticket before cleaning spend. Without block ranking, crews clean Block C while Block A bleeds revenue.
When should monitoring trigger a clean?
Calendar cleaning ignores economics. A common utility approach:
- Estimate soiling loss from reference data or calibrated models.
- Multiply loss by expected revenue for the forecast dirty period.
- Compare to fully loaded cleaning cost (labour, water, robot O&M, downtime).
- Clean when net benefit is positive, or when loss exceeds policy cap (e.g., 4%).
Cleaning frequency guidance for India, robotic vs manual economics, and why cleaning matters help set the cost side.
Integrating robotic fleets with SCADA
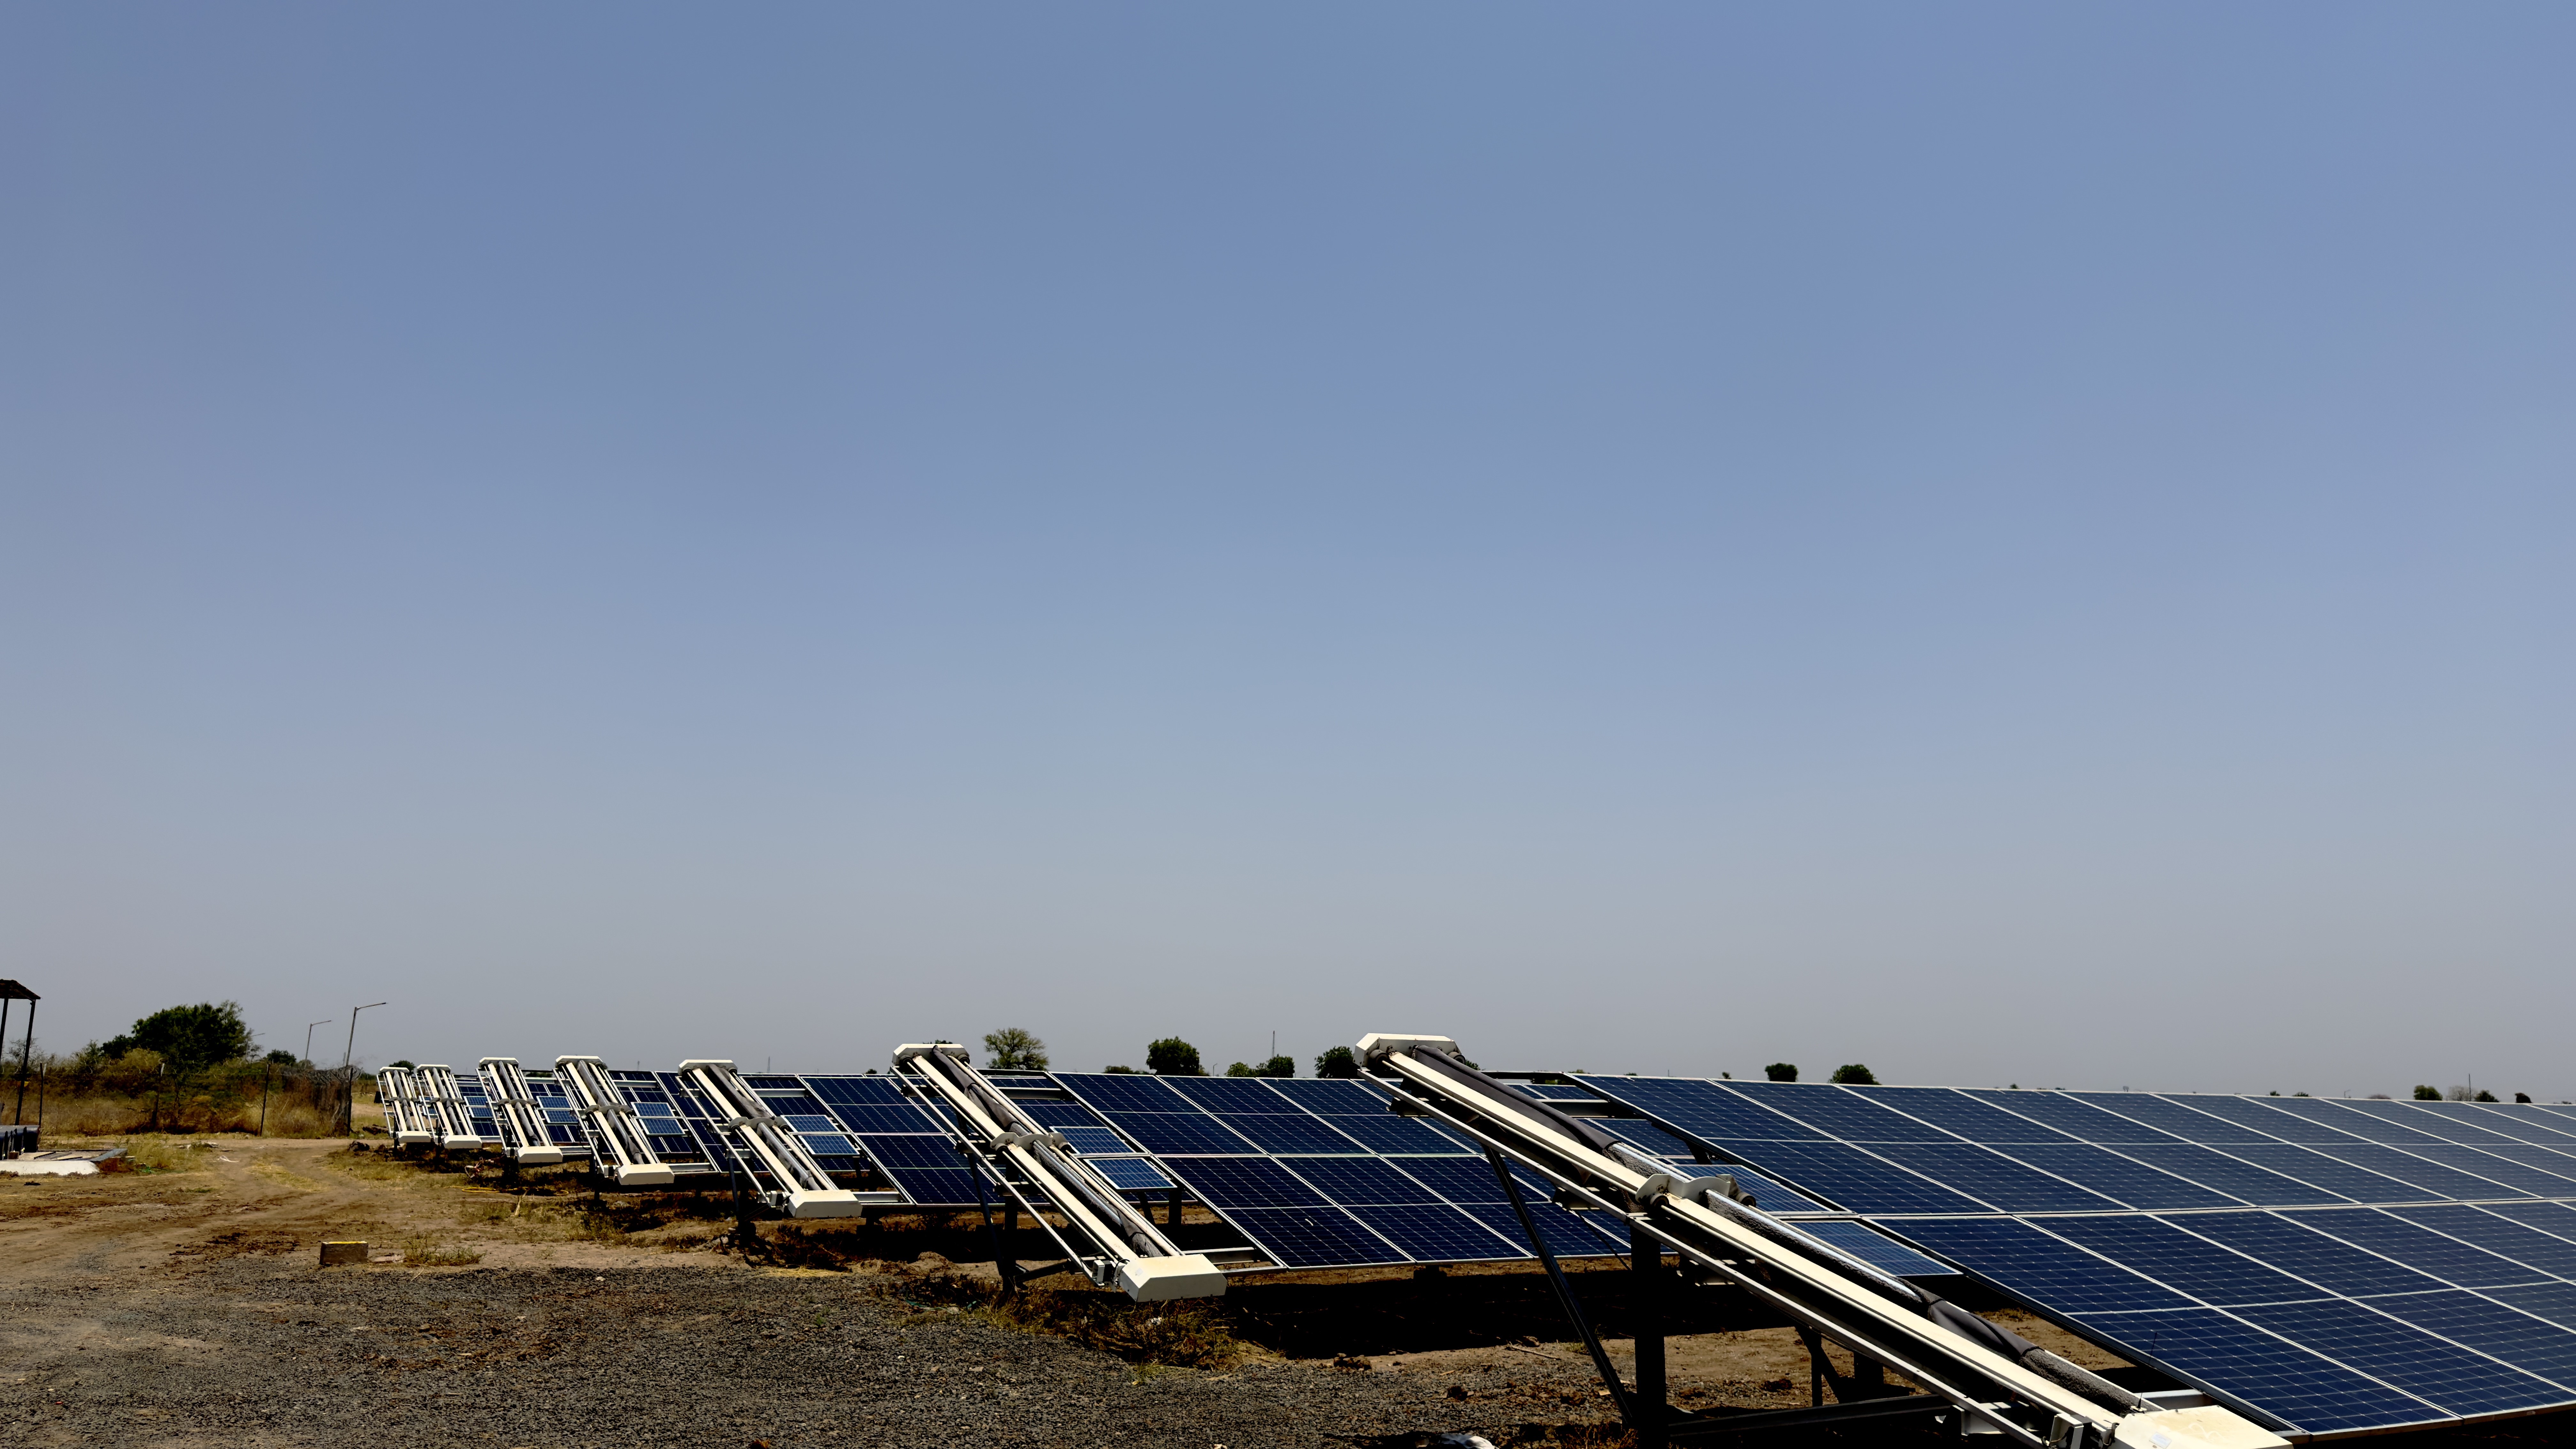
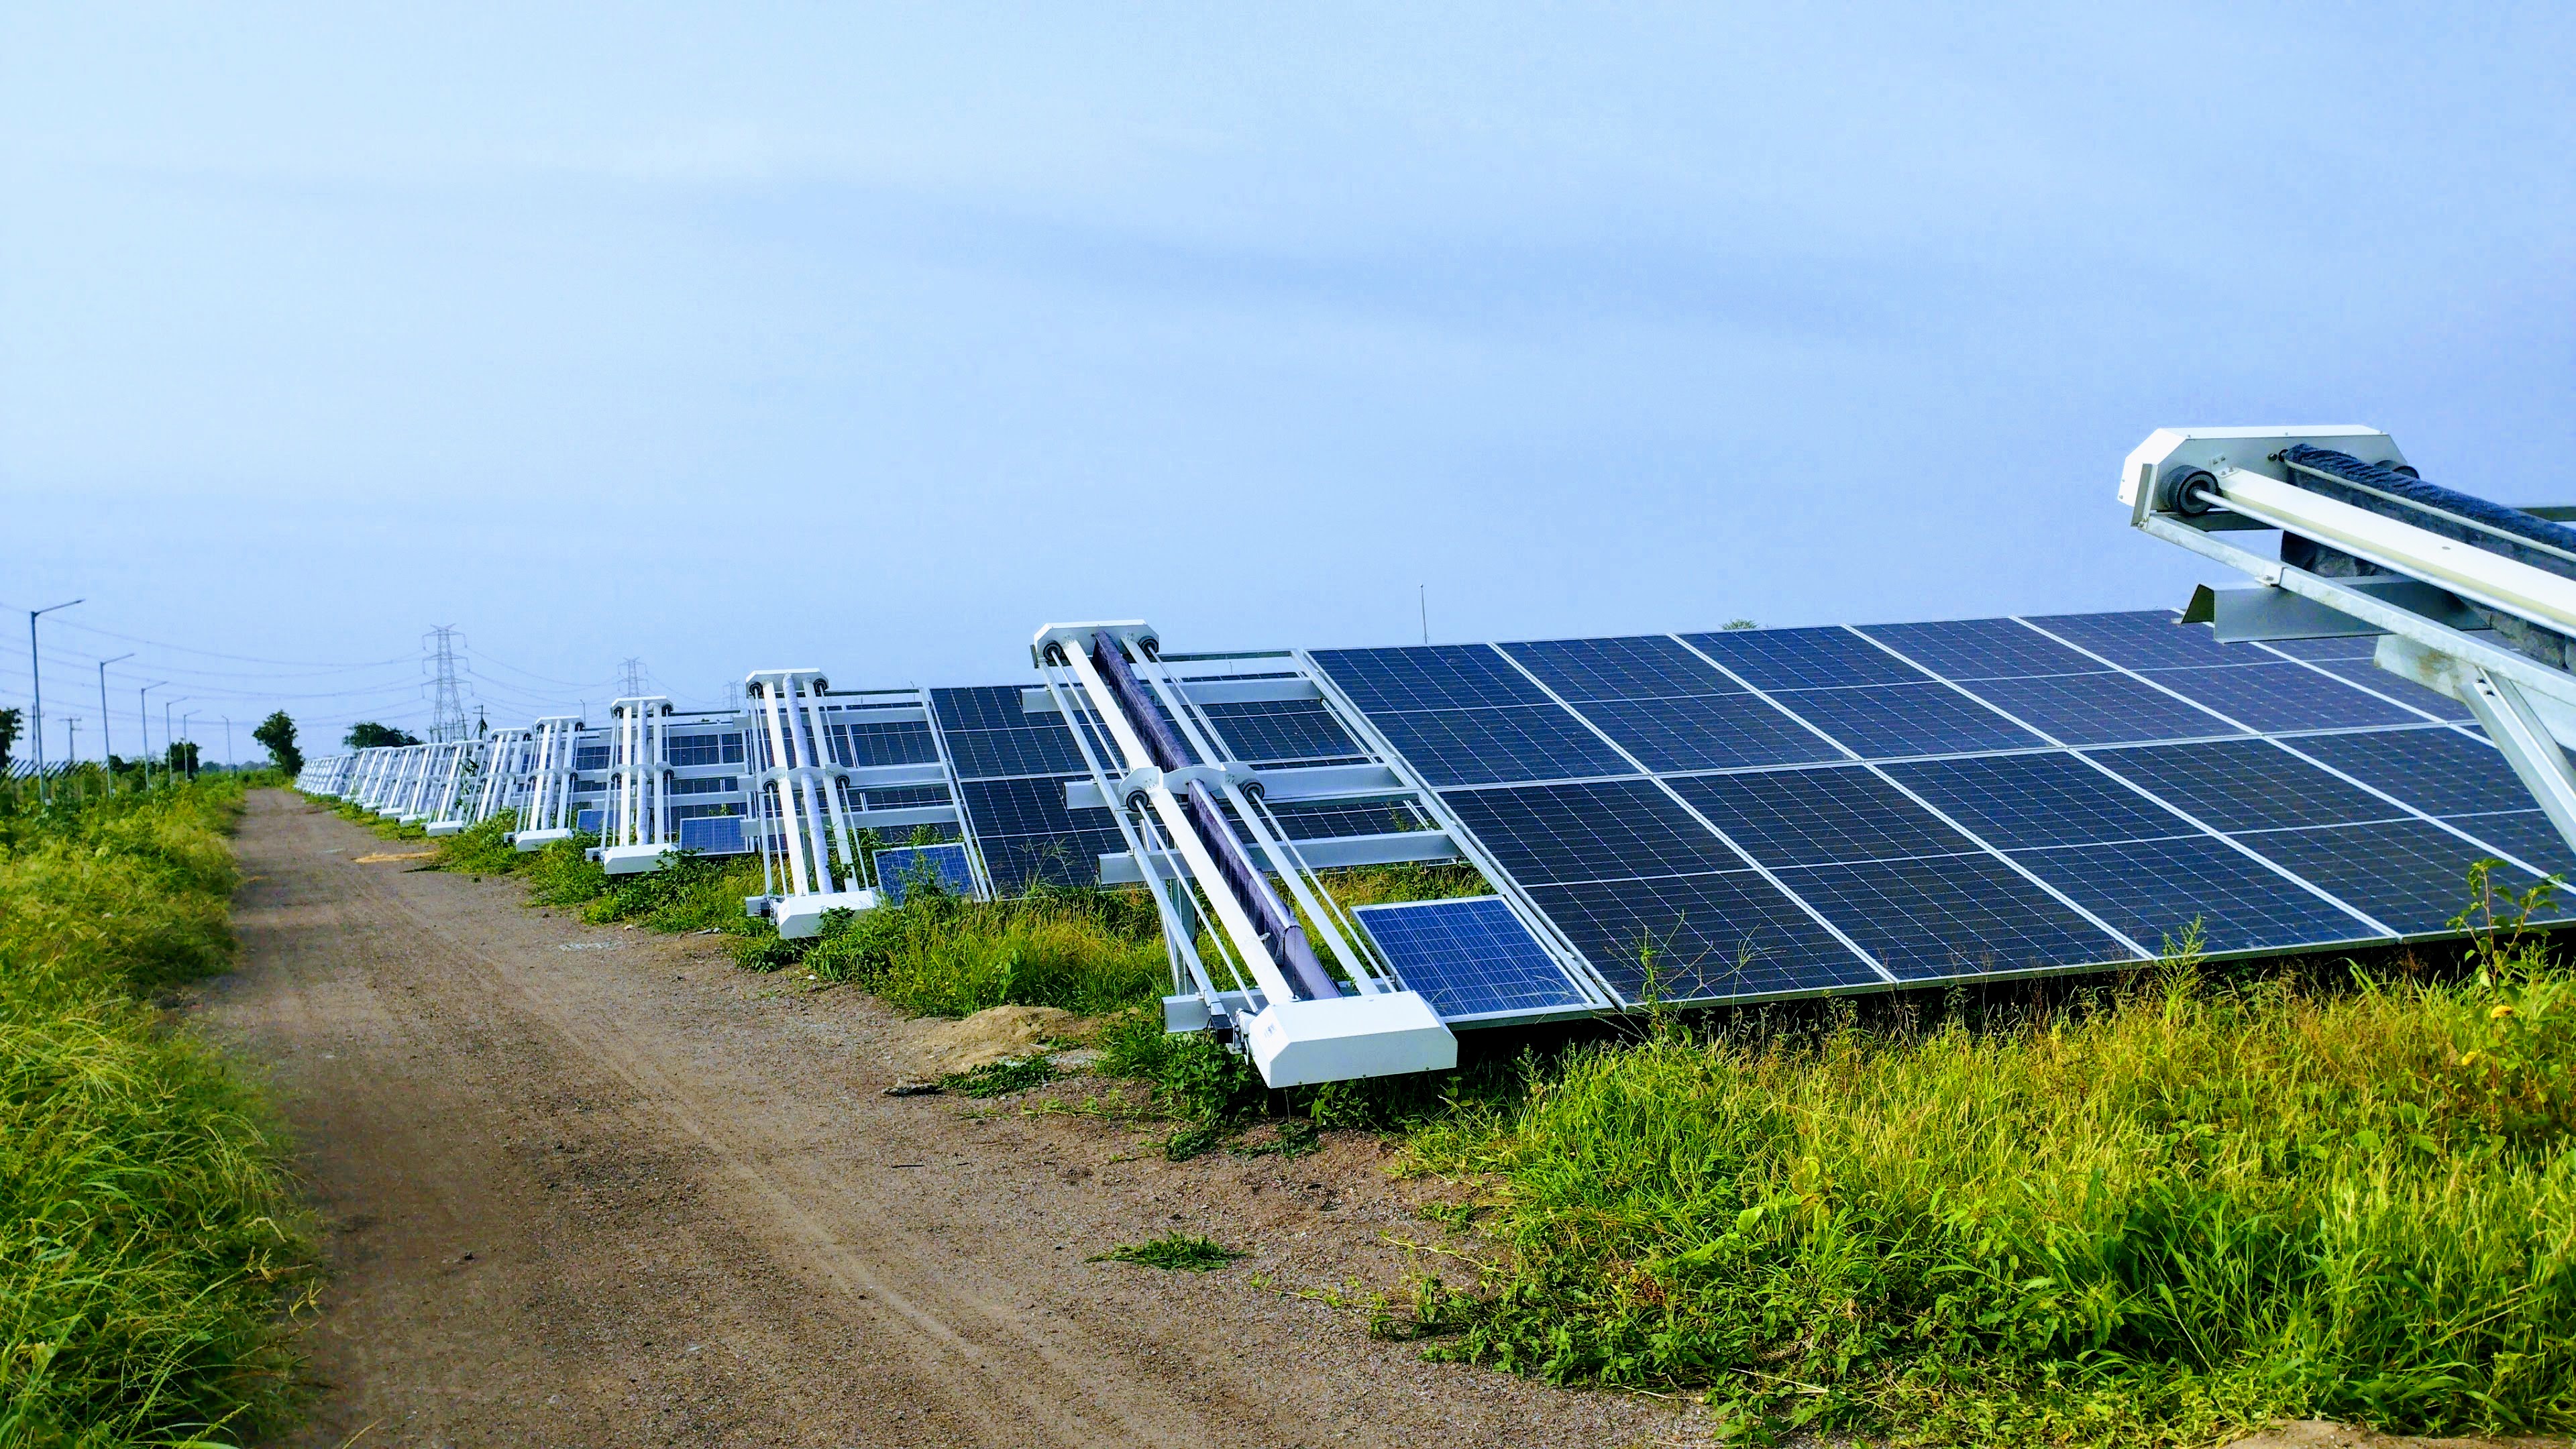
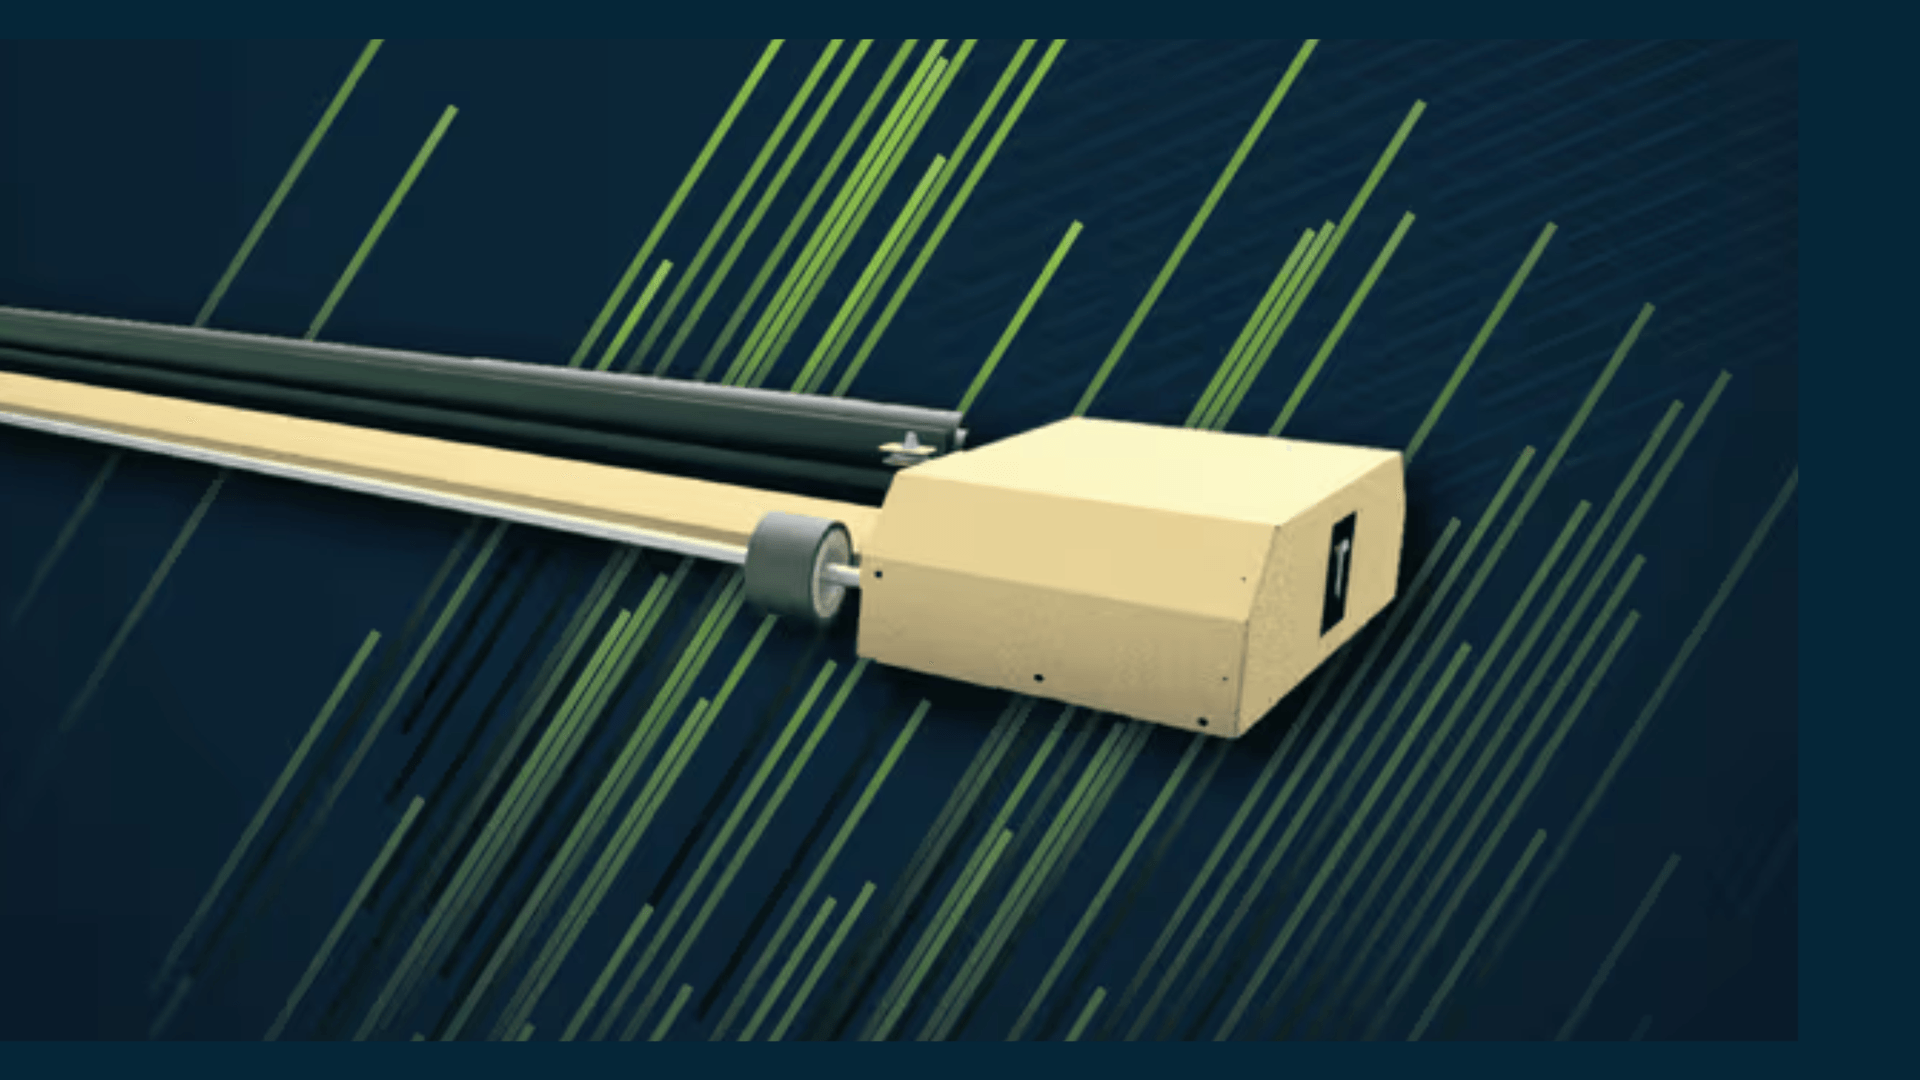
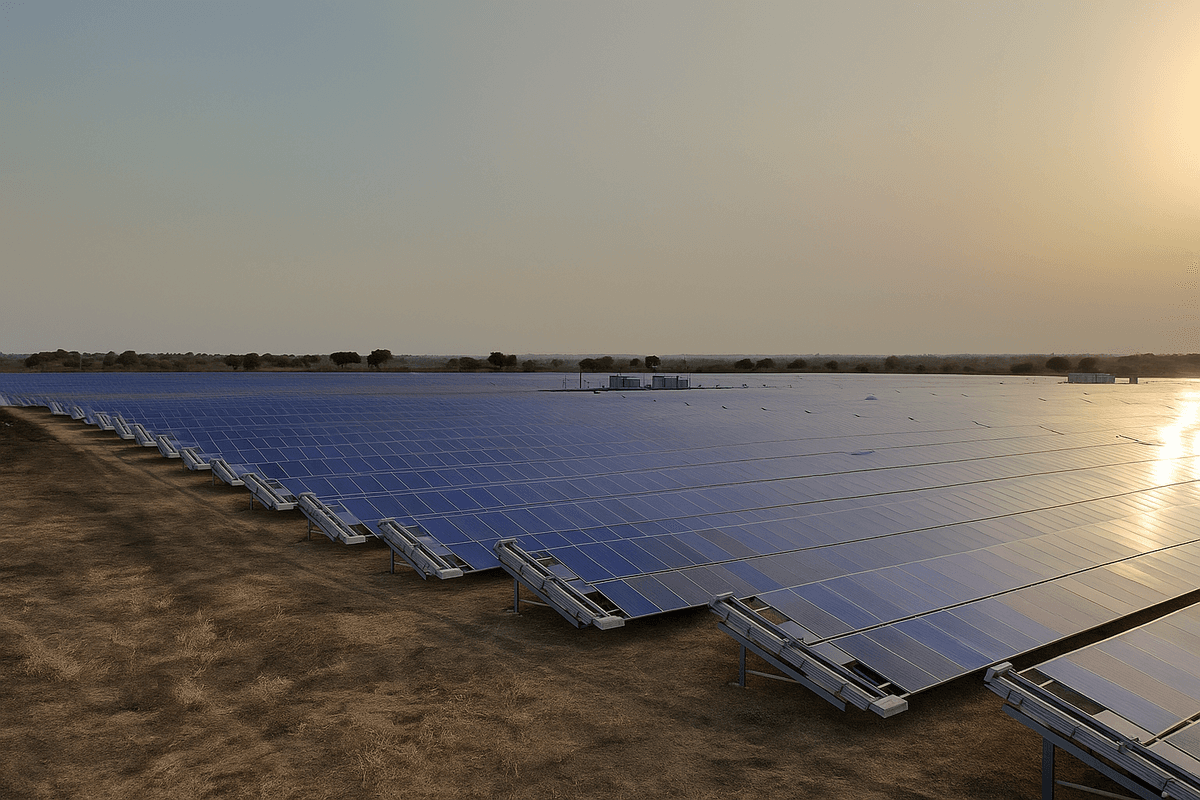
On tracker and fixed-tilt plants using automated cleaning, pass logs should show:
- Rows completed vs planned
- Abort reasons (wind, comms, obstacle)
- Time since last pass per block
- Operator interventions and battery swap events
Correlate pass gaps with PR dips to prove O&M value to asset managers and lenders. A robot that misses 15% of rows after a storm performs like an expensive partial manual round.
Automated monitoring vs manual SCADA review
| Plant size | Manual review alone | With thresholds and ranking |
|---|---|---|
| 10 MW | Often sufficient with disciplined shift engineer | Nice to have |
| 30-50 MW | Alarm fatigue risk in dust season | Recommended |
| 100 MW+ | Usually insufficient | Expected by lenders |
AI prioritization is less about replacing people and more about ranking which of 400 alarms today will cost the most MWh if ignored. See how AI improves plant output.
Common monitoring mistakes on Indian sites
- Using unstabilized PR without irradiance quality checks
- Ignoring availability when blaming soiling in monthly reports
- Buying dashboards with no integration to work-order systems
- Skipping calibration after module washing of reference cells
- Treating satellite soiling maps as ground truth without local reference
- Cleaning full plant when only two blocks exceed threshold
Minimum viable monitoring program (50 MW)
- One reference module pair per 15 MW block
- Daily block PR with quality-checked pyranometer
- Weekly rupee-loss ranking exported to asset management
- Cleaning and robot logs in same spreadsheet or CMMS as SCADA exports
- Monthly reconciliation: recovered MWh vs monitoring and clean spend
Scale up with soiling stations, IV tracers, and analytics as portfolio grows. Start with signals that create tickets.
SCADA data quality checklist
Monitoring fails when inputs lie. Before buying analytics, verify:
- Pyranometer calibration date and cleaning schedule
- Inverter time sync across blocks
- Curtailment flags separated from fault flags
- Cleaning dates annotated in data lake or export
- Reference module clean dates logged
Garbage in produces confident wrong rankings. Fix instrumentation before algorithms.
Vendor evaluation scorecard
| Criterion | Weight | Pass test |
|---|---|---|
| Work-order integration | High | Creates ticket from threshold |
| Block-level PR | High | Not plant-average only |
| Soiling attribution method | High | Documented and auditable |
| Robot log ingestion | Medium | Pass coverage visible |
| Indian dust season tuning | Medium | Pilot on your blocks |
Run a 90-day pilot on your dustiest block before enterprise licenses. Compare recovered MWh to software cost, not demo aesthetics.
Monthly performance review agenda (60 minutes)
- Block PR ranking vs clean baseline (15 min)
- Top inverter alarms by estimated MWh impact (10 min)
- Cleaning and robot log review: coverage gaps (10 min)
- Tracker fault closure rate (10 min)
- Next month surge plan if dust season (10 min)
- Assign owners and due dates (5 min)
Structured agendas prevent meetings that only stare at plant-average PR while the dustiest block hides inside the average.
Reference module installation standard
Minimum utility standard:
- One clean vs soiled pair per 15-20 MW block
- Same module SKU as field strings
- Same tilt and tracker program as adjacent rows
- Clean reference washed on documented schedule
- Data logged daily to spreadsheet or SCADA tag
Cost is small relative to one month of unexplained PR loss on a 50 MW asset.
Escalation path when thresholds breach
- Shift engineer acknowledges alarm within 2 hours
- Site supervisor validates with reference module or drone spot check within 24 hours
- Work order issued with block ID and estimated MWh at risk
- Contractor or robot dispatch with SLA deadline
- Post-job PR recovery logged within 7 days
- Asset management monthly rollup
Name a single escalation owner per shift. Anonymous alarms die in inboxes while blocks lose MWh.
Review escalation metrics monthly: median hours from threshold breach to field start, and PR recovery seven days after close.
Alert thresholds that actually dispatch field teams
Generic SCADA alarms flood control rooms. Useful monitoring ties economic thresholds to tickets: for example, open a soiling review when block PR drops 2 points below clean baseline for five consecutive clear-sky days, or when inverter specific yield diverges from neighbors after a dust event. Close tickets only when PR recovers or a non-soiling root cause is confirmed.
Automated cleaning systems should push pass completion into the same ticket stream. If robots ran but PR did not recover, the next escalation is tracker alignment or inverter fault, not another blind clean.
Key takeaways
- Monitoring and cleaning automation are complementary, not interchangeable.
- Thresholds must be economic, not cosmetic.
- Unify data so shift engineers see PR, soiling, and robot status together.
- Review block-level rupee impact weekly on large sites.
Start with one block where SCADA, reference modules, and cleaning tickets share the same block ID. Expand the integration only after alerts prove actionable.
Related resources
Frequently asked questions
Monitoring measures output, soiling, and faults. Cleaning automation executes washes or robot passes. The best results link monitoring thresholds to work orders, either robotic or manual.
Reference modules (clean vs soiled), soiling stations, IV curve tracers on sample strings, and irradiance-normalized PR from SCADA. Satellite soiling models are useful for forecasting but should be calibrated on-site.
Real-time alarms are continuous; shift engineers should review block PR daily. Weekly summaries should rank blocks by rupee loss. Monthly reviews should tie monitoring spend to recovered MWh.
Many utility cleaning robots log pass completion, row coverage, and sometimes visual or soiling proxies. That data should feed the same O&M dashboard as inverter SCADA.
Many Indian asset owners use 1.5-2.5% PR below rolling clean baseline, or 3-5% soiling on reference modules, whichever is reached first. Thresholds should be economic, not cosmetic.
Compare block PR trends across similar irradiance days. If one block drops while neighbors stay flat, suspect local soiling or shading. If all blocks drop uniformly with clean reference modules, check irradiance sensor quality or widespread weather effects.