Module efficiency is fixed at the factory. Plant managers raise output by attacking avoidable losses: dust, downtime, and shading. On Indian MW assets commissioned in Rajasthan, Gujarat, and Karnataka clusters, those three often beat speculative equipment swaps that look good on paper but ignore how the plant actually runs.
This article is for O&M leads and asset managers who need MWh this quarter, not datasheet watts next year. It ranks levers by speed, cost, and evidence, with INR examples at utility scale.
Quick answer
- Measure PR vs clean baseline before buying new hardware.
- Attack soiling, availability, trackers first on operating plants.
- Cleaning pays when ₹ recovered MWh exceeds clean cost.
- Use PR calculation discipline monthly, not annually.
- Module context: efficiency vs realized PR.
Loss stack you can actually fix
Utility plants lose energy across a stack. Some layers need capex; others need discipline. Rank by measured contribution before budgeting.
| Lever | Typical opportunity (Indian dusty sites) | Speed to impact |
|---|---|---|
| Soiling | 3–8% energy between infrequent cleans | Days to weeks after clean campaign |
| Inverter faults / clipping | 0.3–1.5% availability and yield | Hours to days per fault |
| Tracker downtime / misalignment | Row shadow and off-axis loss | Days when parts available |
| Vegetation / mud shading | Localized 5–15% on affected strings | Weeks if seasonal |
| Curtailment (grid) | Not a cleaning problem | Report separately from soiling |
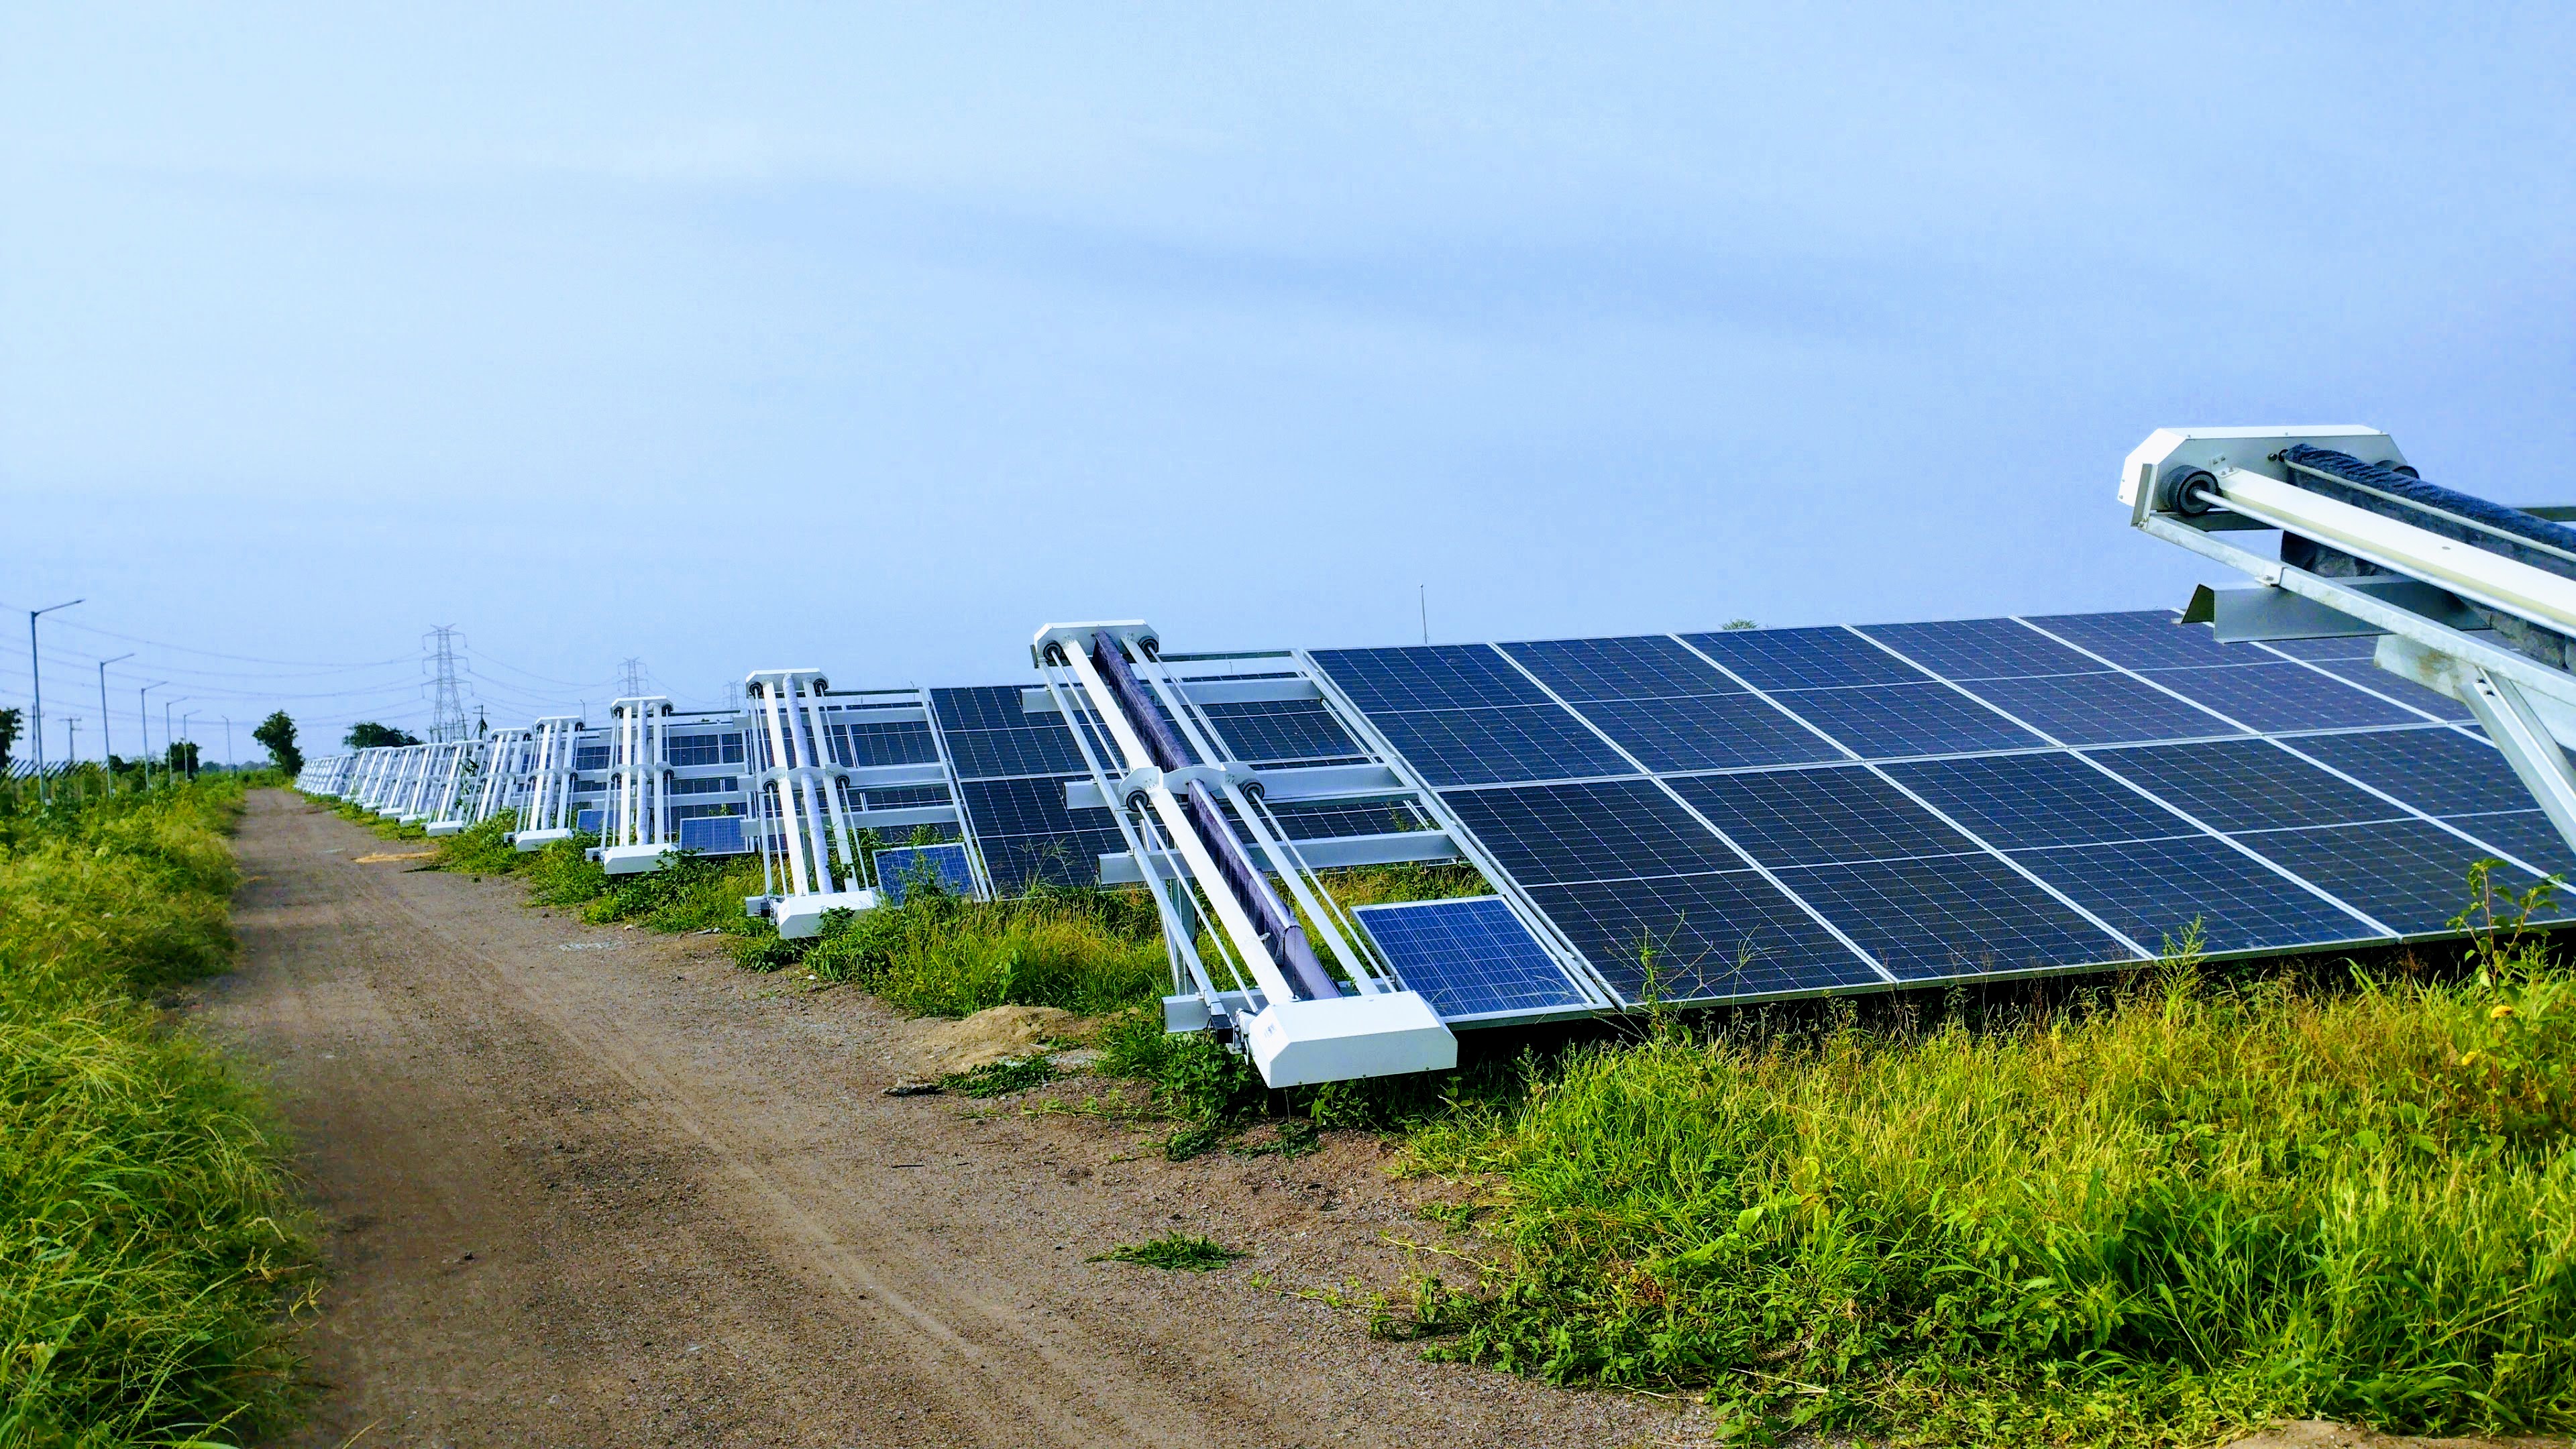
Soiling: the largest controllable drag in dry India
Dust reduces transmittance through the glass laminate stack. Loss is often uniform across strings, so it hides in "plant looks fine" until PR is normalized against irradiance. Reference modules or clean-day baselines make the gap visible.
Illustrative revenue impact on a 10 MW plant:
- Typical annual generation near 16 GWh.
- 4% average soiling drag across dry months ≈ 640 MWh/year.
- At ₹3.50/kWh ≈ ₹22.4 lakh annual opportunity on 10 MW alone.
At 50 MW, multiply by five. Cleaning and automation are revenue protection when PPAs are thin. Read how cleaning increases output and Rajasthan/Gujarat loss ranges.
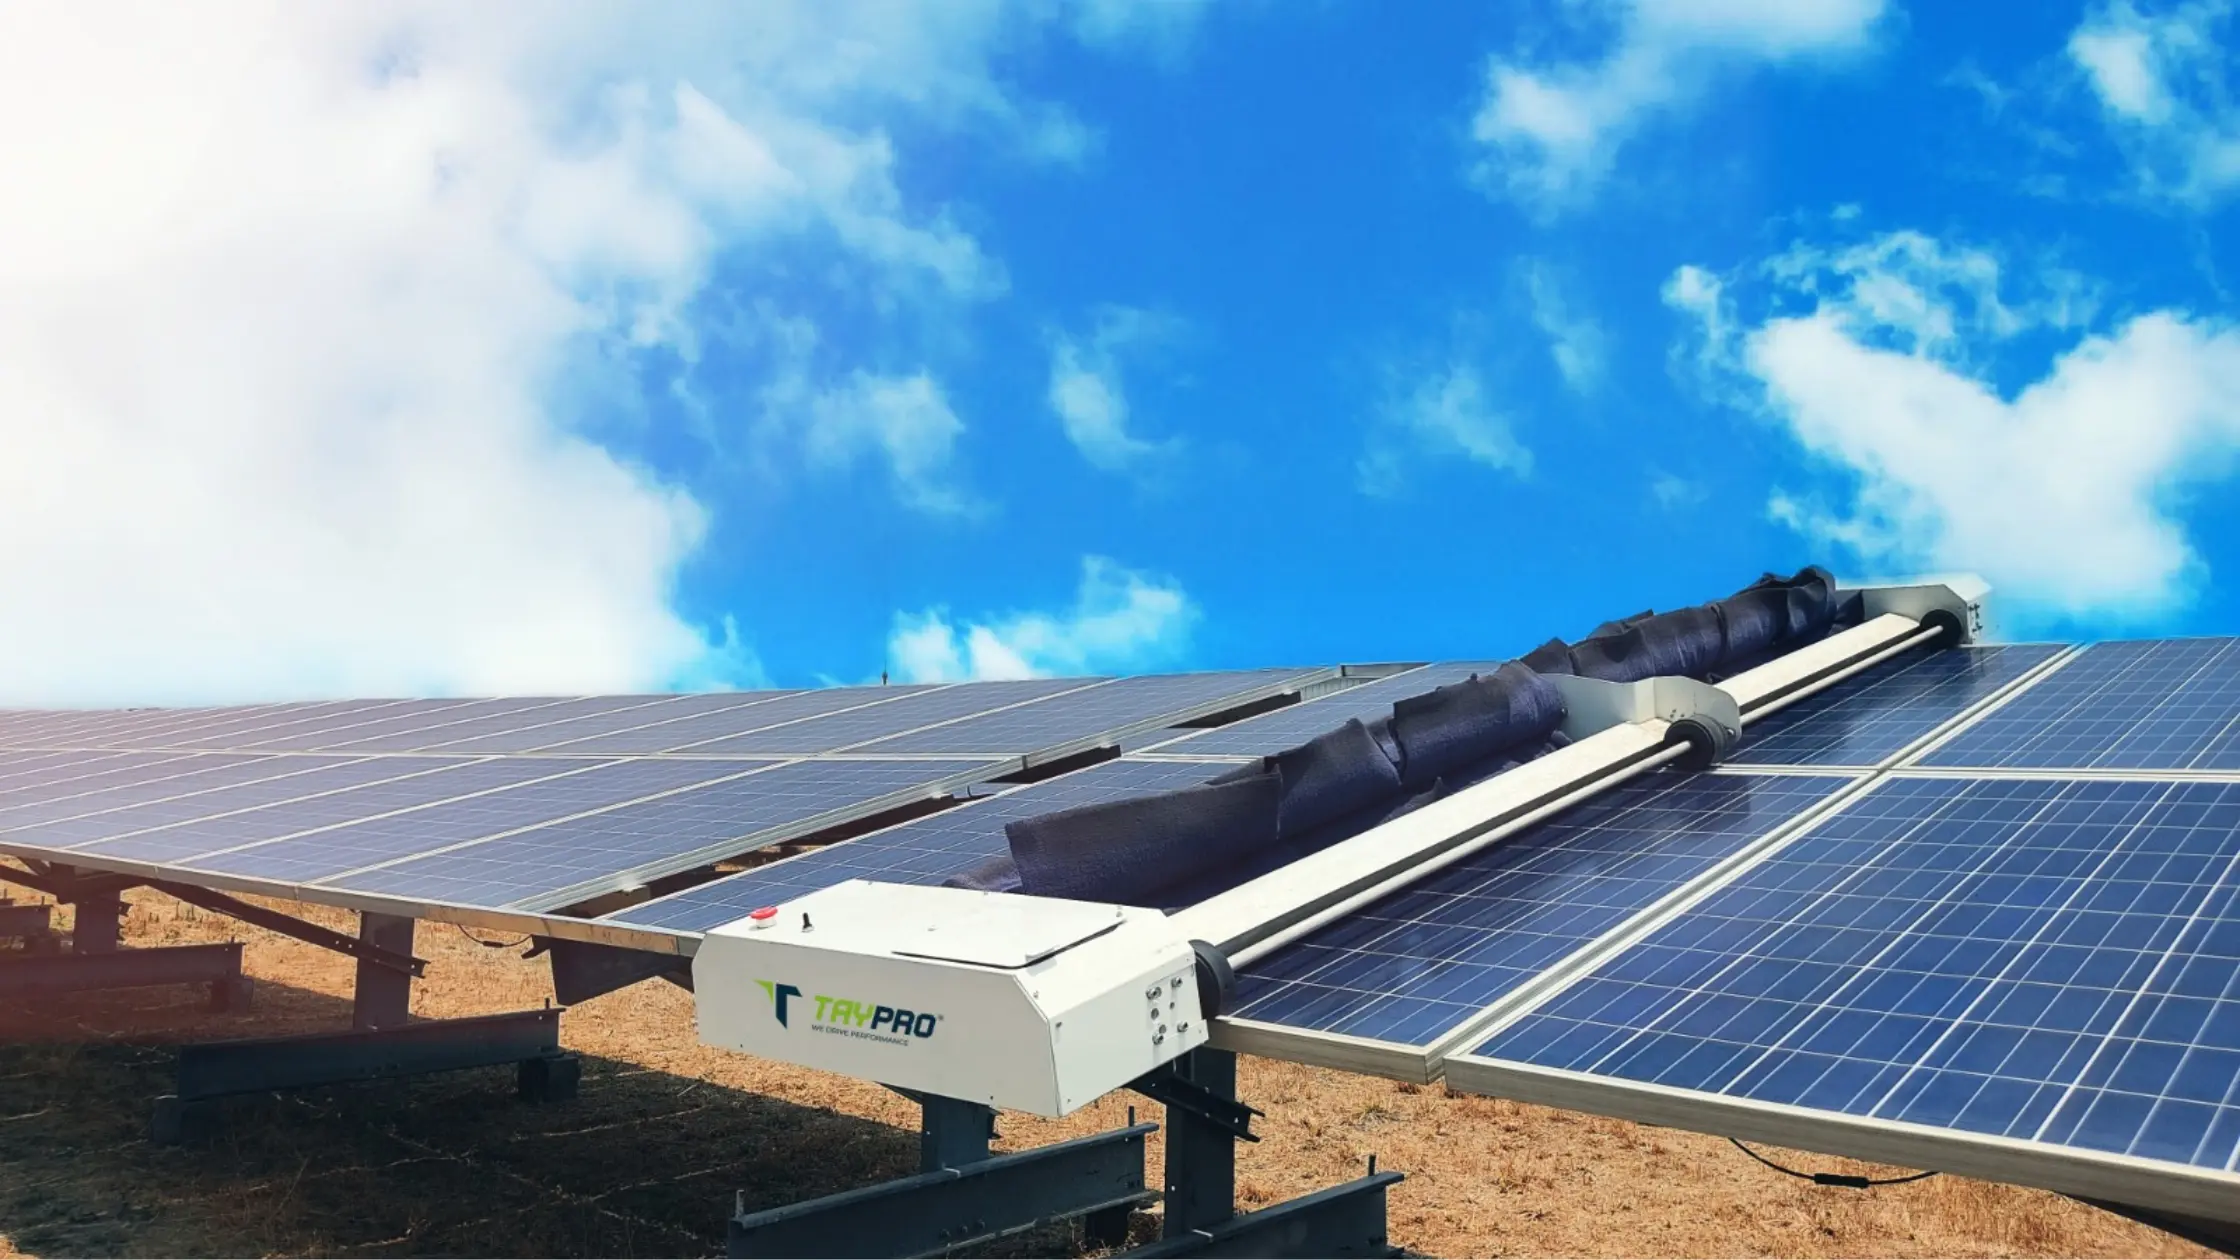
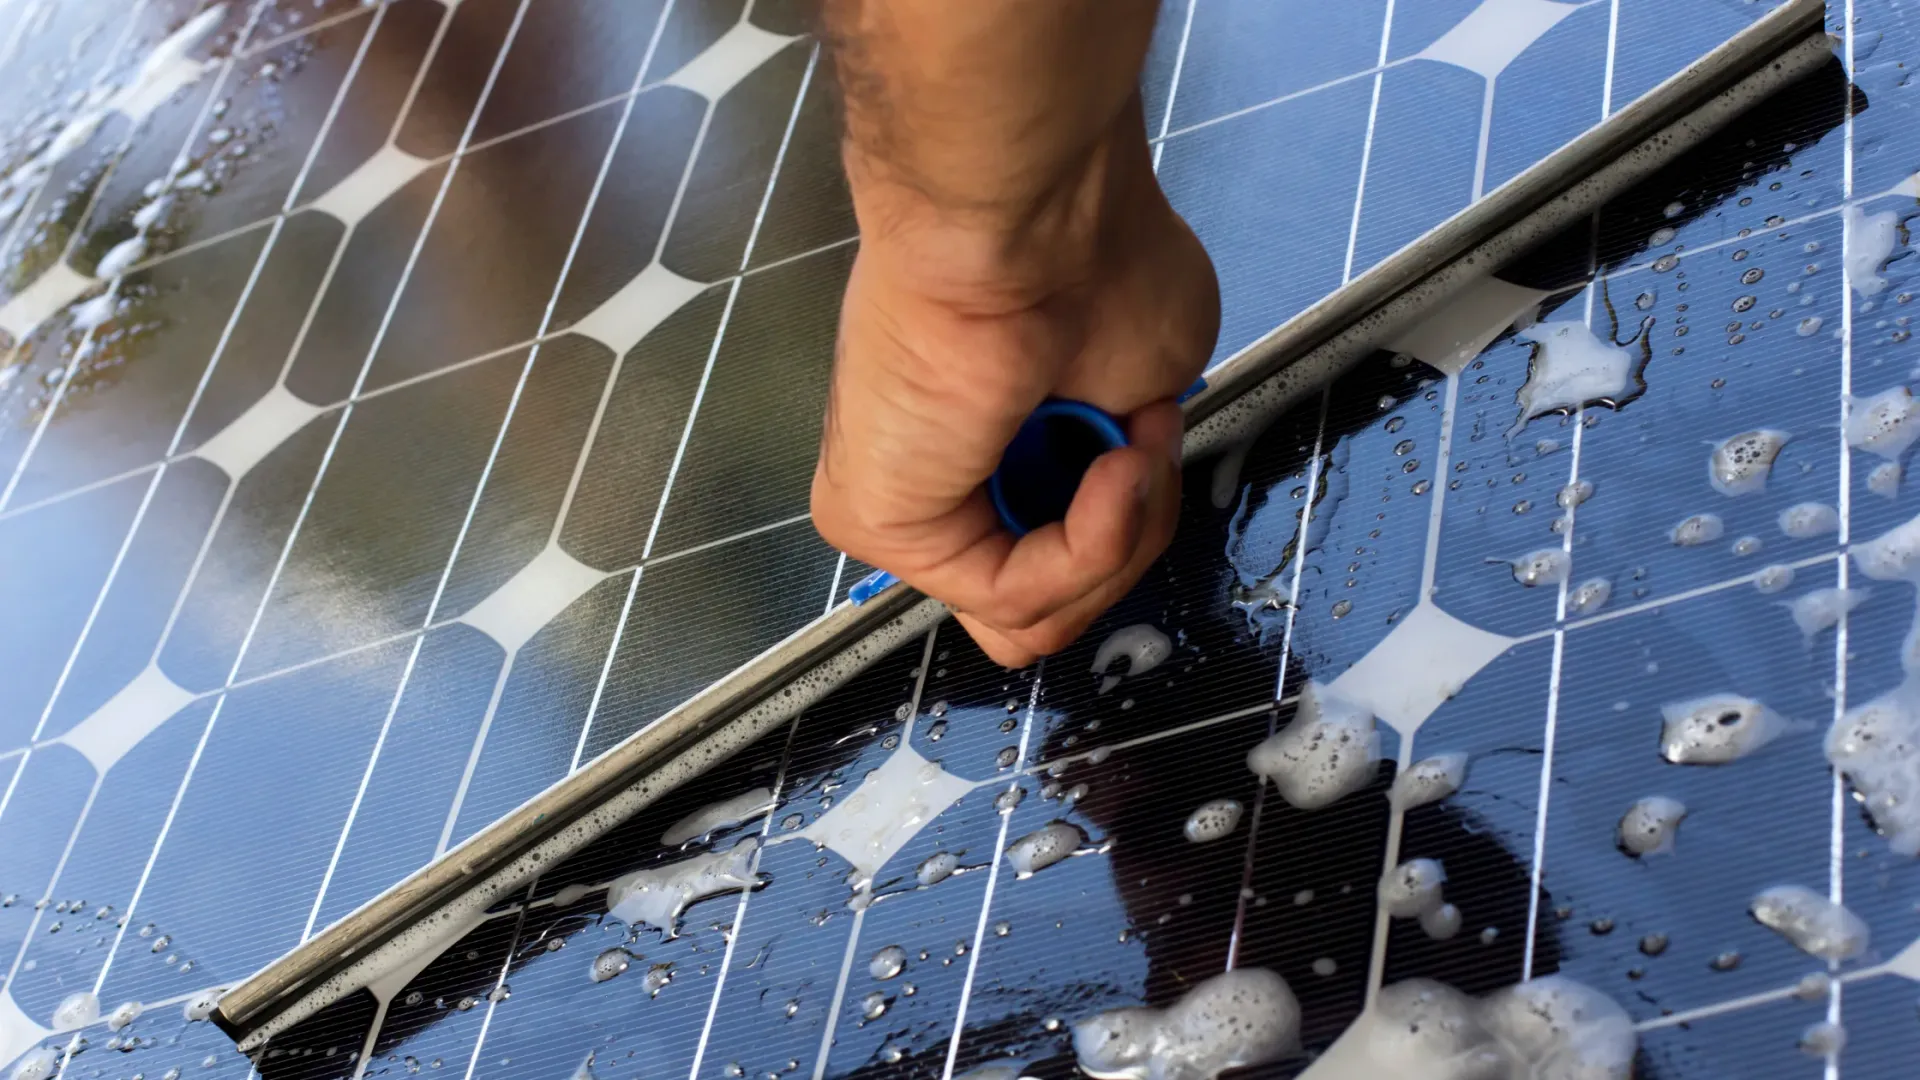
Cleaning as an output lever, not a chore
Compare methods on ₹ per recovered MWh, not invoice sticker price. Manual wet programs have low capex but recurring labour and water. Waterless robots carry capex but can increase pass frequency and log coverage.
| 10 MW illustrative (arid site) | Manual (stretched cycle) | Robot fleet (higher frequency) |
|---|---|---|
| Average soiling drag | 4–6% | 1.5–3% if uptime high |
| Annual O&M + amortized capex | ₹30–50 lakh | ₹45–70 lakh all-in |
| Recovered MWh value at ₹3.50/kWh | Baseline | Often positive if gap was material |
Worked example: 10 MW robotic vs manual costs. Use ROI calculator with your soiling curve.
Availability: inverters and trackers
Soiling fixes fail if inverters trip silently or trackers stow and never return. Monthly availability reviews should separate:
- Forced outage hours by inverter and block.
- Tracker fault codes and manual overrides left in safe mode.
- Communication drops mistaken for generation loss.
Tracker shadow on neighboring rows can look like soiling in aggregate PR. Tracker maintenance guide covers mechanical issues that cleaning cannot fix.
When not to chase marginal module gains
If reference modules show dust-driven loss, installing higher-efficiency modules without cleaning scale repeats the problem on more expensive glass. Module upgrades make sense when:
- Strings fall below inverter MPP windows due to degradation.
- Physical damage or hot spots are widespread.
- Repowering includes tracker load and cleaning path revalidation.
Technology context: module types and O&M implications and efficiency trends in 2025.
90-day output recovery playbook
- Establish clean PR baseline with reference modules or post-clean window.
- Separate curtailment, inverter, tracker, and soiling in monthly reports.
- Quantify ₹ value of soiling gap at PPA tariff.
- Pilot cleaning method change on worst two blocks; measure PR 14 days.
- Scale method or robots if ₹ per recovered MWh clears hurdle.
- Re-benchmark after first full dry season.
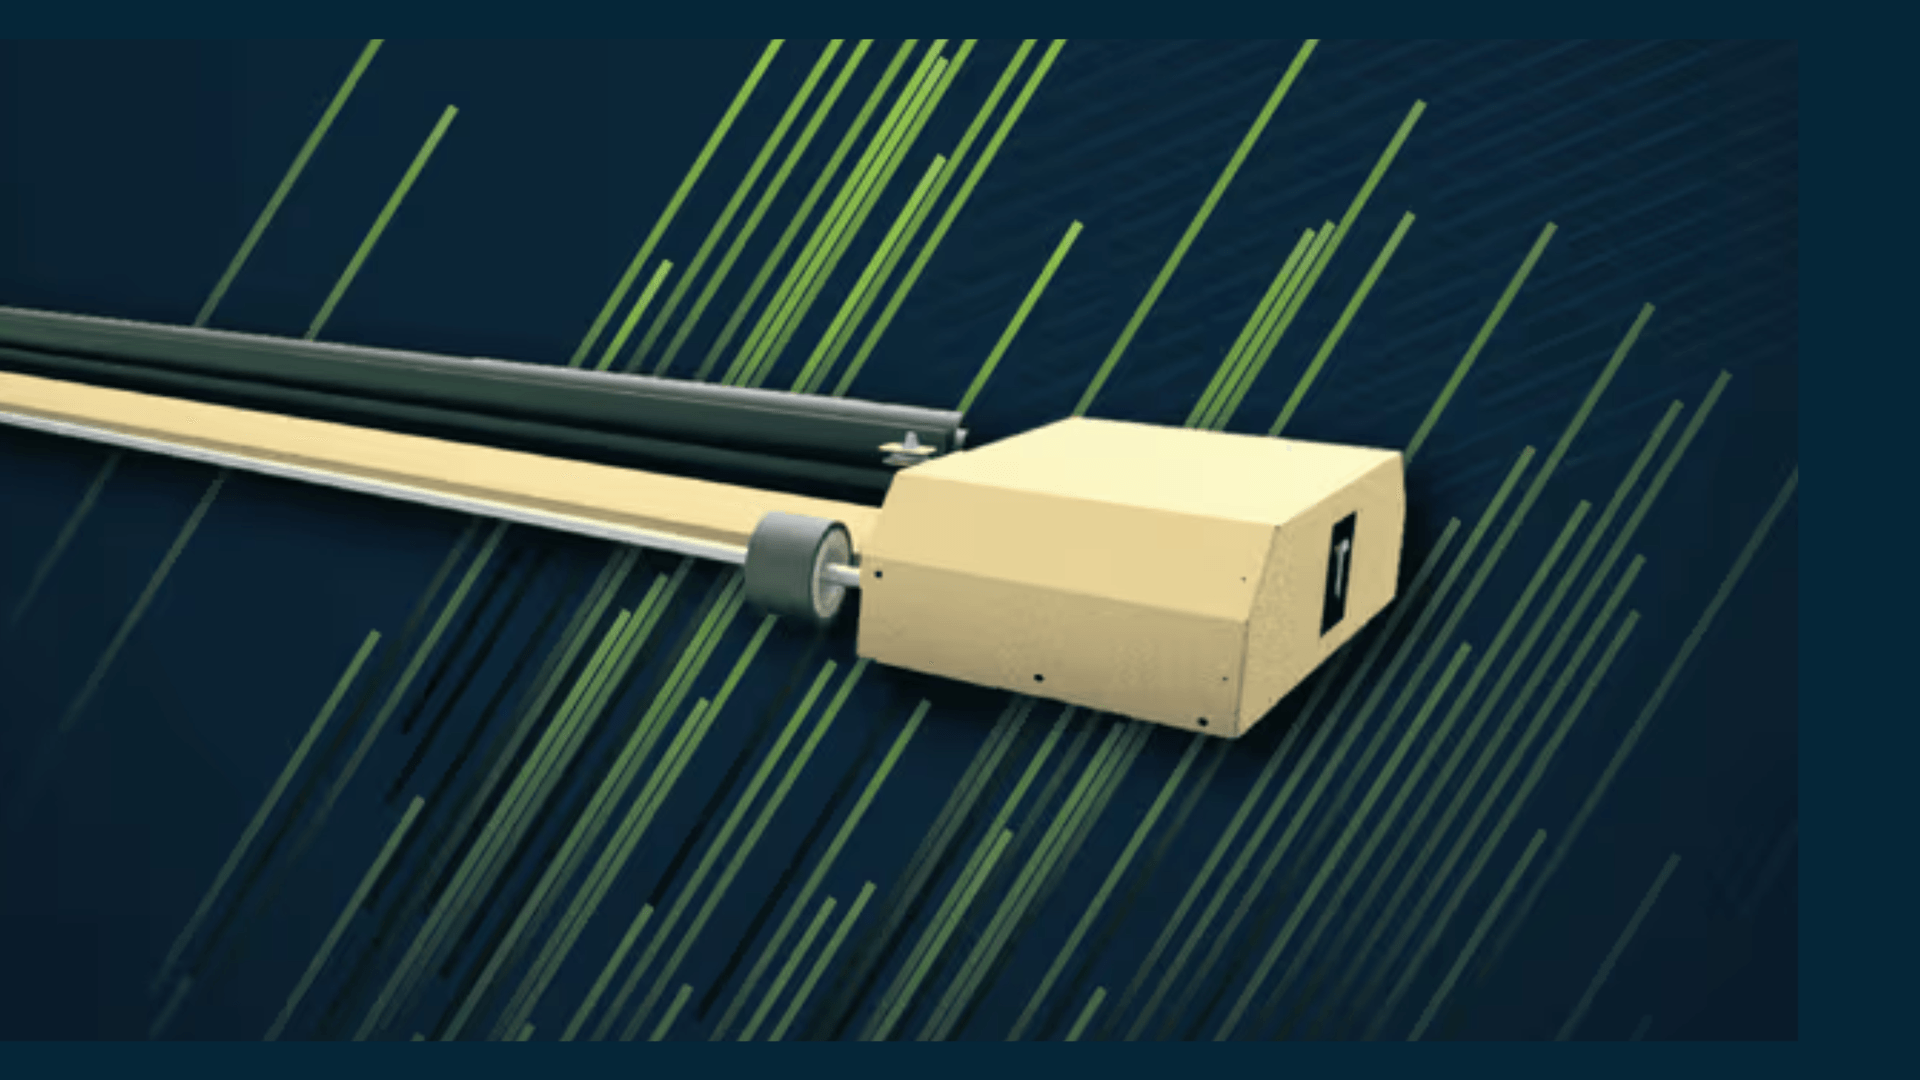
Automation when labour or water caps throughput
Manual crews that cannot complete full-plant passes before the next dust event leave average PR depressed. Signs include PR sawtooth patterns and storm response beyond 72 hours. See five signs you need automated cleaning and robotic vs manual comparison.
Vegetation, mud, and non-soiling losses
Not every PR drop is dust. Monsoon vegetation under fixed-tilt tables casts moving shadows. Poor drainage splashes mud on lower modules for weeks. Inverter clipping on clear days masquerades as soiling in naive dashboards. Before increasing clean frequency, walk the worst block with O&M and check string-level behavior, drainage paths, and vegetation height against contract scope.
Fixing drainage once can outperform twelve extra wet passes. Solar panel maintenance checklist 2025 covers vegetation and structural items alongside glass cleaning.
Portfolio view: ranking plants by recoverable MWh
Owners with multiple sites should rank by ₹ recoverable from soiling before allocating robot capex. A 30 MW plant with 5% measured soiling gap may beat a 100 MW plant with 1.5% gap for the next cleaning investment rupee. Central analytics teams normalize PR across pyranometer quality and curtailment flags, then publish a quarterly soiling leaderboard for O&M focus.
Monitoring beyond cleaning supports portfolio normalization when fleets span Rajasthan, Karnataka, and coastal Gujarat with different dust profiles.
Inverter clipping and repower timing
High-efficiency modules on older inverters sometimes clip midday power on clear days. Clipping looks like flat PR ceilings in summer, not soiling. Before blaming dust, compare AC output to inverter nameplate and check if MPP voltage sits at upper limit. Repowering modules without inverter upgrade can increase clipping while soiling remains.
Conversely, fixing soiling on clipping-limited plants still helps morning and afternoon shoulders when inverters are not saturated. Hourly PR curves help separate the effects. Output improvement strategies should use hourly data on sample days, not monthly averages alone.
Quarterly output review agenda
Plant managers should run a fixed quarterly workshop with O&M, asset management, and SCADA support:
- Rank top three loss categories by MWh and ₹ for the quarter.
- Review worst five blocks by PR vs baseline; assign root cause owner.
- Approve next quarter cleaning method and budget adjustment if needed.
- Close open inverter and tracker faults older than 30 days.
- Update lender pack narrative with actions taken, not only variances.
Discipline beats ad hoc heroics each May. Robotic cleaning ROI framing fits naturally into Q4 budgeting when dry season data is fresh.
Documenting wins for asset management
When a cleaning campaign or robot pilot recovers measurable PR, publish a one-page case note: baseline dates, method, cost, MWh recovered, and ₹ at tariff. These notes build internal capital approval muscle for fleet expansion and satisfy lender questions on operational maturity.
Key takeaways
- Operational MWh beat datasheet watts on operating assets.
- Quantify soiling before capex projects on modules.
- Cleaning and robots are revenue tools when loss is measured.
- Fix availability and trackers in parallel with soiling campaigns.
- Report curtailment separately so teams chase the right lever.
Rank output levers by payback period in months, not headline wattage. On operating Indian utility plants, recoverable losses usually beat module swaps.
Related resources
Frequently asked questions
Often fixing sustained soiling loss (3–8% in dry regions) and inverter or tracker availability before considering module upgrades. On a 50 MW plant, recovering 3% annual energy is roughly 1.35 GWh, worth ₹4.7 crore at ₹3.50/kWh.
Cleaning restores irradiance reaching cells; it does not change cell physics. The effect is higher realized output and PR, which looks like better efficiency on the meter. Uniform dust across strings is one of the largest avoidable losses on Indian MW assets.
Industry-typical gains of 2–5% annual energy on dusty sites when robots replace infrequent manual cleaning, site-specific validation required. Gains are zero if manual programs already keep PR within 1% of baseline.
When degradation beyond warranty curves, widespread damage, or string voltage mismatch dominate loss, not when uniform dust is the main PR drag. Repowering without fixing cleaning scale repeats the problem on more expensive glass.
PR versus clean baseline, inverter availability, tracker stow faults, reference module soiling, and curtailed MWh reported separately from soiling. Without separation, teams chase the wrong lever.