Western and northern India see dust events that can erase a fortnight of careful O&M in one afternoon. Forecasting is not about marketing smart systems. It is about knowing when to pause cleans, when to pre-stage water or robots, and when to hit the plant before a second storm layers grit on top of the first.
This article explains what is actually predictable, how Indian utility sites wire forecasts into cleaning SLAs, and where simple rules outperform black-box models that never open a work order.
Quick answer
- Use IMD and high-res wind/dust alerts for 24-72 h planning in Rajasthan, Gujarat, Punjab, Haryana.
- Expect 5-15% PR hits on severe exposed events until washed (industry-typical).
- Pair forecasts with reference module readings to avoid cleaning too early or too late.
- Post-storm cleans within 48-96 h often beat waiting for calendar slots.
- Document storms for warranty, insurance, and lender reliability reports.
What actually gets predicted
Dust storm prediction in operations usually means combining several signal types:
- Synoptic wind spikes ahead of pre-monsoon and monsoon breaks
- Regional dust plumes visible in satellite aerosol and dust products
- Local anemometer trends on site perimeters and met masts
- Soiling rise rate after light events vs heavy events on reference strings
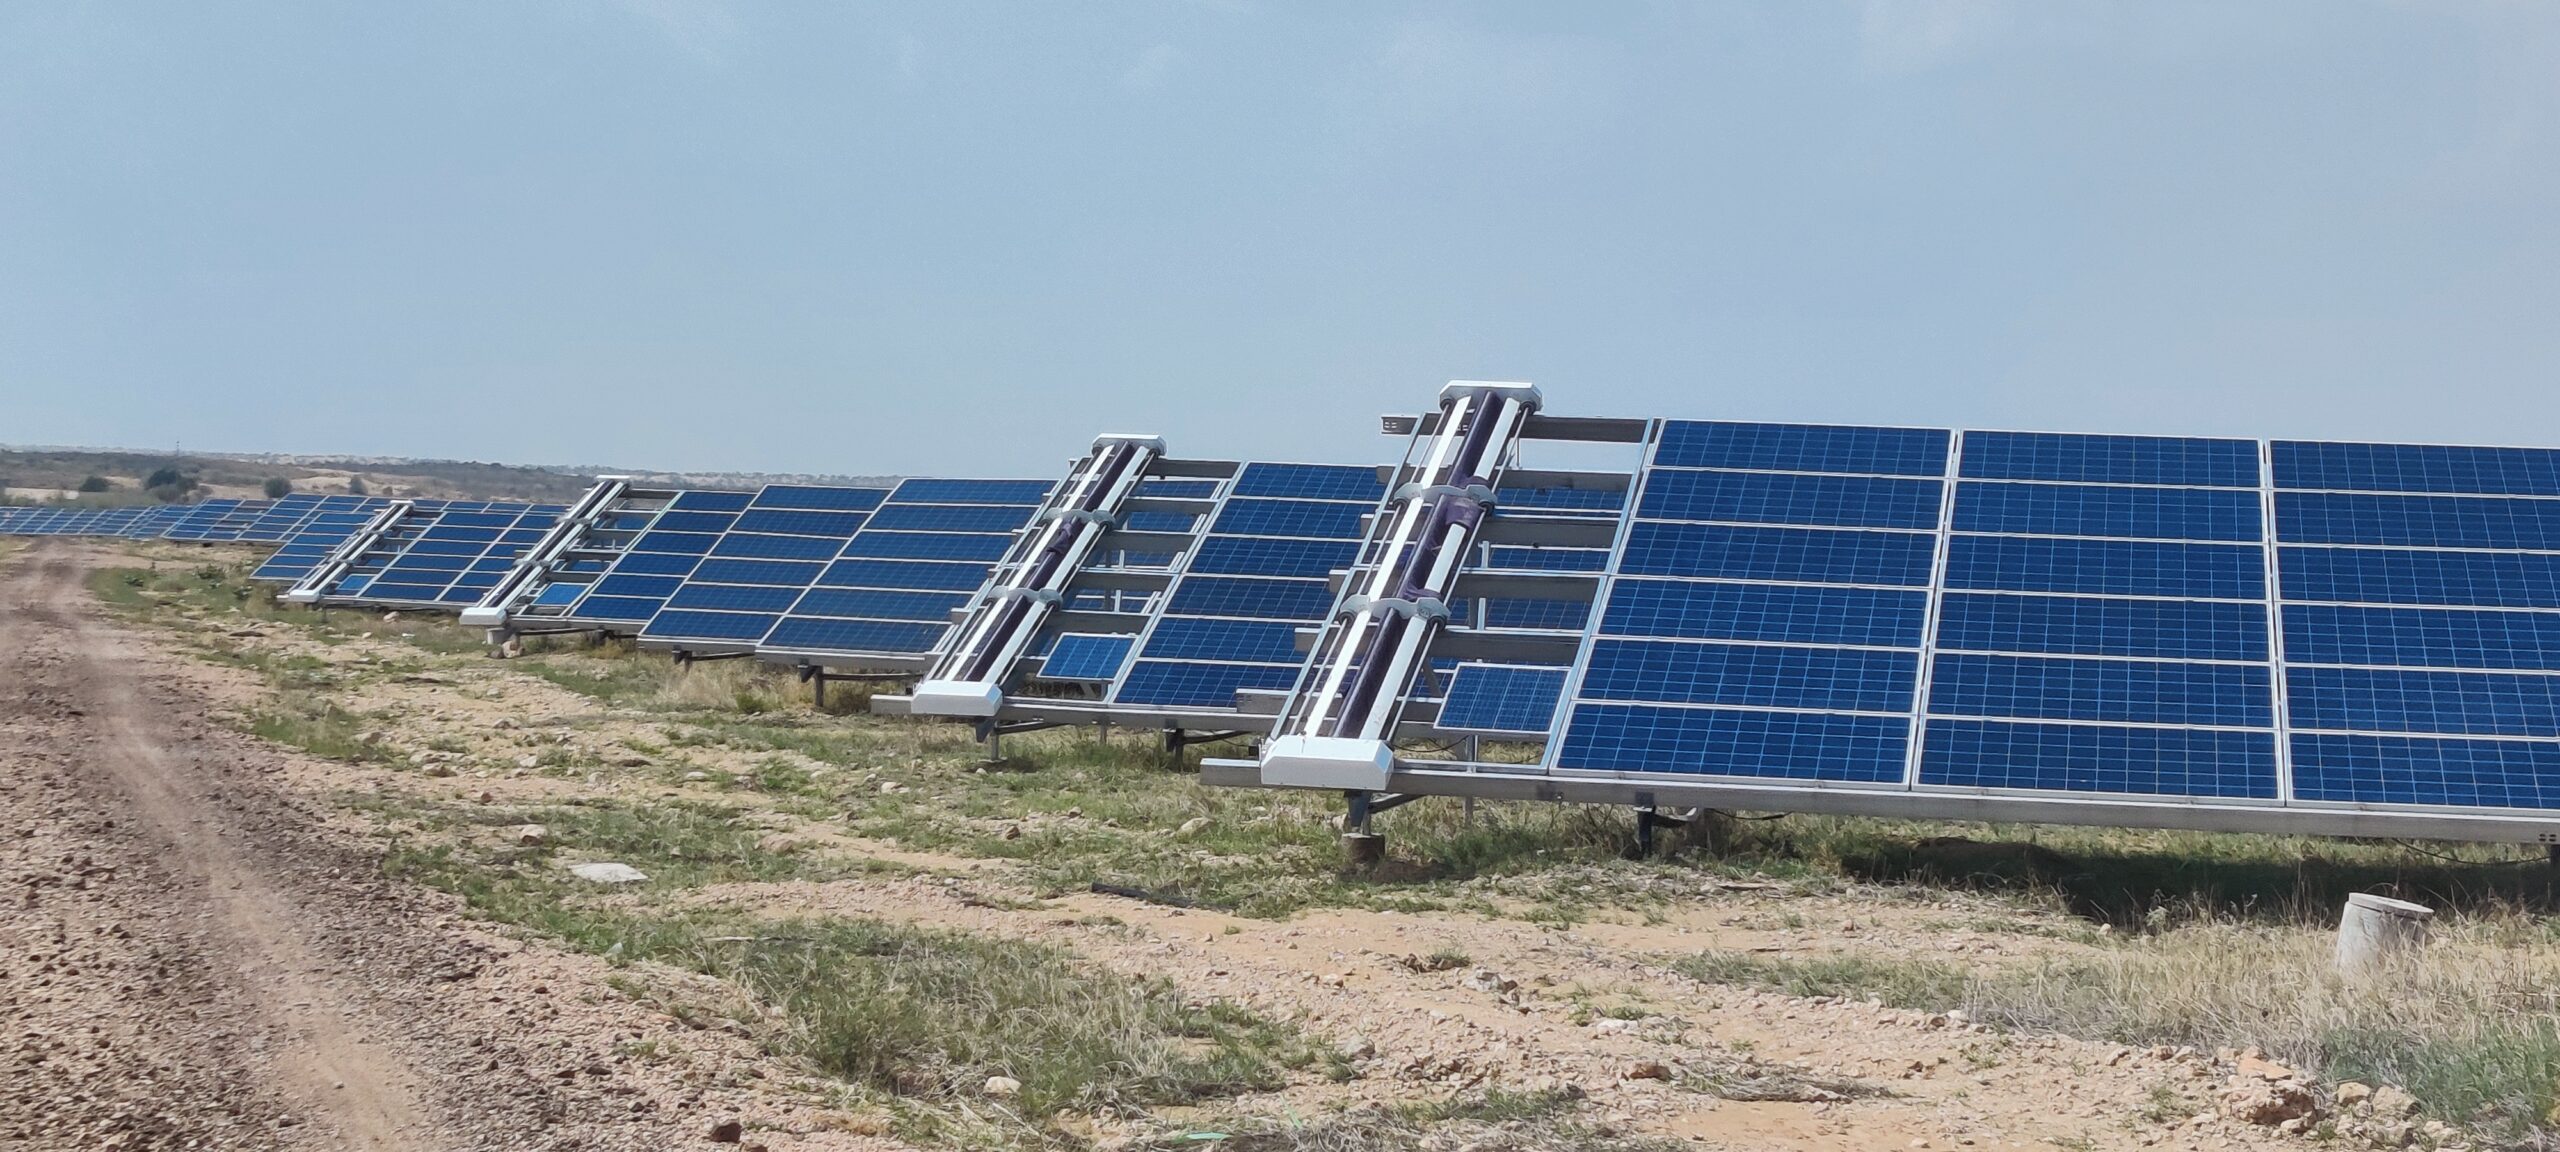
- Row orientation effects on single-axis trackers where edge rows soil first
Machine learning helps rank which blocks soil fastest given wind direction and row orientation, especially on single-axis trackers. The model is only useful if it triggers a ticket.
Science in plain language: why western India spikes in May
Pre-monsoon months combine high surface heating, dry soils, and strong pressure gradients. Loose desert and agricultural topsoil lifts into aerosol layers that deposit on module glass. The film is not uniform: leeward row ends, tracker edges facing prevailing wind, and blocks near unpaved roads often show 2x the loss of interior rows.
Forecast products estimate wind speed, direction, and aerosol load. They do not tell you exact soiling percent on Block 7. That requires on-site reference modules calibrated to your geography. Coastal sites add salt adhesion; Indo-Gangetic sites add harvest particulates with different adhesion curves.
Operations playbook before and after storms
| Phase | Actions | Owner |
|---|---|---|
| 48 h before (forecast) | Secure loose materials, pause risky manual work on roofs, charge robot batteries, fill water tanks if wet clean planned post-event | Site manager |
| During | Protect crews; log inverter availability and tracker stow; no unnecessary field movement | Control room |
| 0-24 h after | Sample soiling on reference modules; drone spot check for uneven deposition | O&M lead |
| 24-96 h after | Prioritize blocks with >5% loss; deploy waterless methods if water logistics strained | Contractor / robot ops |
| 7 d after | Reconcile PR recovery vs plan; update storm log for asset management | Asset management |
Worked example: storm week on a 40 MW Rajasthan block
Assume a severe event on Tuesday with 10% PR drop measured on reference modules by Thursday.
- Normal daily generation at clean PR: ~220 MWh
- Loss at 10% for 5 days before first pass: ~110 MWh foregone
- At ₹3.50/kWh: ~₹38.5 lakh opportunity cost
- Emergency robot surge or contractor mobilization: ~₹5-8 lakh
- Net benefit of fast response: strongly positive if loss estimate holds
Without a forecast-triggered SLA, the same plant might wait for the next calendar clean twelve days out, doubling effective loss. That is the operational case for forecast integration, not model accuracy bragging rights.
Why calendar cleaning fails in storm seasons
A plant cleaned on Monday can look worse by Thursday while the ticket still says done. Forecast-driven schedules accept that O&M intensity spikes in May and June in many states. Budget for surge labour or robot hours, not flat monthly spreads.
Advertisement
Compare seasonal patterns in soiling variation across India, Rajasthan/Gujarat loss ranges, and seasonal O&M guide.
Sensors and models that work on MW sites
| Tool | Role | Limitation |
|---|---|---|
| Dual reference modules | Ground-truth soiling % | Needs periodic clean of reference cell |
| Soiling stations | Daily transmission trend | Calibration drift if ignored |
| Block-level PR | Economic loss ranking | Requires quality irradiance data |
| IMD / high-res wind alerts | Surge staging trigger | Not block-specific deposition |
| Simple rules engine | Opens work orders | Must be maintained seasonally |
Fancy AI without work-order integration is a screensaver. Tie alerts to O&M contracts with defined response times. Example rule: if forecast wind exceeds threshold X and reference loss exceeds Y%, open high-priority clean within 48 hours.
Is robotic cleaning better after dust storms?
Robots help when labour pools are thin and water is rationed. Compare methods on turnaround time and cost per MW. Heavy mud packs may need pre-rinse or brush assist depending on technology. Check OEM guidance before abrasive cycles on modules with soft coatings.
Regional context: cleaning robots in Rajasthan and traditional vs waterless comparison.
Building a minimal forecast program without enterprise AI
- Subscribe to IMD district alerts and one high-resolution wind product for your state.
- Install at least one reference module pair per major block.
- Define surge SLA in the O&M contract with rupee consequences.
- Log every storm: date, max loss %, hours to first pass, MWh recovered.
- Review quarterly: tune thresholds so you neither over-clean mild weeks nor miss May spikes.
Advanced analytics can layer on later. Discipline and tickets come first.
Calibration: matching forecasts to your blocks
Satellite dust products show regional plumes. Your plant sees row-level deposition. Calibration workflow:
- Log forecast wind speed and direction for each alert.
- Measure soiling rise on reference modules 24 h after event.
- Tag blocks by orientation and distance from unpaved roads.
- Build simple multipliers: leeward edges vs field center.
- Update thresholds each season; pre-monsoon differs from post-monsoon.
After two seasons, most sites need only rules and reference data, not exotic models. The win is ticket speed, not R-squared bragging.
Insurance and warranty documentation after storms
Major dust events can support warranty claims for abrasion or connector ingress if logged properly. Record timestamp, max anemometer reading, estimated soiling %, photos, and hours to first cleaning pass. Asset management teams that treat storms as operational incidents with paper trails recover faster in disputes than sites that only note PR dipped in SCADA.
Integration with robotic fleet dispatch
Forecast-to-robot workflow on utility sites:
- IMD alert received 48 h ahead
- Control room flags blocks by orientation risk
- Robots charged; night pass scheduled post-storm
- Pass log uploaded to O&M dashboard
- Reference module confirms recovery within 72 h
Without step five, you only know the robot moved, not whether MWh returned. Pair fleet telemetry with PR recovery always.
Dust season staffing model (illustrative 50 MW)
| Month | Manual FTE equivalent | Robot night shifts |
|---|---|---|
| Jan-Feb | 4-6 | 2-3 per week |
| Mar-Jun | 12-18 surge | 5-7 per week |
| Jul-Sep | 6-8 event-driven | 2-4 per week |
| Oct-Dec | 6-10 haze response | 3-5 per week |
Archive every storm in a shared log linked from the monthly PR pack. Patterns emerge after two seasons that no single model sells upfront.
Link storm log entries to robot dispatch tickets so auditors see forecast, action, and recovery in one chain.
Key takeaways
- Treat dust forecasts as O&M inputs, not news alerts.
- Measure loss on modules, not assumptions from neighbor sites.
- Surge capacity in storm months saves more MWh than average-month over-cleaning.
- Log events for reliability reports to lenders and off-takers.
Validate dust forecasts against your on-site reference modules each season. Regional models improve when local soiling data feeds back into scheduling rules.
Related reading
Frequently asked questions
Regional weather models often give 24-72 hour visibility on high-wind dust events in western India. Combined with on-site soiling sensors, plants can pre-position crews or robots and plan post-storm recovery cleans before PR loss compounds.
Industry-typical immediate losses of 5-15% PR for heavy events are reported on exposed Rajasthan and Gujarat sites, with partial recovery after light rain and full recovery only after planned cleaning.
Weather alerts are the input. Value comes from rules that tie alerts to cleaning SLAs, water storage, and robot dispatch. Simple if-then workflows beat complex models without O&M integration.
Reference modules, soiling stations, anemometers, and post-clean PR baselines. Calibrate satellite dust products to your blocks. Coastal salt and agricultural dust behave differently.
Many operators target first pass within 48-96 hours on high-loss blocks when labour or robots are available. Delay beyond one week often allows cemented films that need more water and brush cycles.
Yes. When no storm is forecast and reference modules show loss below economic threshold, skip scheduled passes. That saves water and robot hours for surge weeks when forecasts and sensors align on high loss.