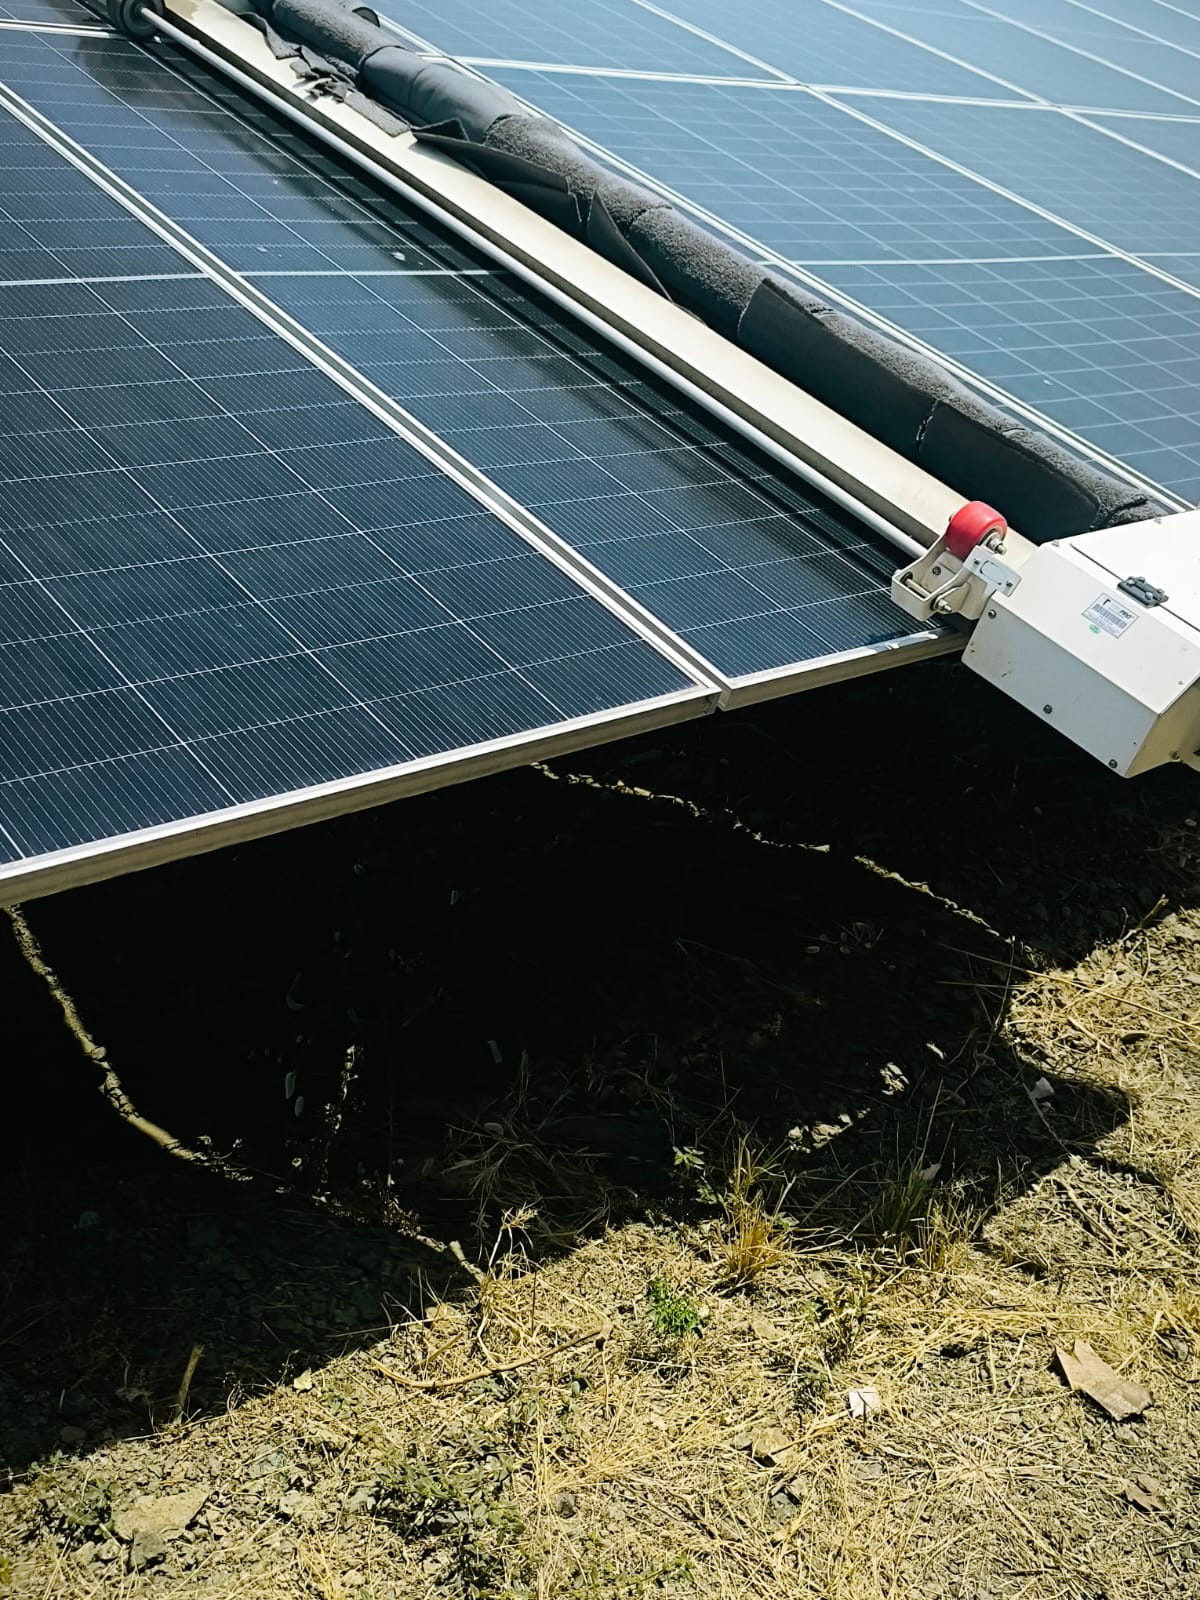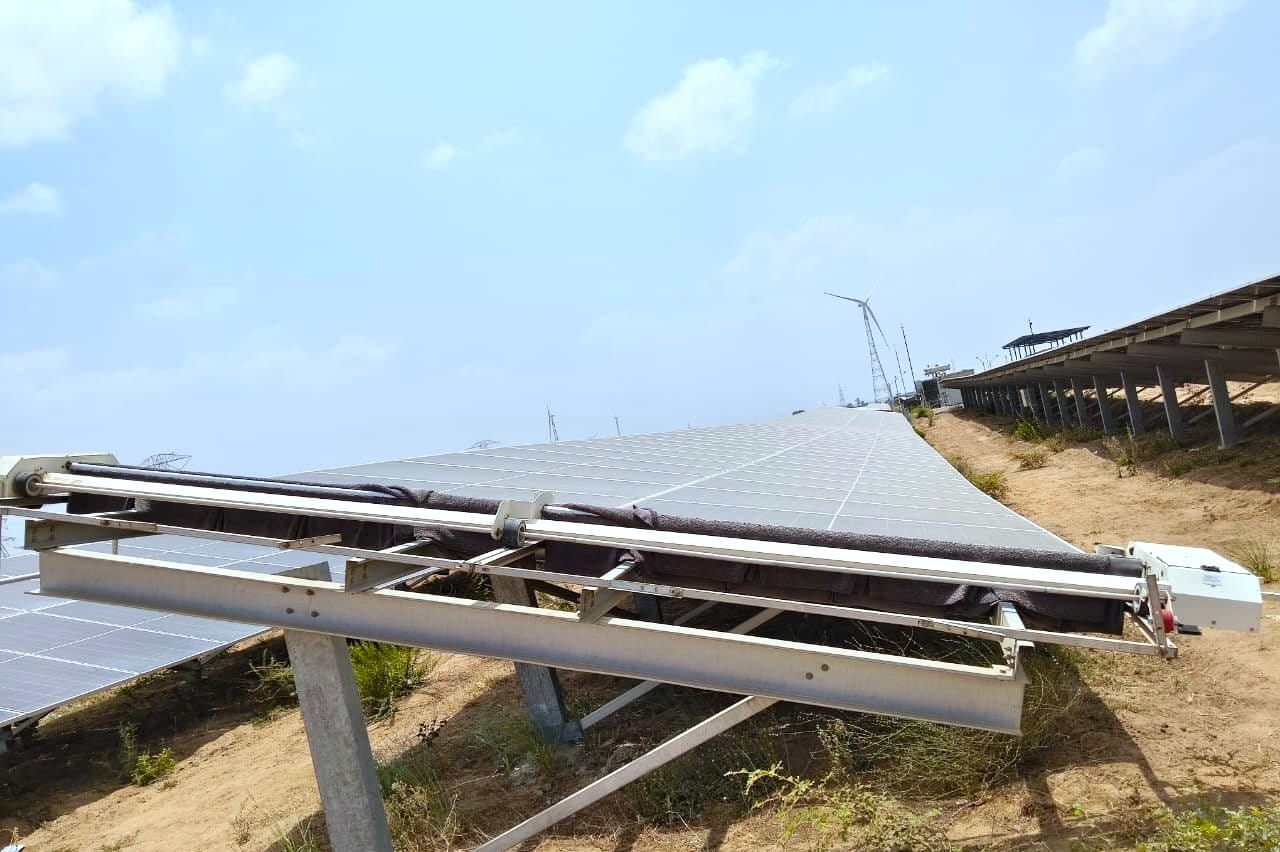
On Indian utility arrays, the limit on nightly cleaning is rarely brush RPM. It is energy: how many module square meters each battery cycle covers before the robot idles mid-block or returns for charge. Unoptimized robots retrace rows, miss gaps, and exhaust packs on dead travel. O&M teams arrive at dawn with frustrated coverage maps and PR dips that show up three days later.
Battery optimization combines persistent site mapping, charge-aware routing, and swap or dock scheduling so each cycle cleans roughly twice the panel area of blind traversal on the same hardware class. This article explains mechanics, swap operations, and acceptance metrics for 25 to 200 MW tracker and fixed-tilt plants.
Quick answer
- Map once, route nightly from stored row geometry, not rediscovery.
- Prioritize high-soiling blocks when charge headroom is tight.
- Battery swap rotation extends active hours on large sites.
- Target ~2x area per charge vs unoptimized paths; validate on your layout.
- Monitor transit-to-cleaning ratio weekly in fleet logs.
Why energy dominates brush speed on utility nights
A 50 MW tracker plant may present 80 to 120 km of effective row travel per full coverage campaign. Lighter robot platforms in the 26 to 38 kg class reduce structural load but still face finite pack capacity. If routing sends a unit back and forth across inter-row roads, cleaning hours burn on transit. Asset owners pay for robots to contact glass, not commute.
Optimization shifts spend from wandering to brushing. Field teams report fewer incomplete blocks and fewer emergency daytime manual touch-ups when routing respects block boundaries and terrain learned on first deployment.
Step 1: ML array mapping persists site geometry
On commissioning, models record row lengths, gaps, tilt variation, and tracker undulation profiles. That site model persists; it is not rebuilt from scratch each shift. Route planning uses the map to sequence passes, align with block IDs, and minimize return legs.
Indian tracker sites with uneven grading or end-of-row turnaround constraints benefit most. Re-map after major layout changes or repowering; module height shifts of 20 to 30 mm can affect end-turn clearance and effective row order.
Step 2: Battery-aware routing under real constraints
| Condition | Unoptimized behavior | Optimized behavior |
|---|---|---|
| Full charge, clear night | Sequential rows regardless of soil | Longest efficient path through assigned zone |
| Partial charge after cloudy day | Attempt full zone, abort mid-row | Rank blocks; clean top soiling score first |
| Wind pause near limit | Resume blind same path | Skip exposed rows; finish sheltered blocks |
| Swap delay | Robot idle at row mid | Hold at charge point; re-dispatch fresh pack |
Battery swap operations on 100 MW class sites
Fixed dock charging limits cycles when charge time exceeds row time. Swap programs keep two to four charged packs per active robot in night shift. Operator workflow:
- Robot returns at low state of charge to designated swap point.
- Hot-swap pack per OEM procedure; depleted pack to charger bank.
- Robot re-enters next assigned row within target turnaround (often under 8 to 12 minutes).
- Charger bank cycles depleted packs for next rotation.
Understaffed swap teams are a common failure mode: robots sit charged in principle but idle waiting for human steps. Budget realistic night headcount in O&M models alongside capex.
Swap vs dock: when each fits
| Factor | Dock charging | Battery swap |
|---|---|---|
| Plant size | 10 to 30 MW, shorter rows | 50 MW+, long tracker rows |
| Night hours needed | Single pass zones | Multi-zone or storm surge |
| Labour | Lower | Dedicated swap operator per zone |
| Capex | Charger infra at hub | Spare packs + charger bank |
| Coverage ceiling | Pack cycles per night | Often 1.5 to 2x effective hours |
Why lighter platforms pair with smarter routing
Lower mass reduces frame stress over 25-year life but does not alone double coverage. Combined with routing that minimizes acceleration and dead legs, lighter units maintain higher effective meters cleaned per Wh. Structural load and battery optimization are linked narrative for technical advisors reviewing robot approvals.
Read how cleaning robots work for subsystem context and measured utility benefits.
NECTYR and operator visibility
Fleet dashboards should show state of charge per robot, blocks completed vs deferred, and swap events timestamped. Without visibility, optimization algorithms look like black boxes when morning PR misses targets. Export logs for monthly AMC review alongside comms architecture on large sites.
Acceptance tests before sign-off
- Longest row: complete both directions on one charge with optimized map vs baseline path A/B test.
- Partial charge scenario: verify highest-soiling block cleaned first.
- Swap turnaround: median time under contract threshold across ten events.
- Area metric: hectares or modules touched per cycle logged automatically.
- Seven-day PR check on reference blocks after optimized week.
Common mistakes that erase 2x gains
Skipping re-map after tracker retrofit. Running swap without spare pack inventory in May dust weeks. Ignoring obstacle aborts that corrupt map segments. Setting same row order as manual crew paths instead of algorithm output. Charging packs on unstable generator supply that slows rotation.
Does battery optimization replace more robots?
Often it reduces robot count for target coverage frequency, but not always. Storm surge weeks may still need extra units regardless of routing. Use vendor simulation on as-built layout with your required pass interval (e.g., full plant every 5 to 7 effective days in arid season). Compare TCO in robotic cleaning ROI analysis.
Illustrative night shift energy budget (100 MW tracker)
| Metric | Unoptimized fleet | Optimized + swap |
|---|---|---|
| Modules touched per robot per night | 1,200 to 1,600 | 2,400 to 3,200 |
| Transit share of cycle time | 35 to 45% | 15 to 22% |
| Robots needed for 7-day effective coverage | 10 to 14 | 6 to 9 |
| Spare packs recommended | N/A dock-only | 2 per 3 active robots |
Validate on vendor simulation with your row lengths and stow windows.
Seasonal battery policy on Indian sites
Pre-monsoon dust weeks justify aggressive swap staffing and tighter state-of-charge floors so robots finish assigned zones before dawn humidity rises. Monsoon shoulder may reduce available dry nights; charge-aware routing prioritizes blocks with highest economic soiling scores when pack headroom drops after cloudy generator weeks. Winter dew nights in Rajasthan may shorten effective cleaning hours; schedule swaps later after dew risk passes where element moisture sensors allow.
Training operators on swap and routing alerts
Night teams should understand three alert classes: swap now (low state of charge at safe hold point), reroute (wind or obstacle segment skip), and defer (moisture or rain). Mixing responses wastes cycles. Monthly drill: one simulated swap under time target, one map segment review after obstacle abort. Tie bonuses to documented coverage percent, not robot hours powered on.
Can battery optimization alone fix under-sized fleets?
No. If base robot count cannot cover plant hectares at required pass interval even at perfect routing efficiency, software only reduces waste on an insufficient fleet. Optimization lowers required count for a target cadence but does not eliminate physics. Run hectare-per-robot-per-night benchmarks during pilot before IC approval.
How should O&M spec battery optimization in robot tenders?
Require documented area-per-charge benchmarks on pilot rows, swap turnaround SLA, map update procedure after layout changes, and weekly transit-to-cleaning ratio reports. Optimization claims without logged metrics should score zero in technical evaluation.
Key takeaways
- Battery optimization is routing plus operations, not a bigger pack alone.
- Persistent array maps cut dead travel on Indian tracker rows.
- Swap programs extend night hours on 50 MW+ sites when staffed correctly.
- Demand A/B coverage proof and swap turnaround KPIs at acceptance.
- Cloudy-week partial charge logic protects MWh on highest-soiling blocks.
Related resources
Frequently asked questions
It is software and operations discipline that maps the array once, sequences rows to minimize dead travel, prioritizes high-soiling blocks when charge is limited, and schedules battery swap or dock charging so each watt-hour cleans maximum module area. Goal is coverage per charge, not maximum robot speed.
Swapped packs return robots to row entry in minutes versus hours on fixed dock charging. On 100 MW sites, rotation of three to four charged packs per active robot can extend effective cleaning hours past single-cycle limits, especially when routing software avoids retraced rows.
Vendor-validated cases on mapped utility arrays often reach roughly 1.8x to 2.2x area per charge versus unoptimized paths on the same hardware. Multiplier depends on row length, inter-row gaps, tracker undulation, and operator swap discipline. Demand site simulation, not brochure averages.
Battery-aware systems rank blocks by soiling economic score and complete highest-value zones first instead of aborting mid-array. Partial meaningful coverage beats failed full-plant attempts that exhaust packs on transit-heavy routes.
Track state of charge at row start and end, area cleaned per cycle, swap turnaround time, and deferred blocks with reason codes in the fleet dashboard. Weekly review transit-to-cleaning time ratio; rising transit share often means map drift or obstacle aborts needing field fix.