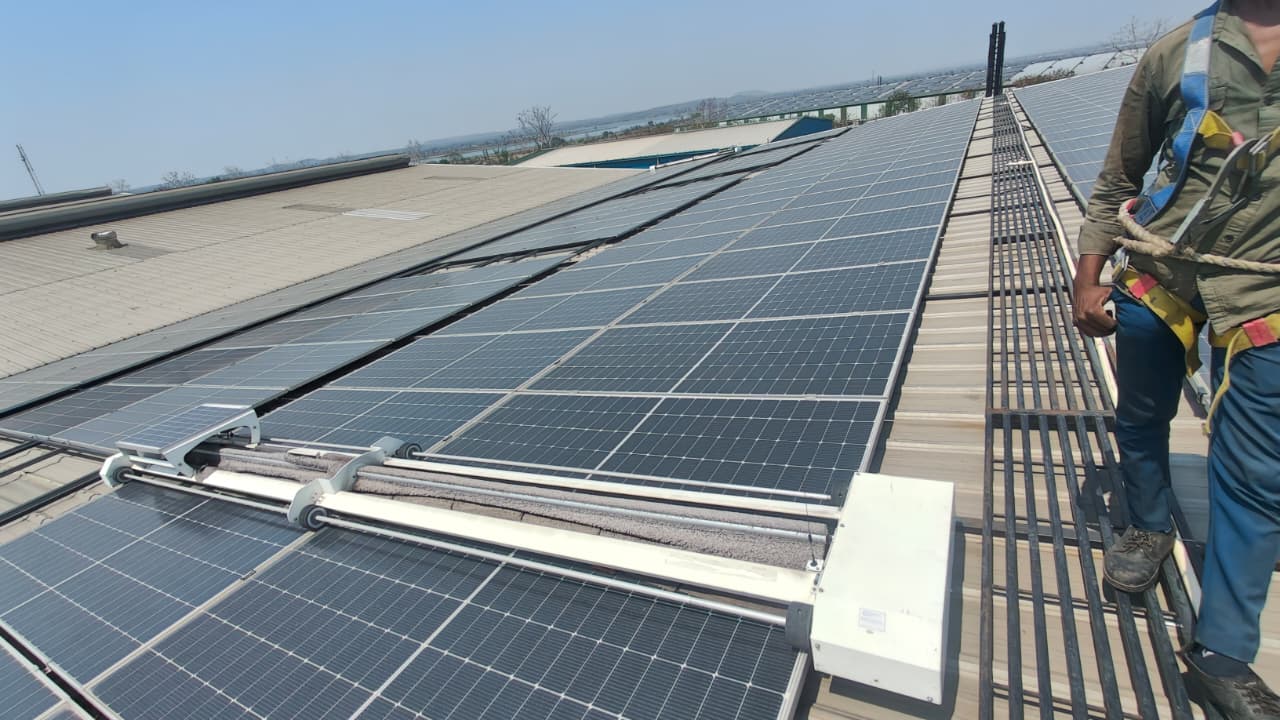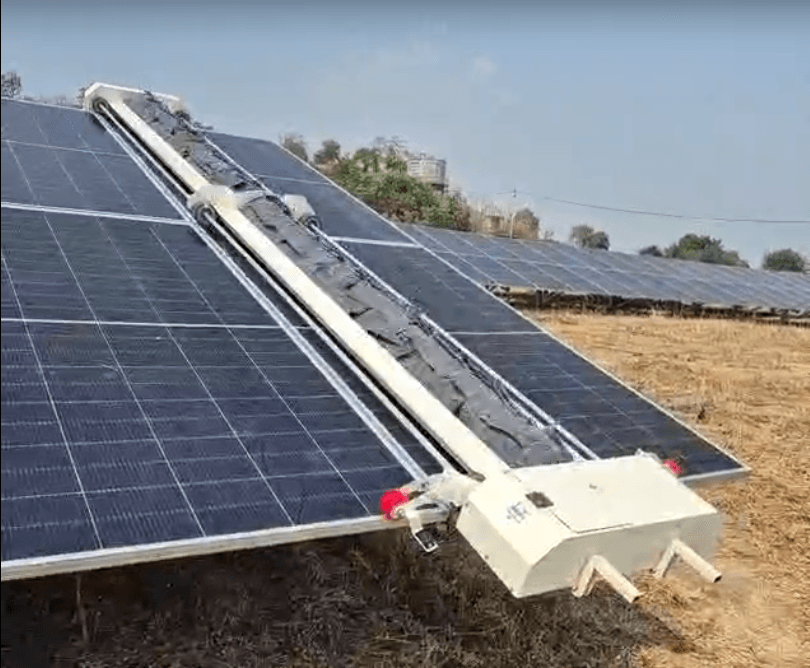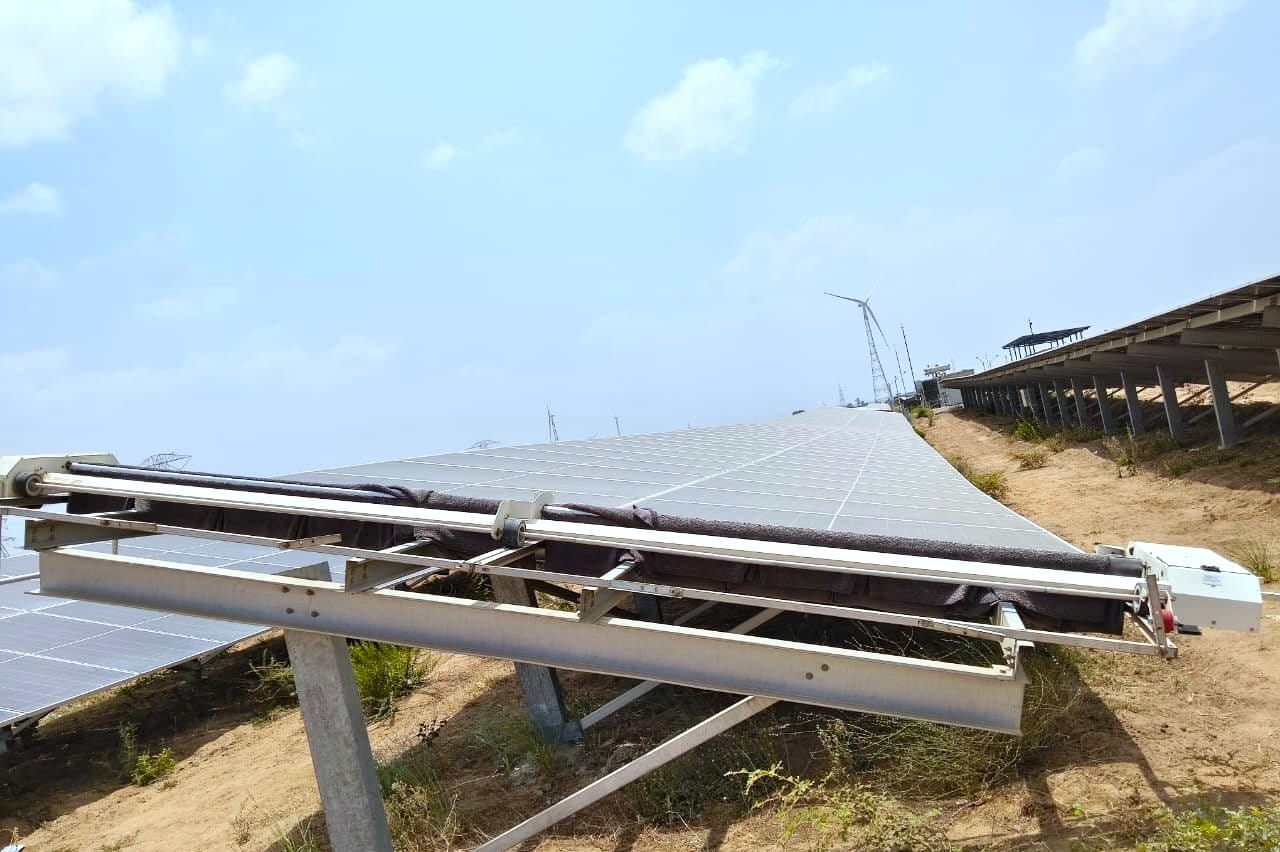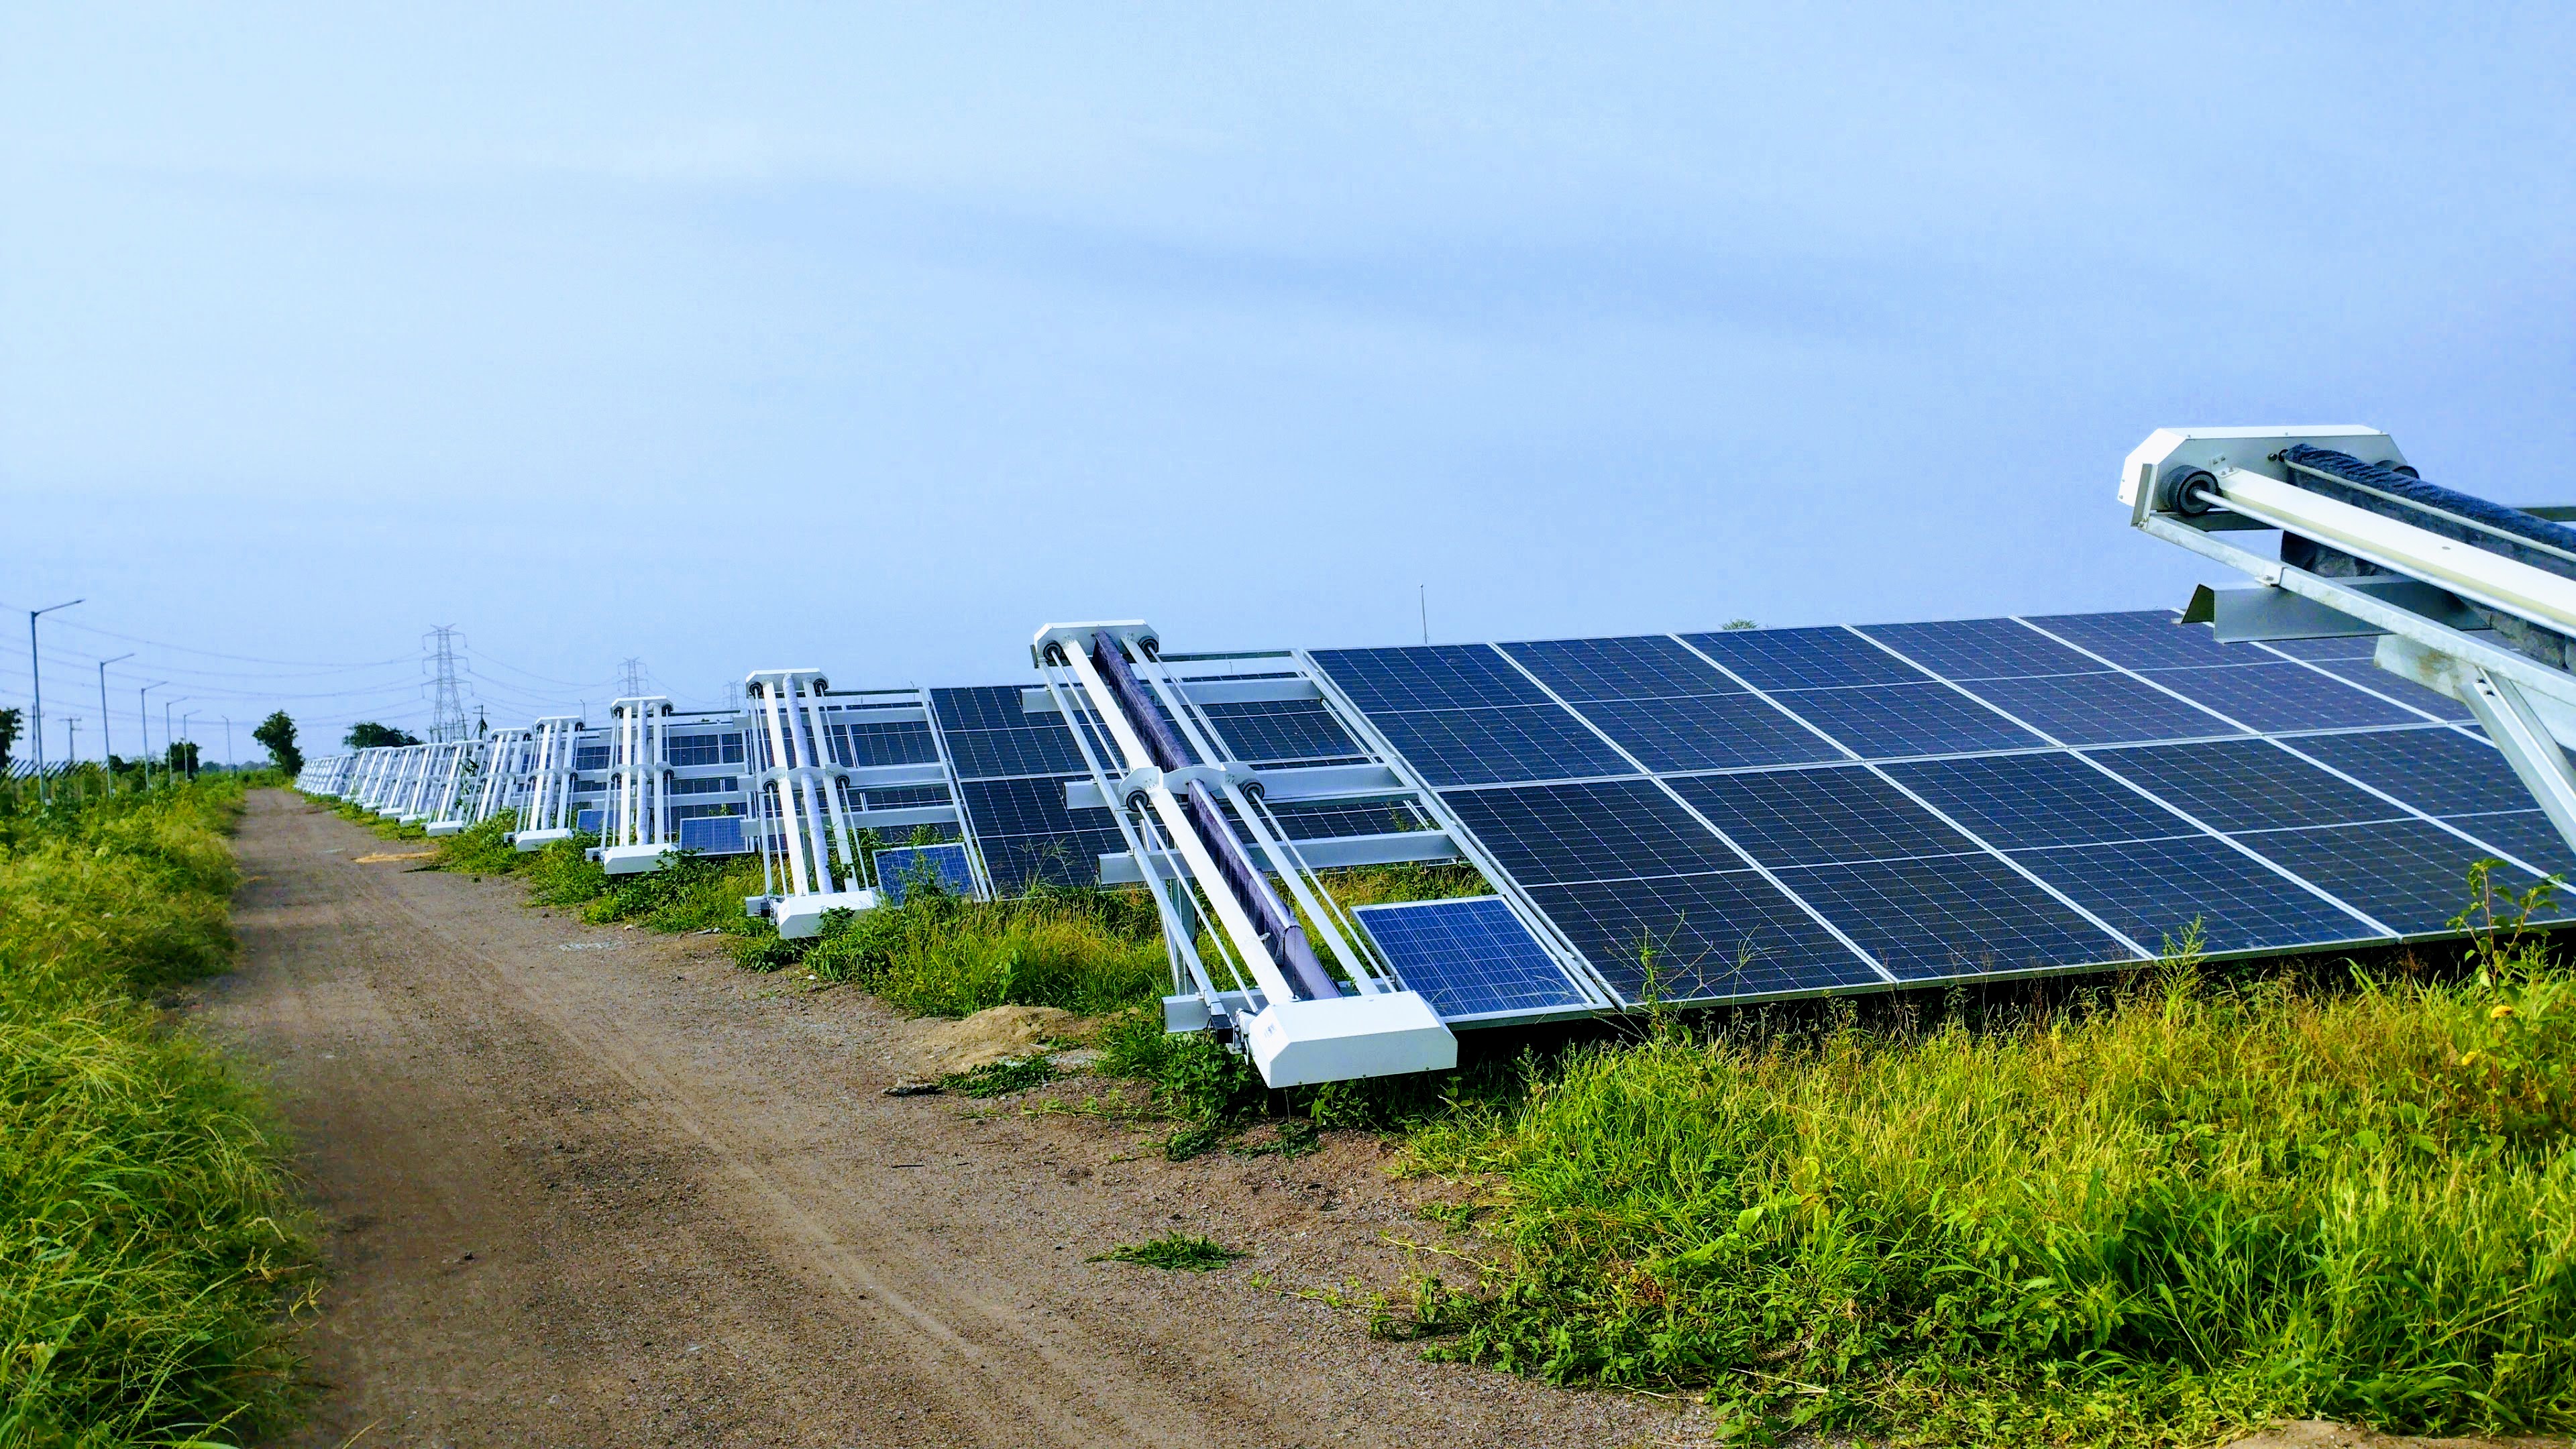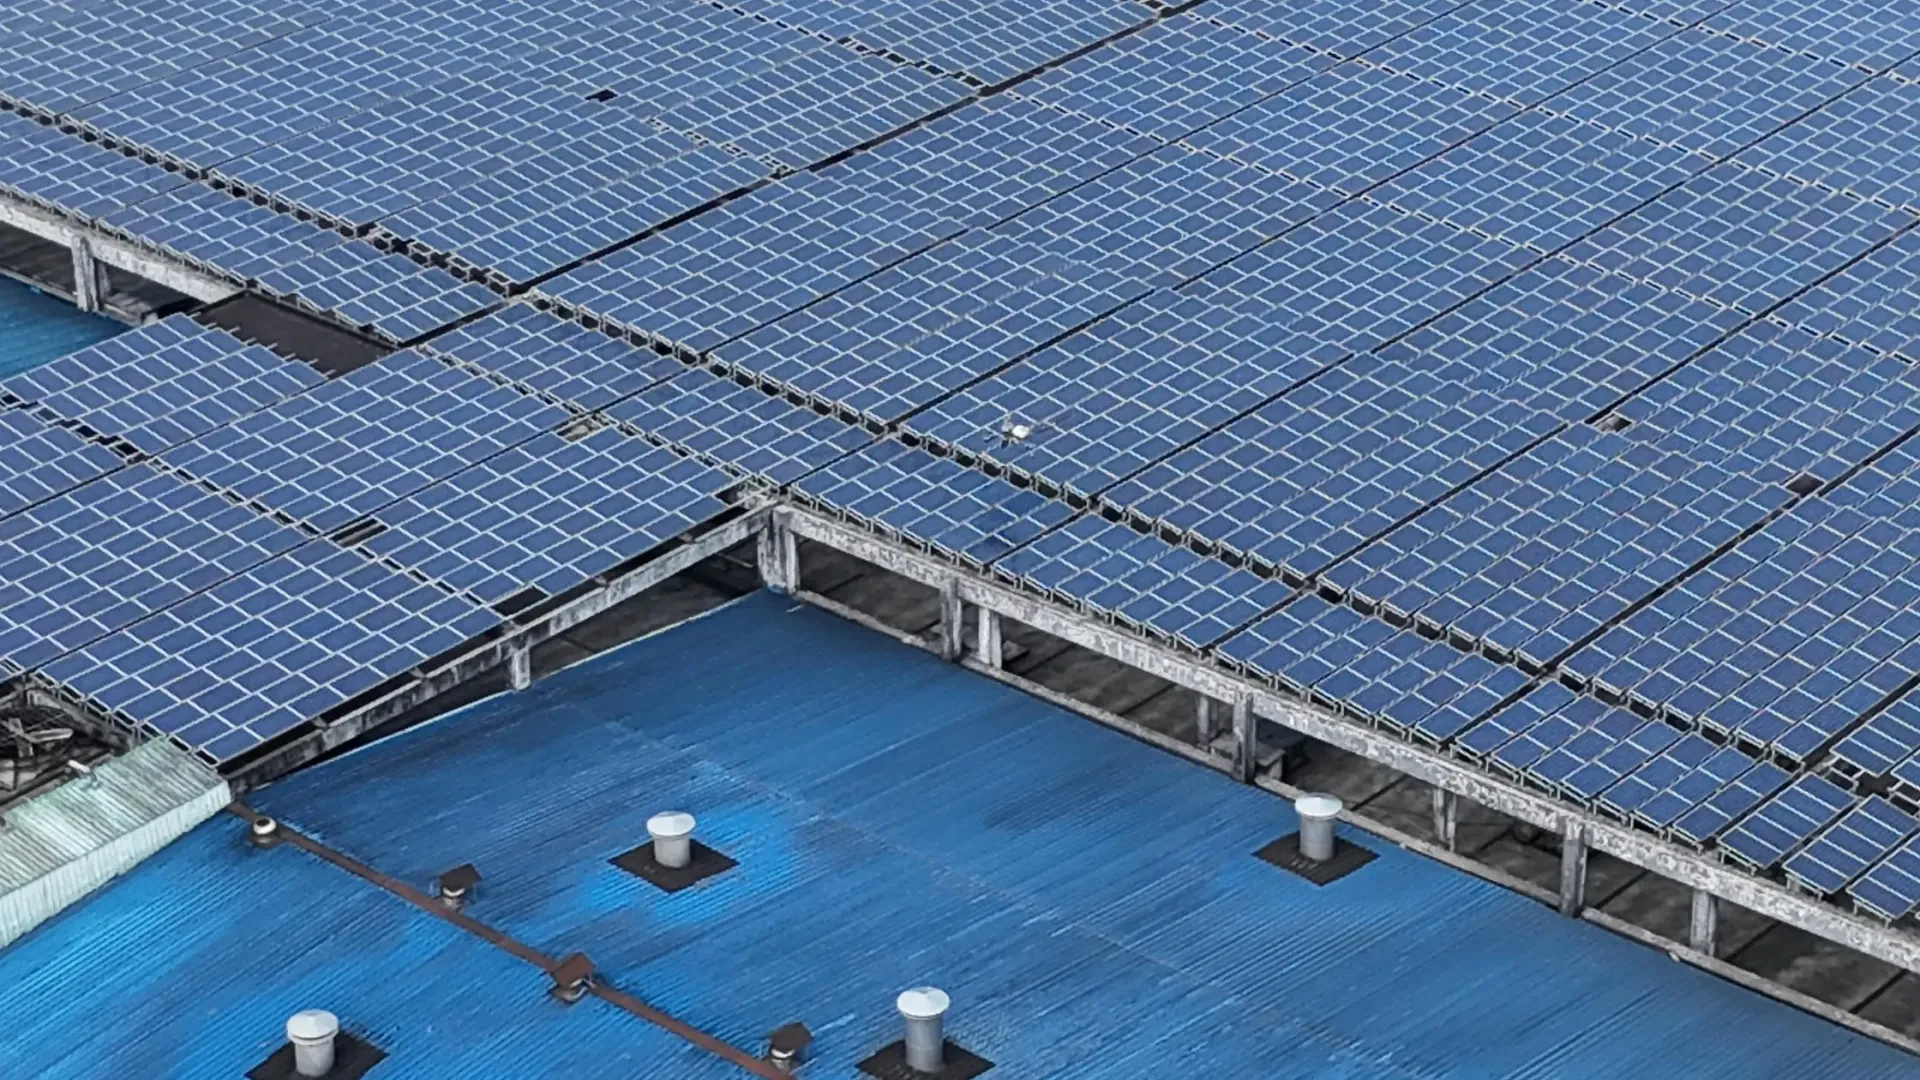
Indian utility IPPs still schedule panel cleaning from calendars, tanker availability, and contractor quotes. Performance ratio drift between passes is often visible in SCADA but not tied to which blocks were cleaned, skipped, or aborted. At multi-gigawatt daily robotic throughput across active fleets, every night adds labelled field experiments: soiling response by state, battery draw on long tracker rows, wind abort patterns, and post-pass PR movement on reference blocks.
This article explains why utility scale solar cleaning data analytics compounds when throughput is high, what telemetry finance and O&M teams should demand, and how cross-site learning beats one-off manual programs on 25 to 500 MW assets in Rajasthan, Gujarat, and Maharashtra dust belts.
Quick answer
- Volume of labelled passes trains soiling and scheduling models faster than sparse manual cleans.
- Block-level logs link coverage to PR recovery, not just robot uptime.
- Cross-site libraries let new plants inherit regional dust and storm patterns.
- Exportable audit trails support AMC evidence and lender technical reviews.
- Demand telemetry contracts in robot RFPs, not dashboard screenshots alone.
What changes when daily cleaning runs at GW scale
A 100 MW plant with manual wet cleaning might log four to eight full-plant events per dry season. A robotic program on the same footprint can log hundreds of block passes per month with timestamps, environmental tags, and fault codes. Multiply that across dozens of sites and daily portfolio throughput crosses gigawatt-hours of cleaned DC nameplate in aggregate operational rhythm.
That scale shifts analytics from anecdote to statistics. Monsoon-shoulder defer patterns from coastal Maharashtra inform cadence in western Rajasthan. Tracker row length profiles from prior deployments refine routing on new single-axis blocks. Models stop extrapolating from lab soiling coupons and start learning from India's largest continuous cleaning dataset in production.
Core telemetry fields IPPs should require
| Data field | Why it matters | Example use |
|---|---|---|
| Block and row coverage % | Proves pass completeness | AMC bonus or penalty bands |
| Abort reason code | Separates weather from mechanical fault | Storm week recovery planning |
| State of charge start/end | Links battery policy to area cleaned | Fleet sizing and swap cadence |
| Environmental tag | Dew, wind, rain context | Postpone vs push decisions |
| Pass duration | Throughput benchmarking | Robot count for new blocks |
| 7-day PR delta on reference | Validates cleaning ROI | Board MWh recovery narrative |
Labelled telemetry vs generic SCADA
Plant monitoring shows inverters online and perhaps soiling estimates from reference cells. It rarely records why block C was half-covered Tuesday or which rows deferred for dew. Fleet intelligence closes that gap: each cycle carries structured labels operators and algorithms reuse.
Without labels, asset managers debate whether PR dip is soiling, curtailment, or tracker fault. With block-pass history correlated to irradiance-normalized output, teams prioritize the next night’s blocks by economic soiling window, not guesswork.
Cross-site learning on Indian utility portfolios
A plant commissioned in Q3 does not start from zero if the vendor fleet already operated through two pre-monsoon dust peaks in similar terrain. Scheduling inherits seasonal priors. Soiling prediction draws on regional dust libraries across fixed-tilt, seasonal-tilt, and tracker layouts.
Holding companies with multiple SPVs benefit most: a lesson on battery swap timing at a 150 MW Gujarat tracker site applies to a new 80 MW block in the same wind corridor. Data advantage is portfolio-wide, not trapped in one site manager’s notebook.
Analytics use cases for finance and O&M
| Stakeholder | Question | Analytics output |
|---|---|---|
| O&M lead | Which blocks to clean tonight? | Ranked soiling score + weather window |
| Asset manager | Did we recover MWh this month? | Coverage-weighted PR bridge |
| Finance | Is robot AMC worth renewal? | ₹ per recovered MWh vs manual baseline |
| Lender TA | Is cleaning documented? | Exportable cycle audit log |
| EPC warranty | Module cleaning compliance | OEM-approved pass records |
How NECTYR-style dashboards fit the stack
Live fleet maps, fault root-cause tags, and weather-driven schedule inputs only matter when underlying pass data is complete. Indian operators should verify API or CSV export, retention period, and block ID alignment with SCADA segment naming before COD. A pretty map without export fails the first technical advisor review.
Integrate cleaning logs with existing performance ratio workflows described in performance ratio calculation guides so recovered energy appears in monthly investor reports, not a siloed robot app.
Data governance and vendor lock-in risks
Specify data ownership in contracts: the IPP owns pass logs, environmental tags, and derived soiling scores. Vendors may host the platform but must allow export if the fleet changes. Retention of at least five years supports refinancing and warranty disputes.
Anonymized portfolio aggregates help vendors improve models, but site-level raw logs belong to the asset. Clarify GDPR-style personal data is minimal; focus on operational telemetry rights.
Pilot design to prove analytics value
- Select two high-soiling blocks with reference modules and revenue meters where possible.
- Run 30 days of robotic passes with full telemetry export enabled.
- Build PR bridge: baseline, soiling drift, post-pass recovery, curtailment-normalized.
- Compare deferred blocks (weather) vs completed blocks for MWh delta.
- Present ₹ recovery per cleaning hour to IC before fleet expansion.
Cross-check fleet communications requirements in mesh network connectivity on solar farms so logs sync from far blocks.
When GW-scale data does not help
Analytics cannot fix wrong row geometry, sub-75% fleet uptime, or modules cleaned with unapproved methods. Garbage passes produce garbage labels. Small plants with mild soiling may not justify enterprise analytics spend unless part of a larger portfolio license.
Manual-only sites can still improve logging by tagging crew visits in O&M tickets, but they will not match pass frequency of autonomous programs on dust-heavy utility assets.
Should a 200 MW IPP demand cleaning data analytics in its robot RFP?
Yes, if PR volatility exceeds 2% between manual passes and the PPA tariff exceeds ₹3.00/kWh. Require block-level coverage export, abort reason codes, 24-month retention, and API access for SCADA integration. Treat analytics as part of deliverables equal to brush OEM approval. Without it, multi-crore fleet capex becomes a black box at first lender review.
Building an internal PR plus cleaning correlation model
Start with three data streams: daily irradiance-normalized PR from SCADA, block pass completion flags from the robot platform, and local weather. Join on block ID and date. Plot PR recovery in the 72 hours after completed passes versus deferred blocks. Most Indian utility pilots show steeper recovery on completed high-soiling zones within 48 hours when weather stays dry.
Extend the model monthly with seasonal dummies for pre-monsoon dust and post-harvest agricultural particulate near farmlands. Gujarat sites adjacent to cotton ginning belts often show secondary dust peaks unrelated to calendar assumptions. Fleet-scale history from peer blocks in the vendor portfolio accelerates those seasonal priors for greenfield SPVs.
Security, retention, and audit readiness
Telemetry contracts should specify encryption in transit, role-based dashboard access, and minimum five-year retention for pass logs. Lenders and technical advisors increasingly request cleaning evidence during refinancing. Exportable CSV or API access avoids screenshot debates. Align block naming between SCADA, revenue meters, and robot maps before COD so joins do not break in year two.
How does fleet analytics change robot AMC negotiations?
When coverage percent and abort codes are exportable, AMC shifts from vague uptime promises to measurable KPIs: minimum monthly block completion rate, maximum hours to recover from fleet-down events, and PR review cadence with vendor participation. Owners gain leverage; vendors gain credit for documented performance. Without analytics, both sides argue from anecdote after the first dry season.
Key takeaways
- GW daily cleaning rhythm generates labelled field data manual programs cannot match.
- Require block coverage, abort codes, and exportable logs in contracts.
- Cross-site learning speeds scheduling on new Indian utility blocks.
- Tie telemetry to PR bridges and ₹ per MWh for board credibility.
- Data ownership stays with the IPP, not the vendor dashboard alone.
Related resources
Frequently asked questions
It is the structured analysis of block-level cleaning passes, environmental context, battery use, abort reasons, and post-clean performance ratio trends across large MW fleets. At multi-GW daily throughput, labels arrive in volume so models can predict soiling cadence, storm recovery, and coverage gaps instead of relying on calendar schedules.
Sparse manual cleaning produces few labelled events per month. Robotic fleets running nightly across hundreds of MW generate thousands of pass records with weather, row geometry, and outcome tags. More labelled cycles reduce model variance and improve scheduling accuracy for new sites in similar dust regimes.
Minimum useful fields include block ID, row coverage percent, start and end state of charge, wind and rain aborts, dew or wet-element postpones, pass duration, fault codes, and seven-day PR delta on reference blocks. Exportable audit logs support AMC disputes and lender technical reviews.
A single site can log passes and correlate PR locally, but cross-site libraries for seasonal dust, tracker undulation, and regional storm recovery require fleet-scale history. New plants inherit priors from portfolio data when vendors operate at GW daily cleaning rhythm.
They tie recovered MWh to documented coverage, show deferred blocks with root cause, benchmark fleet uptime against contract KPIs, and stress-test soiling scenarios before monsoon. Analytics turn cleaning from a line-item expense into a measurable PR recovery program.