ROI conversations for robotic solar cleaning fail when they compare robot list price to one manual invoice. Finance teams on Indian utility assets need five-year fully loaded cost against MWh recovered at the PPA tariff, especially in dust belts where performance ratio bleeds between crew visits. A 50 MW Rajasthan plant skipping that math may approve capex that never clears hurdle rate, or reject robots that would have paid back in three dry seasons.
This article frames robotic cleaning ROI the way IPP asset managers and lenders should: soiling curves, water savings, throughput after storms, and sensitivity to uptime. Numbers are illustrative for structure; your pilot data must replace defaults.
Quick answer
- ROI = recovered ₹ from MWh minus 5-year cleaning TCO.
- Robots win when frequency × scale breaks manual economics.
- Include water, labour, downtime, and comms in TCO.
- Prove PR uplift on dirty blocks before fleet orders.
- Stress-test uptime and tariff sensitivity for board packs.
Why sticker-price comparisons mislead
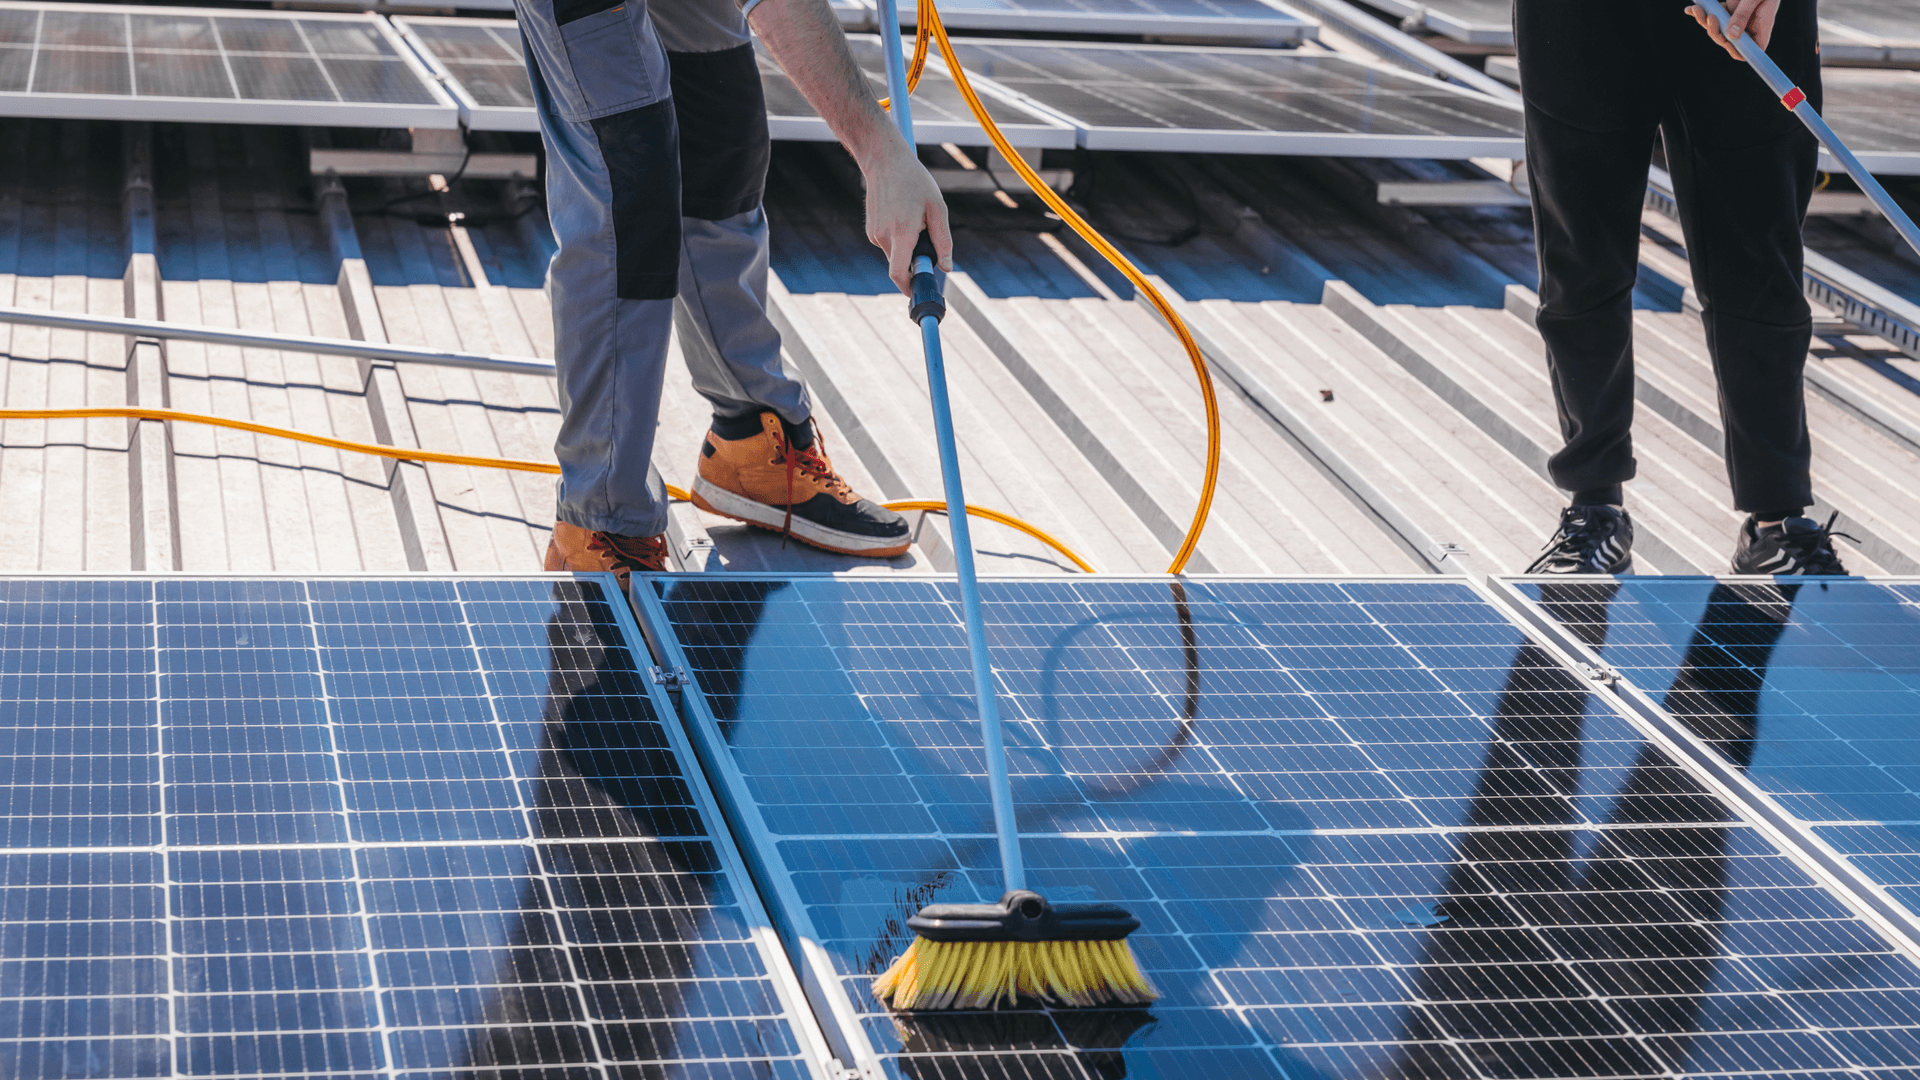
Vendors quote per-robot capex; O&M contractors quote per-pass manual rates. Neither is comparable without annual pass count, full-plant cycle time, water litres, and average PR maintained. A robot fleet costing ₹2 crore more than five years of manual may still win if manual leaves 3% extra average PR loss worth ₹1 crore+ annually on 40 MW at ₹3.50/kWh.
Build both sides of the ledger. Use cost-benefit analysis framework and ROI calculator with site soiling, not brochure defaults.
ROI drivers on Indian utility sites
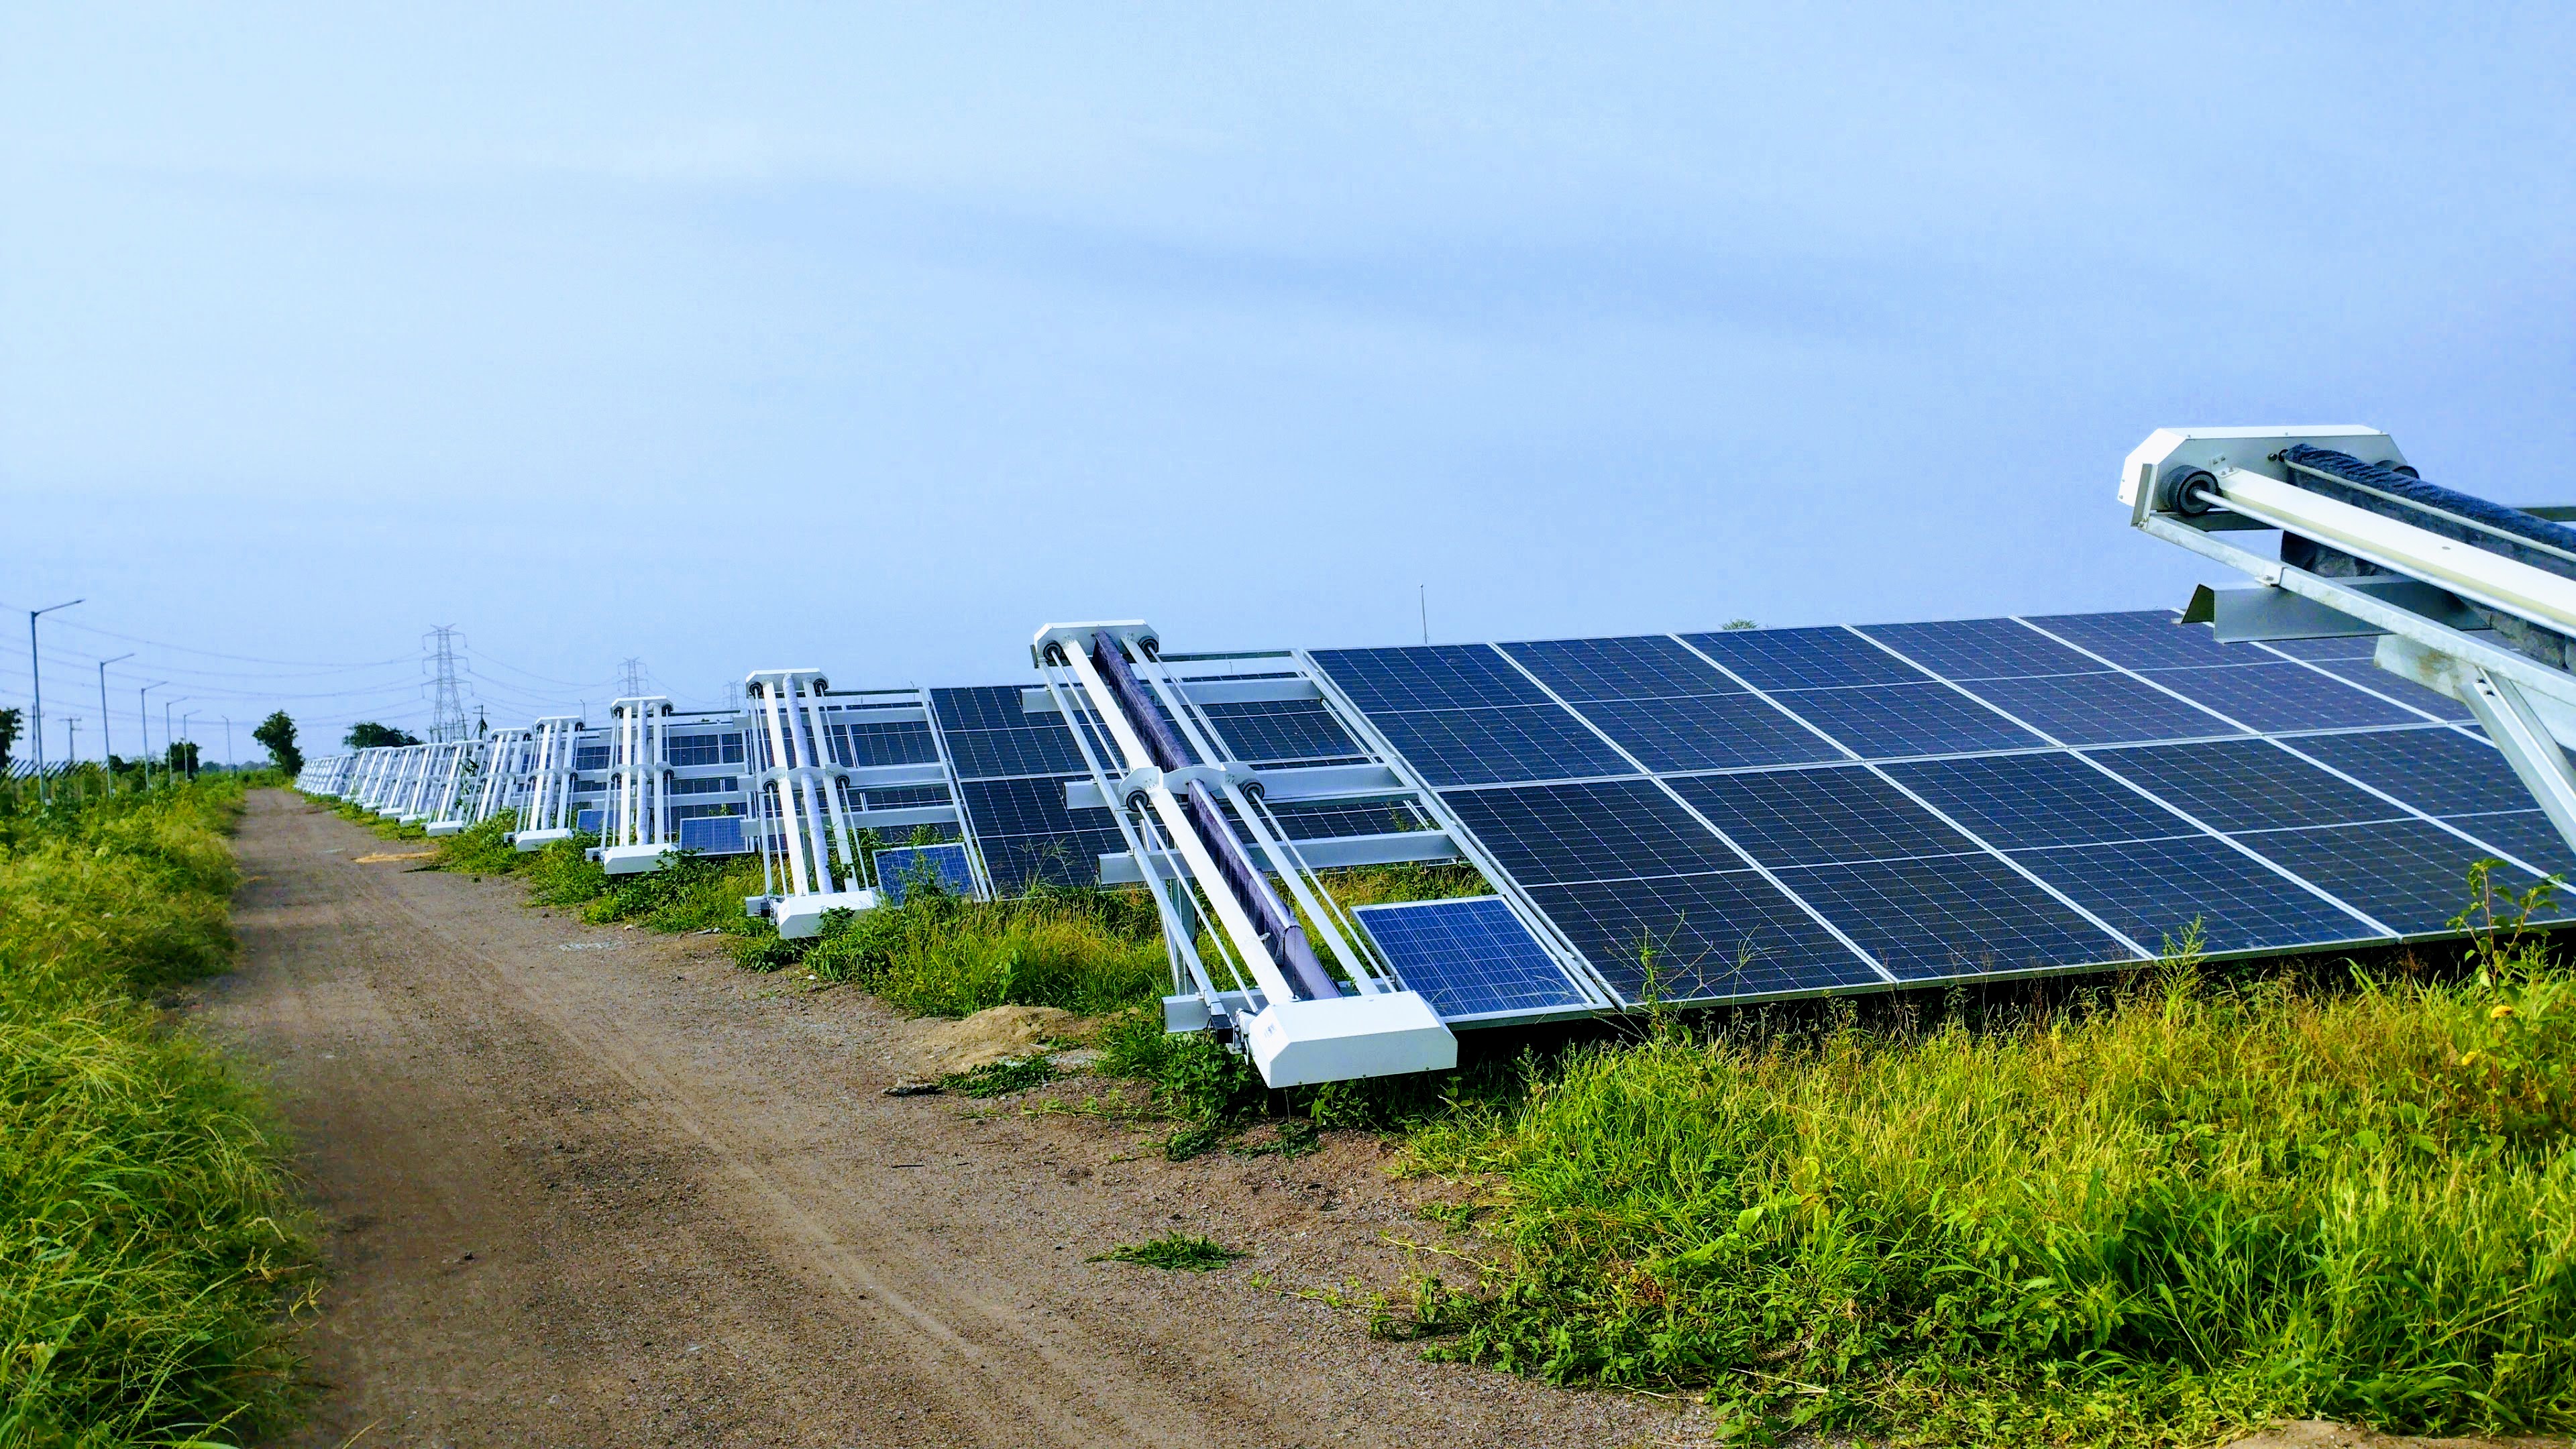
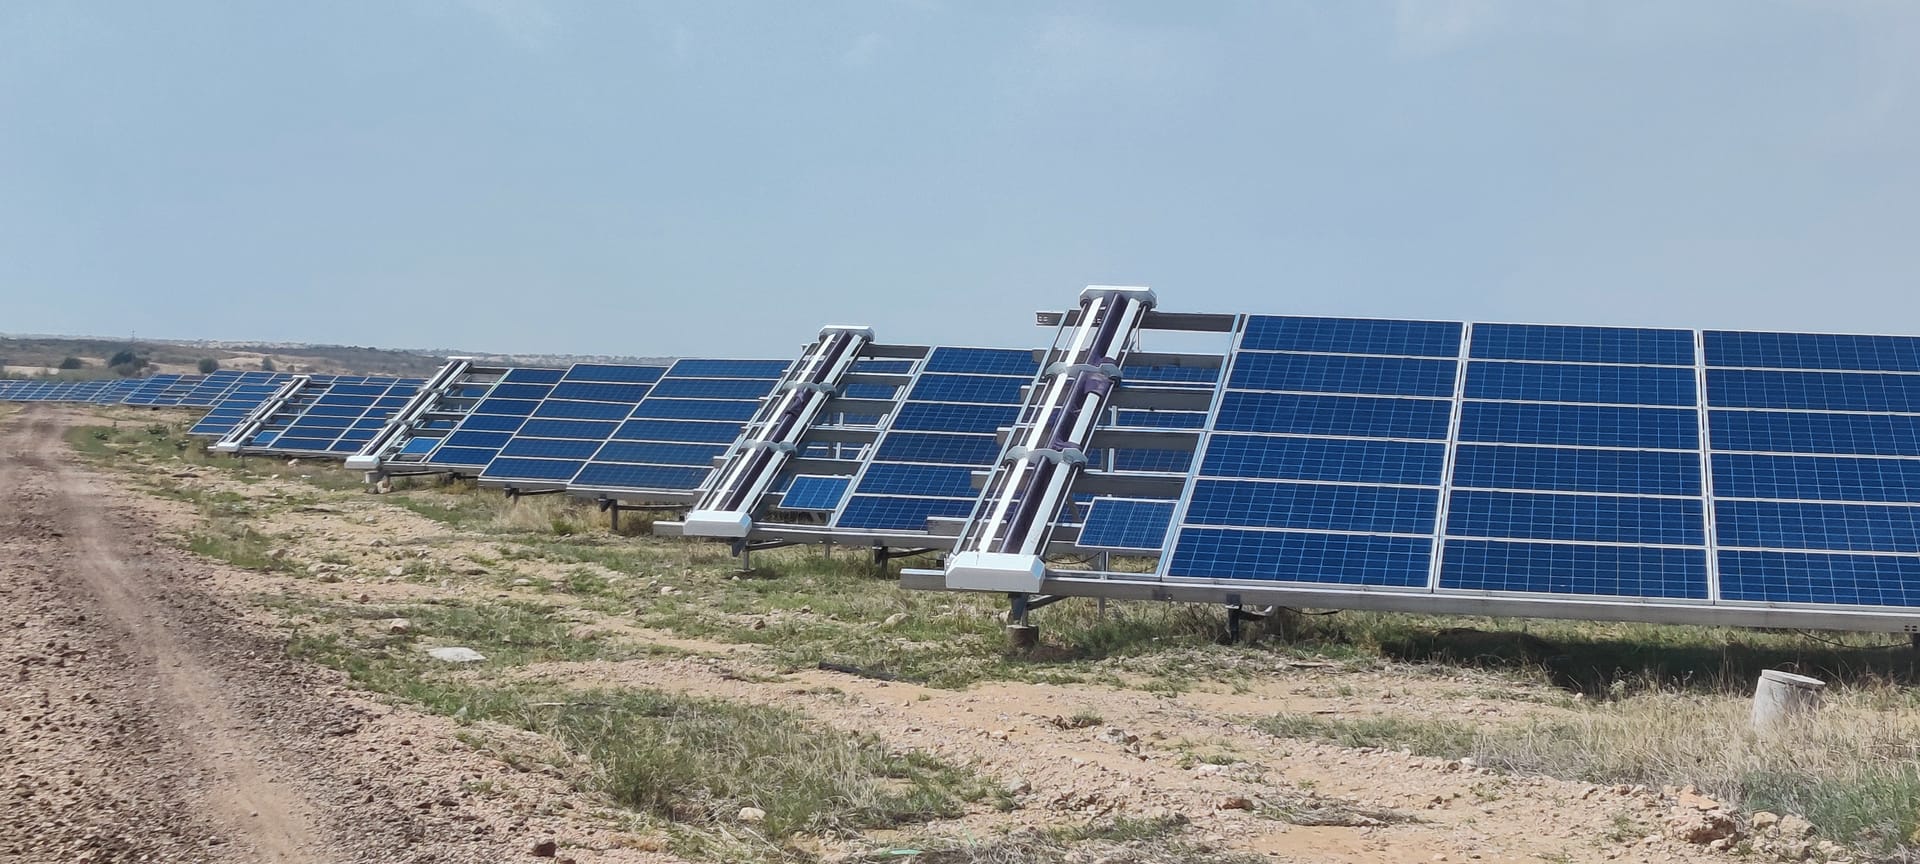
High soiling rate increases MWh at risk. Large plant size lengthens manual full-plant cycles. Water cost and scarcity raise wet method expense. Tracker geometry slows manual rows. High PPA tariffs increase value per recovered MWh. Night-cleaning robots avoid daytime generation conflicts on strict off-taker schedules.
Low soiling, small plants, cheap water, and already-fast manual cycles compress robot advantage. Honest pilots identify which regime you occupy.
ROI driver matrix
| Factor | Robot ROI improves when... |
|---|---|
| Soiling rate | PR loss 3%+ sustained dry season |
| Plant size | Manual full pass >7–10 days |
| Water cost | High tanker or capped withdrawal |
| PPA tariff | ₹3.25/kWh+ recovered energy value |
| Geometry | Robot-fit rows, tracker night clearance |
| Fleet uptime | 85–90%+ with coverage logs |
Worked 10 MW illustration (arid fixed-tilt)
Assume specific yield 1,600 kWh/kWp, PPA ₹3.50/kWh, dry-season manual program leaves 4% average PR below clean baseline while robots hold 1.5% gap. MWh difference roughly 400 MWh/year on 10 MW, about ₹14 lakh annual revenue. If incremental five-year robot TCO over manual is ₹40–60 lakh, simple payback often lands in three to four years before water savings. Scale to your blocks.
Cross-check with 10 MW waterless vs manual comparison.
Five-year TCO lines finance must include
| Cost line | Manual wet (25 MW illustrative/yr) | Robot fleet (25 MW illustrative/yr) |
|---|---|---|
| Labour + supervision | ₹45–75 lakh | ₹12–22 lakh |
| Water + tankers | ₹15–30 lakh | ~₹0–3 lakh |
| Capex amortized | Low | ₹50–90 lakh |
| Comms / charging | Low | ₹5–12 lakh |
| Manual backup | N/A | ₹8–15 lakh |
Add recovered MWh on the benefit side, not only costs.
Payback sensitivity owners should model
Run scenarios: PPA at ₹3.00, ₹3.50, ₹4.00/kWh; fleet uptime 75%, 85%, 95%; soiling recovery 2%, 3.5%, 5% average PR. Boards approve when downside cases still approach hurdle, not when upside-only vendor cases look good.
Tie O&M contracts to PR and coverage KPIs so ROI does not erode after year one.
Pilot design that satisfies lenders
- Pick two high-soiling blocks with reference modules.
- Log 14-day pre-campaign irradiance-normalized PR.
- Run robot passes with coverage report; log aborts.
- Measure 7-day post-clean PR on similar weather.
- Extrapolate annual ₹ and MWh; document assumptions.
Read deployment steps and measured benefits.
When manual still wins on ROI
Smaller sites with mild soiling, reliable cheap water, and four-day manual cycles may not clear robot capex. Legacy geometry blocking robots without retrofit plans forces manual until layout changes. Do not force fleet ROI where pilots show low coverage or sub-2% PR recovery.
Compare robot vs manual overview and traditional vs waterless deep dive.
Refinancing and lender scrutiny
Refinancing windows are when robot ROI gets scrutinized. Presenting three-year actual PR with and without cleaning spend helps credit officers separate operational discipline from resource risk. Assets with autonomous programs and logs often face fewer technical advisor questions than manual-only peers with unexplained PR gaps.
Inflation and wage escalation in manual models
Manual cleaning TCO models should escalate labour and tanker rates 5-8% annually in hot labour markets near growing solar clusters. Robot TCO escalates on spare parts and O&M contracts but is less sensitive to monsoon labour shortages. Five-year comparisons that freeze manual wages understate manual side and overstate robot payback.
Include diesel for tankers and tractors where applicable; fuel volatility hit Rajasthan manual programs hard in recent years.
Comparing lease versus purchase for robot fleets
Lease structures shift capex off balance sheet and may include uptime guarantees from vendor O&M. Purchase models depreciate faster but carry spare parts risk. ROI math differs: lease compares annual payment to manual opex avoided; purchase amortizes over life. Finance should run both before treasury selects structure.
Some Indian IPPs lease first fleet to prove PR, then purchase expanded units after pilot year. Hybrid financing is valid when credit lines are constrained at holdco level.
Board packs should show one-page tornado chart: payback sensitivity to tariff, uptime, and soiling recovery. Executives approve when downside still approaches acceptable IRR on equity, not when upside-only vendor cases look attractive.
Tax, depreciation, and balance-sheet treatment
Indian IPPs should involve finance early on whether robot fleets classify as plant machinery eligible for accelerated depreciation or lease structures. Treatment affects after-tax ROI comparisons versus manual opex-heavy models. Lease versus buy shifts hurdle rates and may suit assets near refinancing.
Include GST, import duties, and state incentives in capex models where applicable. A robot ROI slide ignoring taxes misleads board votes.
Contract structures that protect ROI after install
O&M agreements should specify minimum monthly coverage percent, maximum hours to recover from fleet-down events, and PR review cadence with robot vendor participation. Without contractual teeth, uptime erodes silently in year two when attention moves to inverter retrofits.
Performance-linked payments, bonus for exceeding PR targets and penalty bands for chronic coverage gaps, align vendor incentives with owner ROI. Manual-only contracts rarely had such clauses; robot programs need them.
Should a 50 MW Gujarat tracker IPP approve robots for maximum ROI?
If post-storm manual mobilization exceeds your economic soiling window, water costs are rising, and pilot blocks show 3%+ PR recovery with 90%+ row coverage, robots often clear typical IPP hurdle rates in two to five years at tariffs above ₹3.25/kWh. If manual vendor already hits five-day full-plant cycles with 2% PR gap only, defer fleet capex or pilot smaller hybrid scope first.
Sensitivity to curtailment matters: plants with high grid curtailment may value recovered MWh less when evaluating cleaning ROI. Normalize PR on uncurtailed hours where SCADA allows so cleaning benefit is not hidden inside dispatch loss.
Key takeaways for plant managers
- Model five years with MWh recovery on both sides of the ledger.
- Never approve from robot sticker price vs one manual quote.
- Pilot on dustiest blocks; demand coverage logs and PR proof.
- Stress-test uptime and tariff in board sensitivity tables.
- Link O&M KPIs to PR so ROI survives operations reality.
Robot ROI cases should stress-test uptime below vendor claims. Sensitivity tables at 75% and 85% uptime prevent over-optimistic IC approvals.
Related resources
Frequently asked questions
When frequent dust causes sustained PR loss, manual cleans are expensive or too slow for storm recovery, and robots maintain higher average PR at lower five-year fully loaded cost than the manual baseline. ROI improves with scale, water stress, and high soiling rates typical of western Indian deserts.
Highly site-dependent. Many Indian arid utility analyses with material soiling cluster roughly two to five years simple payback on incremental robot spend versus manual, when uptime and coverage meet pilot thresholds. Mild sites or low tariffs extend payback; validate never copy vendor slides.
Fleet capex or lease, batteries, brushes, maintenance, software, comms infrastructure, charging build, operator labor, downtime, training, and manual backup for exceptions. Exclude sticker price alone or comparisons ignore half the ledger.
Require block-level PR before and after pilots on dirty reference modules, independent soiling measurement, and sensitivity tables on PPA tariff plus or minus 10%, cleaning frequency, and fleet uptime at 75%, 85%, and 95%.
Yes. Poor row fit, low night uptime after wind aborts, duplicate manual crews, and ignoring waterless-plus-wet hybrid needs can make robots more expensive than manual with worse PR. Installation quality and O&M discipline are part of ROI, not optional.