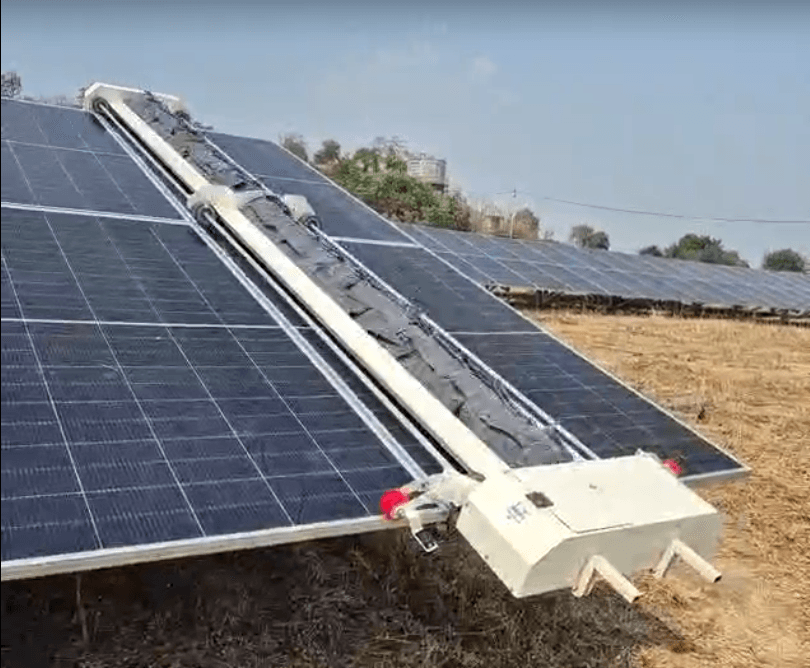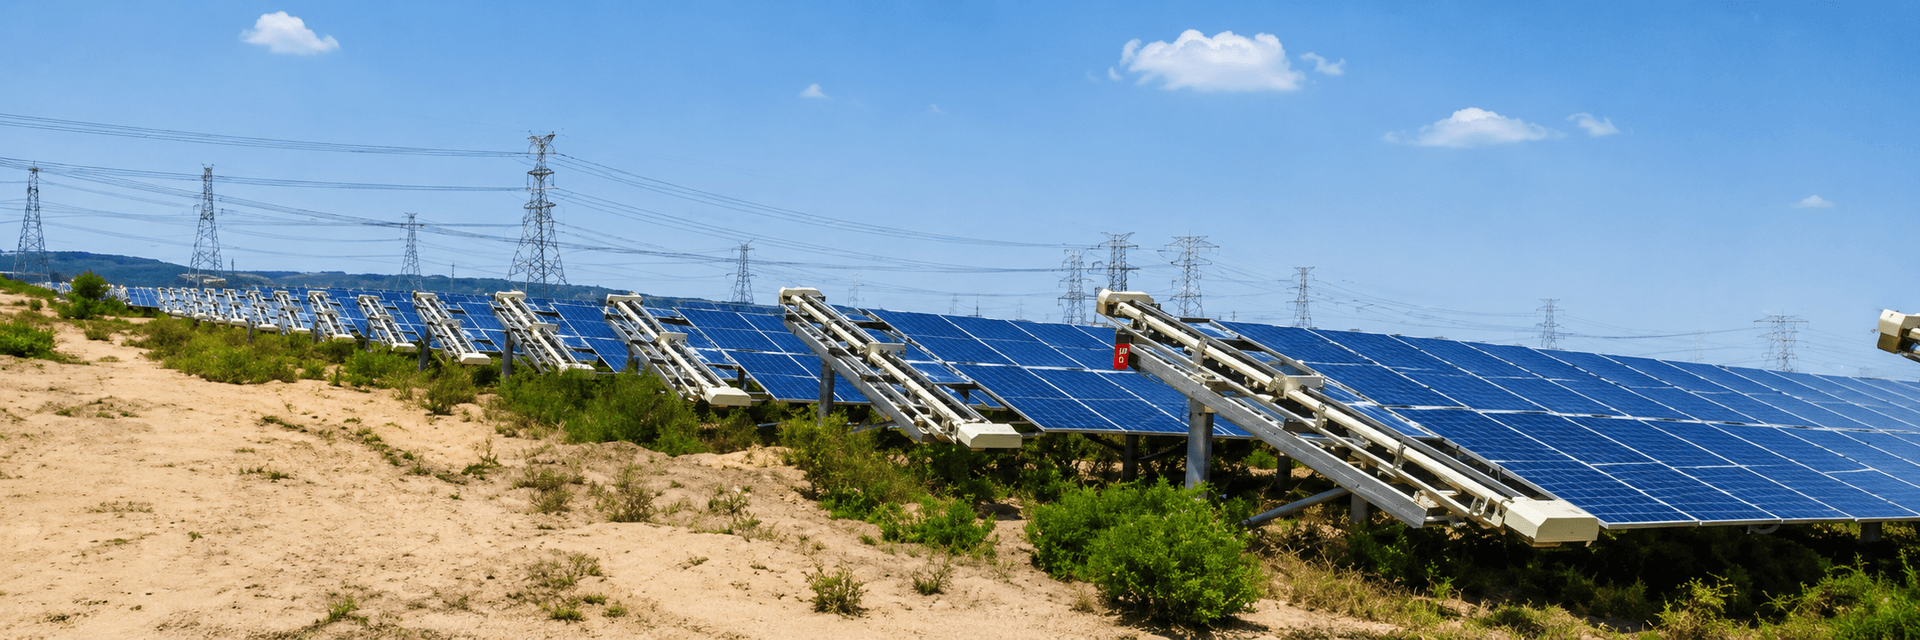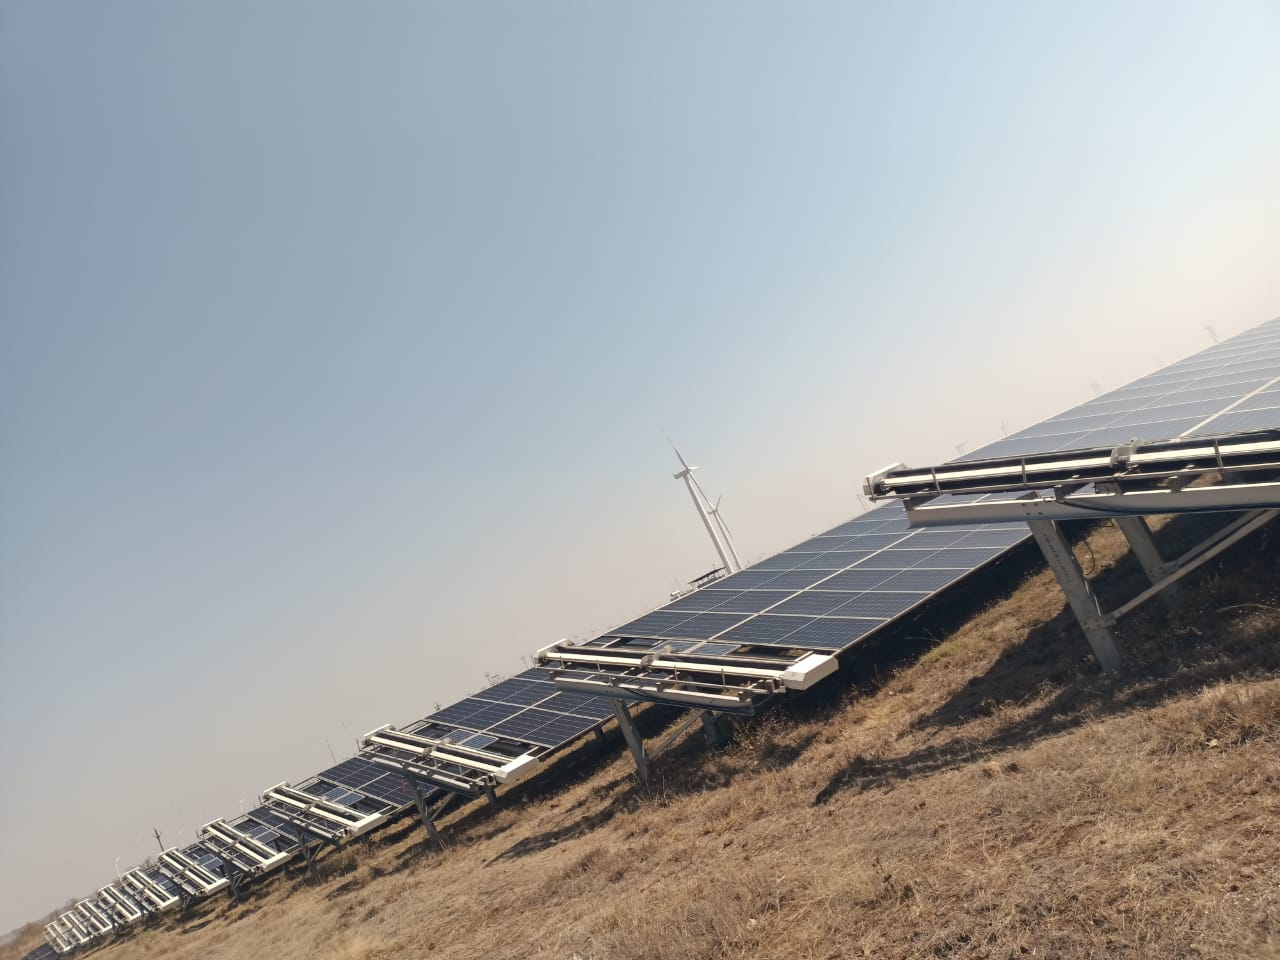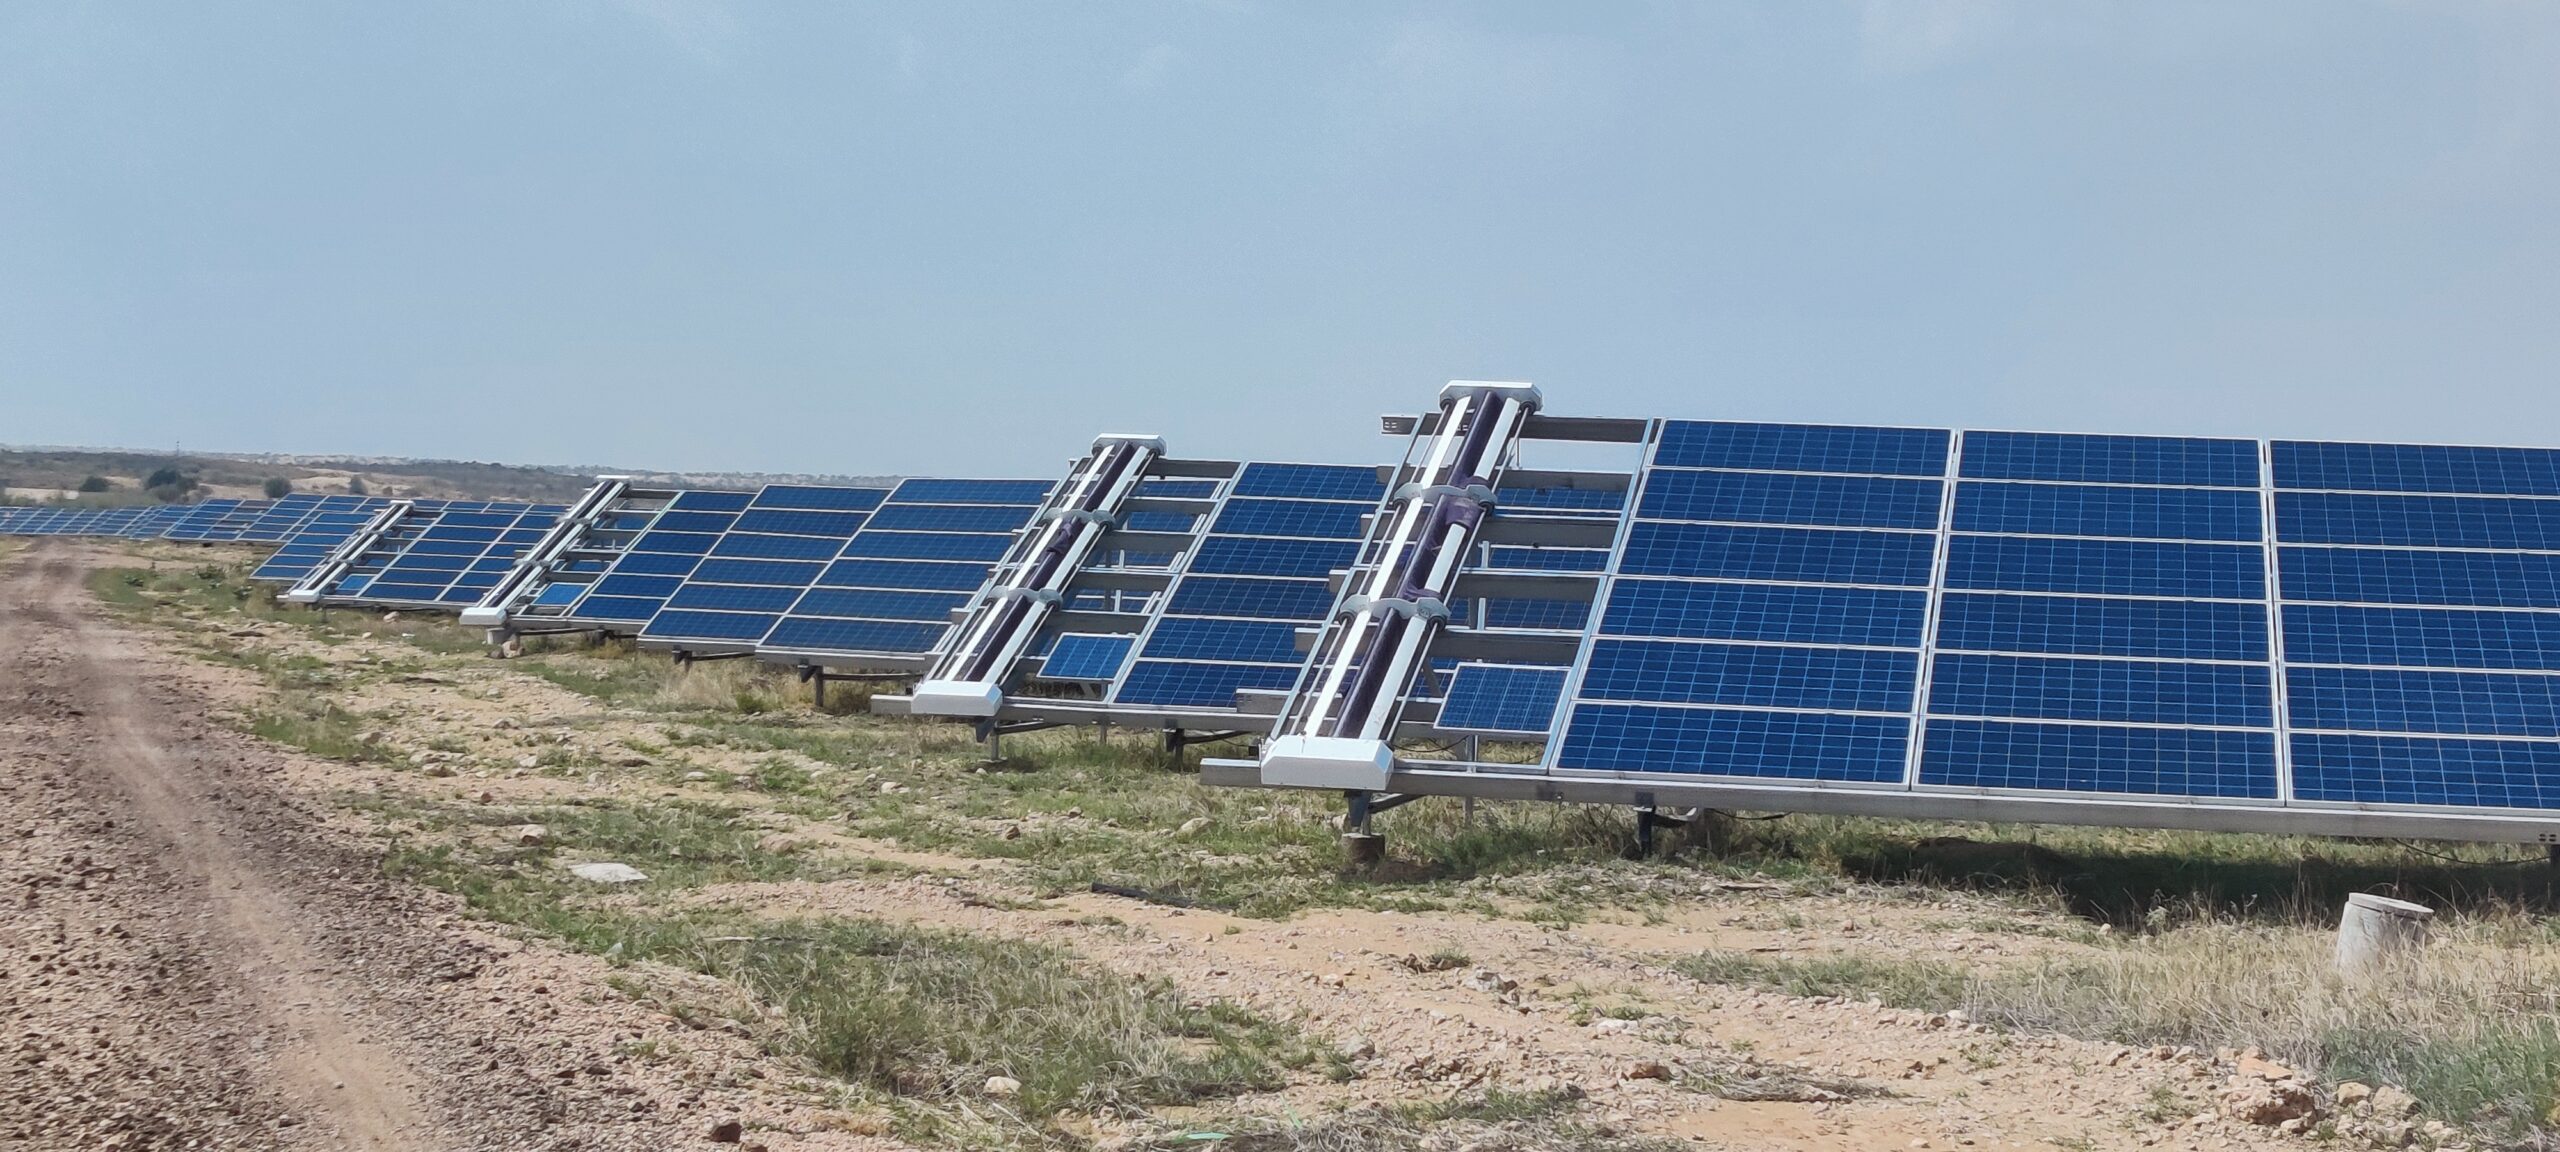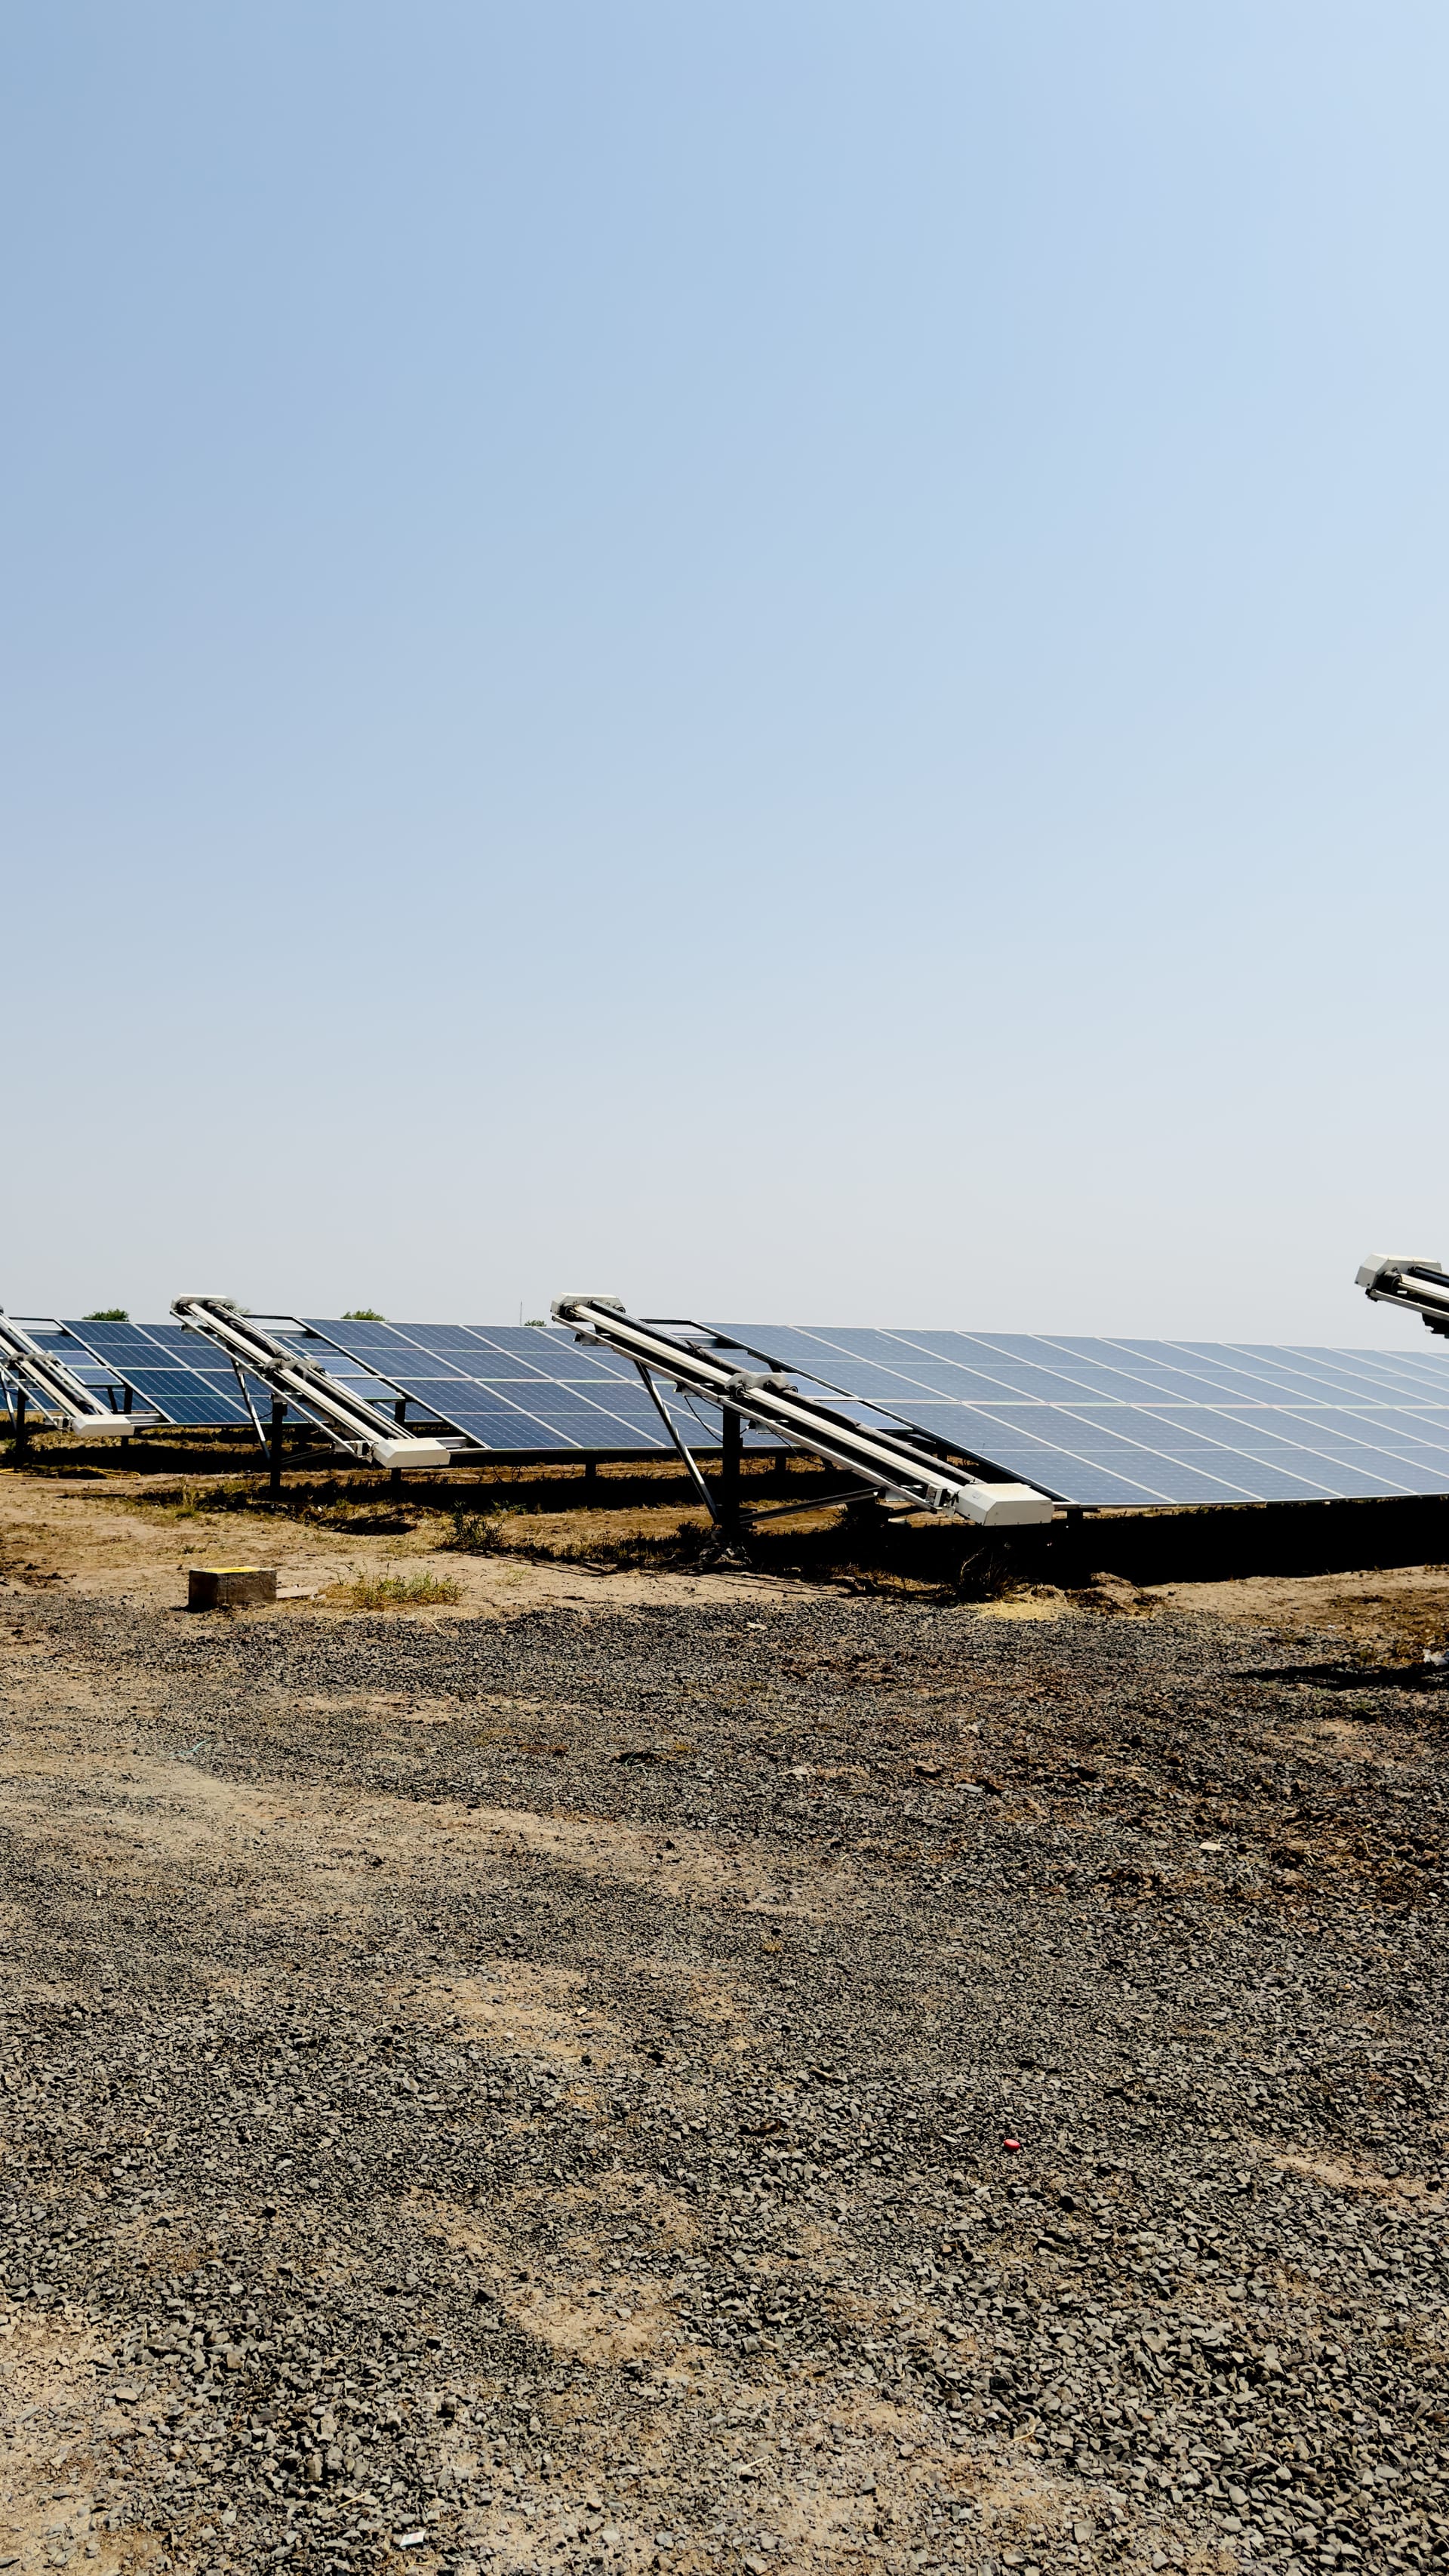
To implement an IoT sensor network effectively on a 5MW+ utility-scale plant, managers must move beyond treating cleaning as a periodic task and instead integrate real-time environmental telemetry with plant SCADA systems. This involves deploying a synchronized stack of pyranometers, soiling stations, and humidity sensors to establish data-driven cleaning triggers based on specific soiling thresholds (%) rather than fixed calendar dates.
For Indian utility plants, especially in arid zones like Rajasthan or Gujarat, the goal is to minimize the 10-25% energy loss typically caused by heavy soiling by aligning cleaning cycles with actual performance degradation. By using IoT sensors beyond cleaning robots, operators can automate decision-making, ensuring that waterless or manual cleaning occurs only when the cost of soiling exceeds the cost of the cleaning intervention.
The 25MW Rajasthan site: When data gaps lead to PR drift
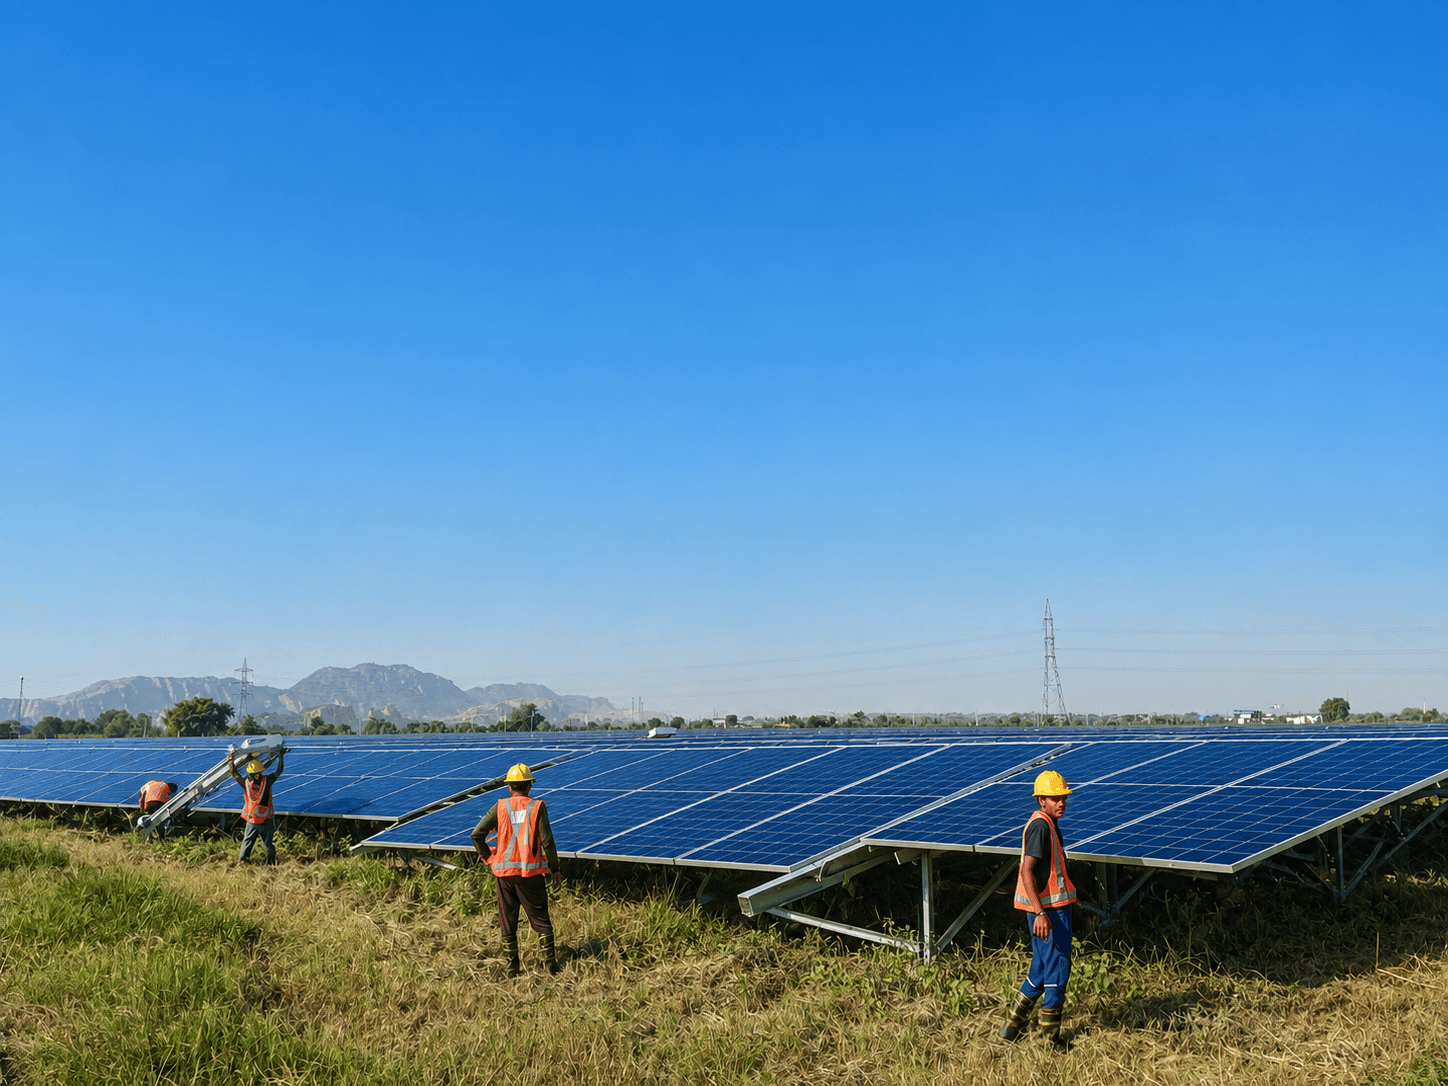
Consider a typical 25MW utility-scale project located in the high-dust corridors of Rajasthan. Without a dedicated IoT sensor stack, plant managers often rely on manual inspections or fixed monthly cleaning schedules. This creates a dangerous 'data gap' where soiling levels can spike within a single week due to local wind events or sandstorms, leading to significant Performance Ratio (PR) drift before the next scheduled cycle.
In these scenarios, the gap between actual module cleanliness and the scheduled cleaning date results in cumulative energy losses. If a site experiences a sudden dust event, the power output may drop by 15% or more almost immediately. If the O&M team is unaware of this specific event because they lack real-time soiling telemetry, the plant may operate at sub-optimal levels for days, directly impacting the PPA (Power Purchase Agreement) revenue and the overall asset value.
Relying solely on inverter-based monitoring is insufficient for precision O&M. While inverters show a drop in power, they cannot distinguish between a localized soiling issue, an inverter fault, or shading. Integrating soiling mitigation strategies through a network of IoT sensors allows the operator to confirm that the drop is indeed due to dust, enabling a rapid, targeted cleaning response that protects the long-term PR of the facility.
Defining the IoT stack: Sensors beyond cleaning robots
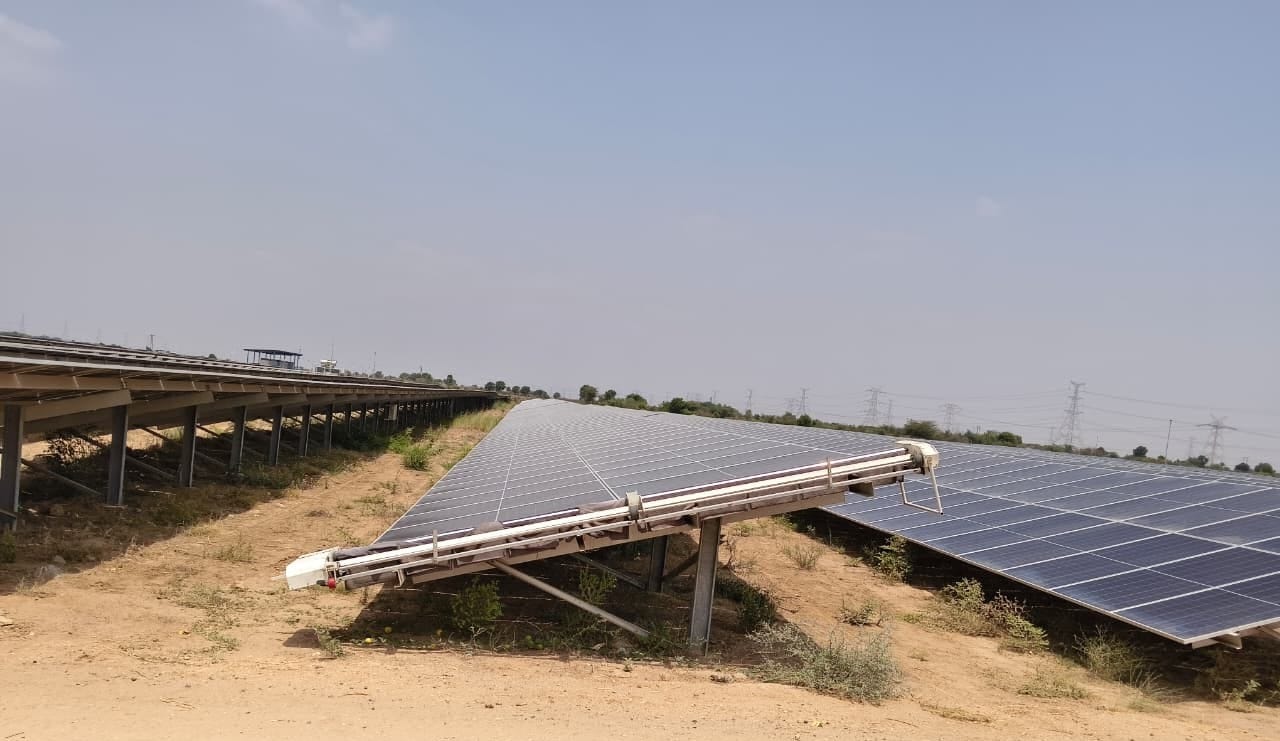
An effective IoT monitoring stack for utility-scale solar must transition from simple data collection to actionable performance intelligence. A robust 5MW+ site configuration requires the strategic placement of localized sensors that communicate directly with the plant SCADA system. Beyond generic weather forecasting, operators need granular data to justify site-wide maintenance interventions.
To build a high-fidelity monitoring architecture, integrate the following specific hardware components into your existing plant infrastructure:
- Reference Cell / Pyranometers: Install at least one high-precision pyranometer per 5MW block to measure Plane of Array (POA) irradiance. This provides the baseline for calculating the expected versus actual power output, which is the first step in identifying soiling losses.
- Soiling Ratio Stations: Place dedicated soiling monitoring stations in areas prone to dust accumulation. These stations typically feature one clean reference module and one uncleaned module, allowing for a real-time, side-by-side comparison of the soiling ratio (SR).
- Ambient Humidity & Temperature Sensors: Use these to correlate environmental moisture with dust adhesion rates. In humid Indian coastal zones, high humidity often cements fine dust into hard-to-clean layers, significantly altering your cleaning intervention threshold.
- Wind Speed & Direction Anemometers: Deploy these to track dust transport patterns. High wind events are primary drivers of rapid soiling in Rajasthan and Gujarat, and correlating wind direction with performance drops allows for predictive cleaning before the next peak generation period.
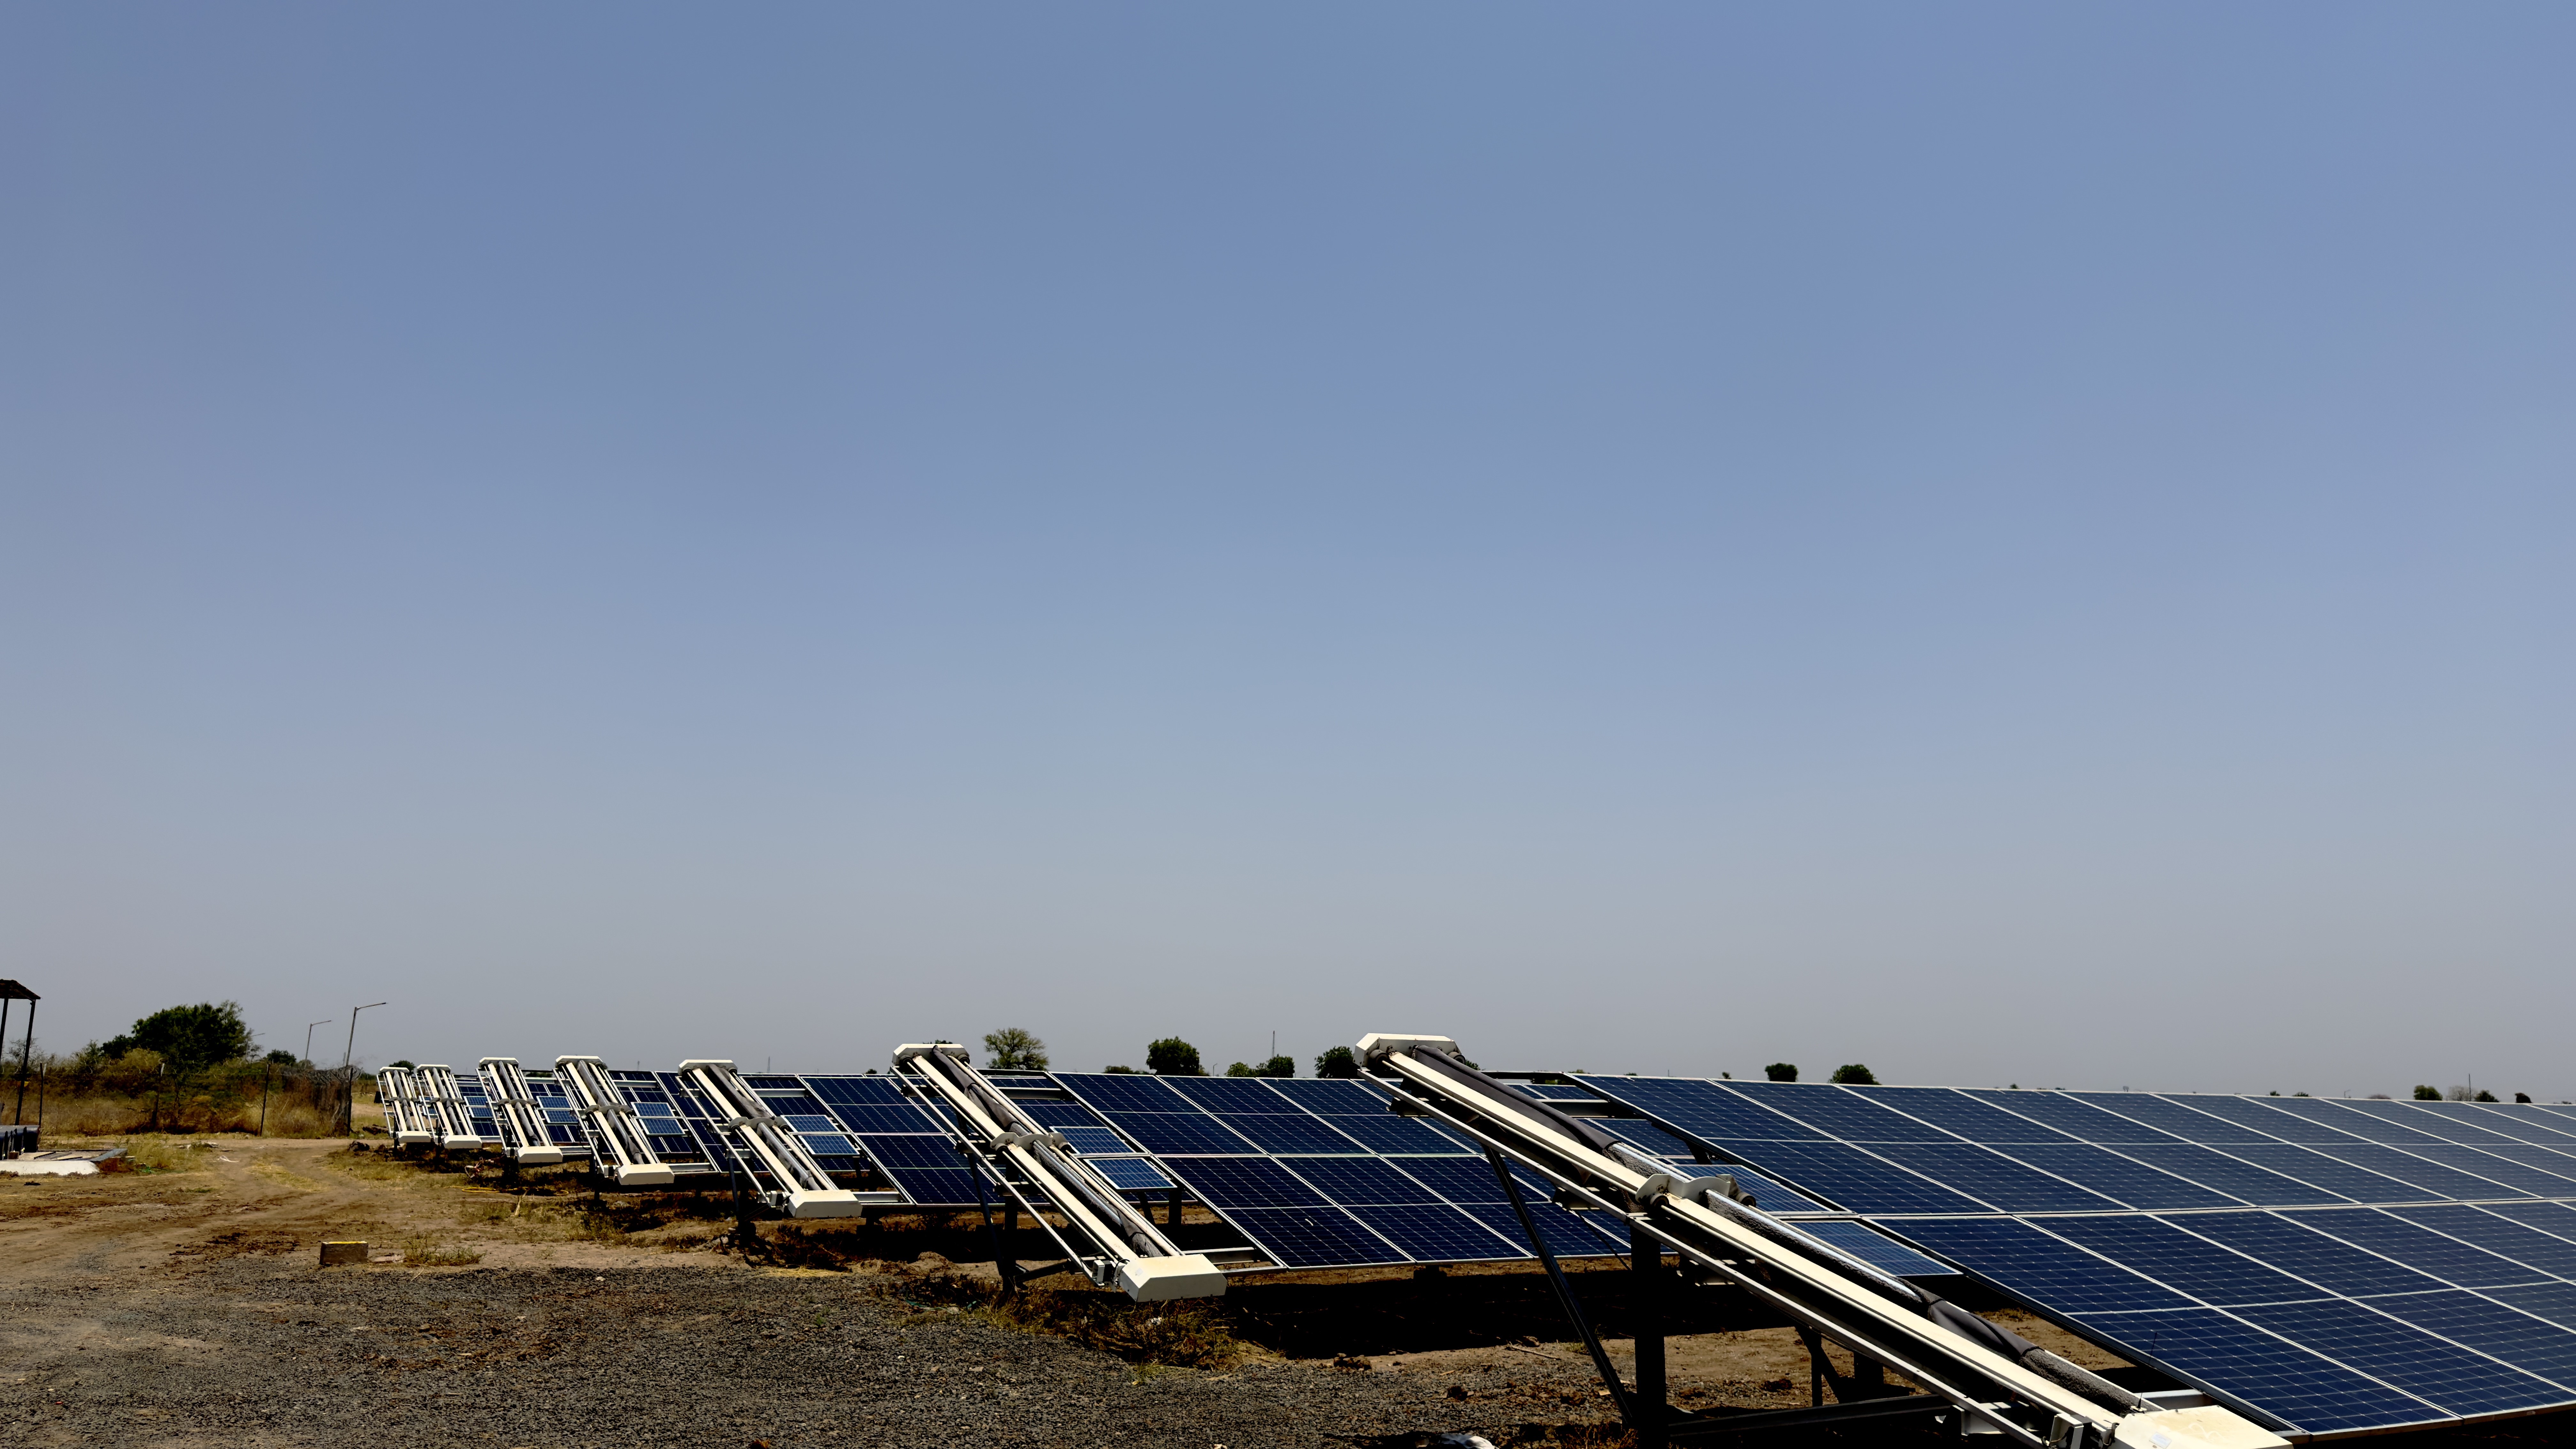
By connecting these sensors via industrial-grade gateways to your SCADA, you shift from calendar-based maintenance to a data-driven model. This prevents the unnecessary wear caused by over-cleaning and ensures that cleaning resources, whether robotic or manual, are deployed only when the performance loss exceeds the target threshold. For deeper insights on managing these resources, refer to our guide on automatic solar panel cleaning systems, which outlines how to scale these automated workflows effectively across 50MW+ utility portfolios.
Step-by-step: Integrating environmental sensors with plant SCADA
Integrating a high-fidelity monitoring network requires careful coordination to ensure data flows reliably into your existing SCADA or plant-level SCADA controller. On 5MW+ utility sites, the goal is to standardize data ingestion so your O&M team can trigger maintenance without manual verification.
- Define communication protocols: Ensure your sensors support RS485 or Modbus RTU, which are the industry standards for solar plant hardware. This allows for direct daisy-chaining across the site blocks to reduce cabling costs.
- Establish the data gateway: Use an industrial-grade data logger to aggregate signals from your pyranometers, soiling stations, and anemometers. This gateway acts as the bridge between raw environmental telemetry and your centralized control software.
- Map inputs to SCADA variables: Configure your SCADA mapping tables to store incoming sensor data as specific tags, such as 'POA_Irradiance_Block1' or 'Soiling_Ratio_Station_A'. Standardizing these tags allows for seamless integration with automated fleet monitoring software to automate cleaning triggers.
- Time-syncing and polling rates: Set a consistent polling rate across all sensors. For most utility-scale plants in India, a 1-minute to 5-minute sampling interval provides sufficient granularity for detecting dust events without overloading the network bandwidth.
- Validate data integrity: Perform a baseline test by cross-referencing your pyranometer data with the nearest meteorological forecast station. If the variance between your localized sensors and the regional data exceeds 5% on a clear day, recalibrate the sensors to ensure your performance calculations remain accurate.
Once integrated, the SCADA system can compare the actual output against the theoretical yield calculated from the pyranometer and humidity data. This precise calibration ensures your O&M workflows stay focused on objective performance losses rather than subjective observations, directly supporting the automatic solar panel cleaning systems used across modern 50MW+ utility portfolios.
Establishing critical thresholds for soiling and humidity in India
For utility-scale solar projects operating in arid regions like Rajasthan or the semi-arid plains of Gujarat, waiting for a fixed calendar cleaning date is a financial liability. Instead, plant managers must define automated soiling thresholds that trigger maintenance only when the revenue loss from efficiency degradation exceeds the cost of the cleaning operation. Industry-typical soiling losses often track between 10% and 25% in high-dust corridors, where localized humidity can further bake dust onto panel surfaces, creating stubborn, calcified layers that simple light rain cannot remove.
Defining performance triggers
- The 3% PR variance threshold: If your plant performance ratio (PR) deviates by more than 3% from the expected theoretical yield, after adjusting for current ambient temperature and irradiance, the soiling station should flag a high-priority cleaning event.
- Soiling Ratio (SR) limits: Use site-specific soiling stations to maintain an SR above 0.95. If the SR drops below 0.92, current operational costs for cleaning, whether via automatic solar panel cleaning systems or manual teams, are offset by the recovered energy gain within 3 to 7 days.
- Humidity correlation: When humidity rises above 60% during periods of high airborne particulate, you should proactively schedule cleaning before the next peak irradiance window. High-humidity environments transform dry dust into an adhesive slurry, which can increase cleaning energy requirements and potentially damage anti-reflective coatings if mechanical brushes are used incorrectly.
By digitizing these thresholds, you eliminate the subjectivity of visual inspection. The goal is to move beyond mere robot deployment and manage your O&M strategy through clear, data-backed operational triggers that scale across your 50 MW+ site portfolio. Consistent adherence to these thresholds ensures that your long-term maintenance expenses stay predictable, protecting the project internal rate of return against the unpredictable nature of regional dust accumulation.
How do IoT sensors improve Performance Ratio (PR) accuracy?
IoT sensors improve Performance Ratio (PR) accuracy by replacing estimated regional weather data with real-time, site-specific measurements of irradiance and temperature. This precision allows plant managers to distinguish between actual energy losses caused by soiling and mathematical errors caused by inaccurate meteorological inputs.
Standard PR calculations often rely on satellite data or regional weather stations. These sources can miss localized microclimates or sudden dust clouds in arid zones like Rajasthan. By installing high-precision pyranometers directly within the 5MW+ plant, operators obtain the exact solar irradiance hitting the modules. Without this localized data, a plant might appear to be underperforming. In reality, it may simply be experiencing a mismatch between regional forecasts and local conditions.
Temperature also plays a critical role. As module temperatures rise, efficiency drops based on the manufacturer's temperature coefficient. If your SCADA system relies on ambient air temperature rather than actual module-surface temperature sensors, your PR will be fundamentally flawed. Real-time IoT temperature sensors provide the data needed to normalize yield. This prevents a hot afternoon from being mistaken for a soiling event.
Integrating these sensors enables a more sophisticated O&M strategy through the following data triangulations:
- Irradiance vs. Yield: Confirming that energy drops are truly due to module surface conditions rather than cloud shading or localized dust.
- Temperature Normalization: Correcting the expected output based on actual thermal loads to prevent false alarms in the SCADA system.
- Soiling Coefficient Calculation: Using the ratio of clean-state irradiance to current-state irradiance to quantify the exact impact of dust.
Ultimately, these sensors transform automatic solar panel cleaning systems from simple scheduled tools into reactive, intelligence-driven assets. You are no longer cleaning on a whim; you are cleaning to recover specific, measurable units of energy.
Managing data-driven cleaning cycles: A technical workflow
For a 5MW+ utility site, shifting from calendar-based cleaning to an IoT-driven model requires a standardized technical workflow. By integrating real-time sensor data from your soiling stations directly into your SCADA system, you can automate the trigger mechanism for your robot fleet. This ensures that cleaning cycles are performed only when the yield loss exceeds the cost of energy spent on operation, effectively protecting your project internal rate of return.
To implement this on your plant, follow this technical sequence for deploying sensors and syncing your cleaning schedule:
- Step 1: Baseline Calibration: Install a high-precision pyranometer on a clean reference panel and a second pyranometer on a soiling-accumulation panel. The difference between these two readings provides the raw data for your soiling loss percentage calculation.
- Step 2: Threshold Definition: Set an alert in your SCADA or fleet software for a 3% to 5% drop in Performance Ratio (PR). In arid Indian zones, this typically occurs within 7 to 10 days of the last cleaning cycle.
- Step 3: Humidity and Particulate Logic: Integrate your humidity sensors to create a blocking rule. If humidity exceeds 60% with high airborne dust levels, disable automatic robotic cycles to prevent the formation of mud or slurry on module glass, which is harder to remove and can cause streaks.
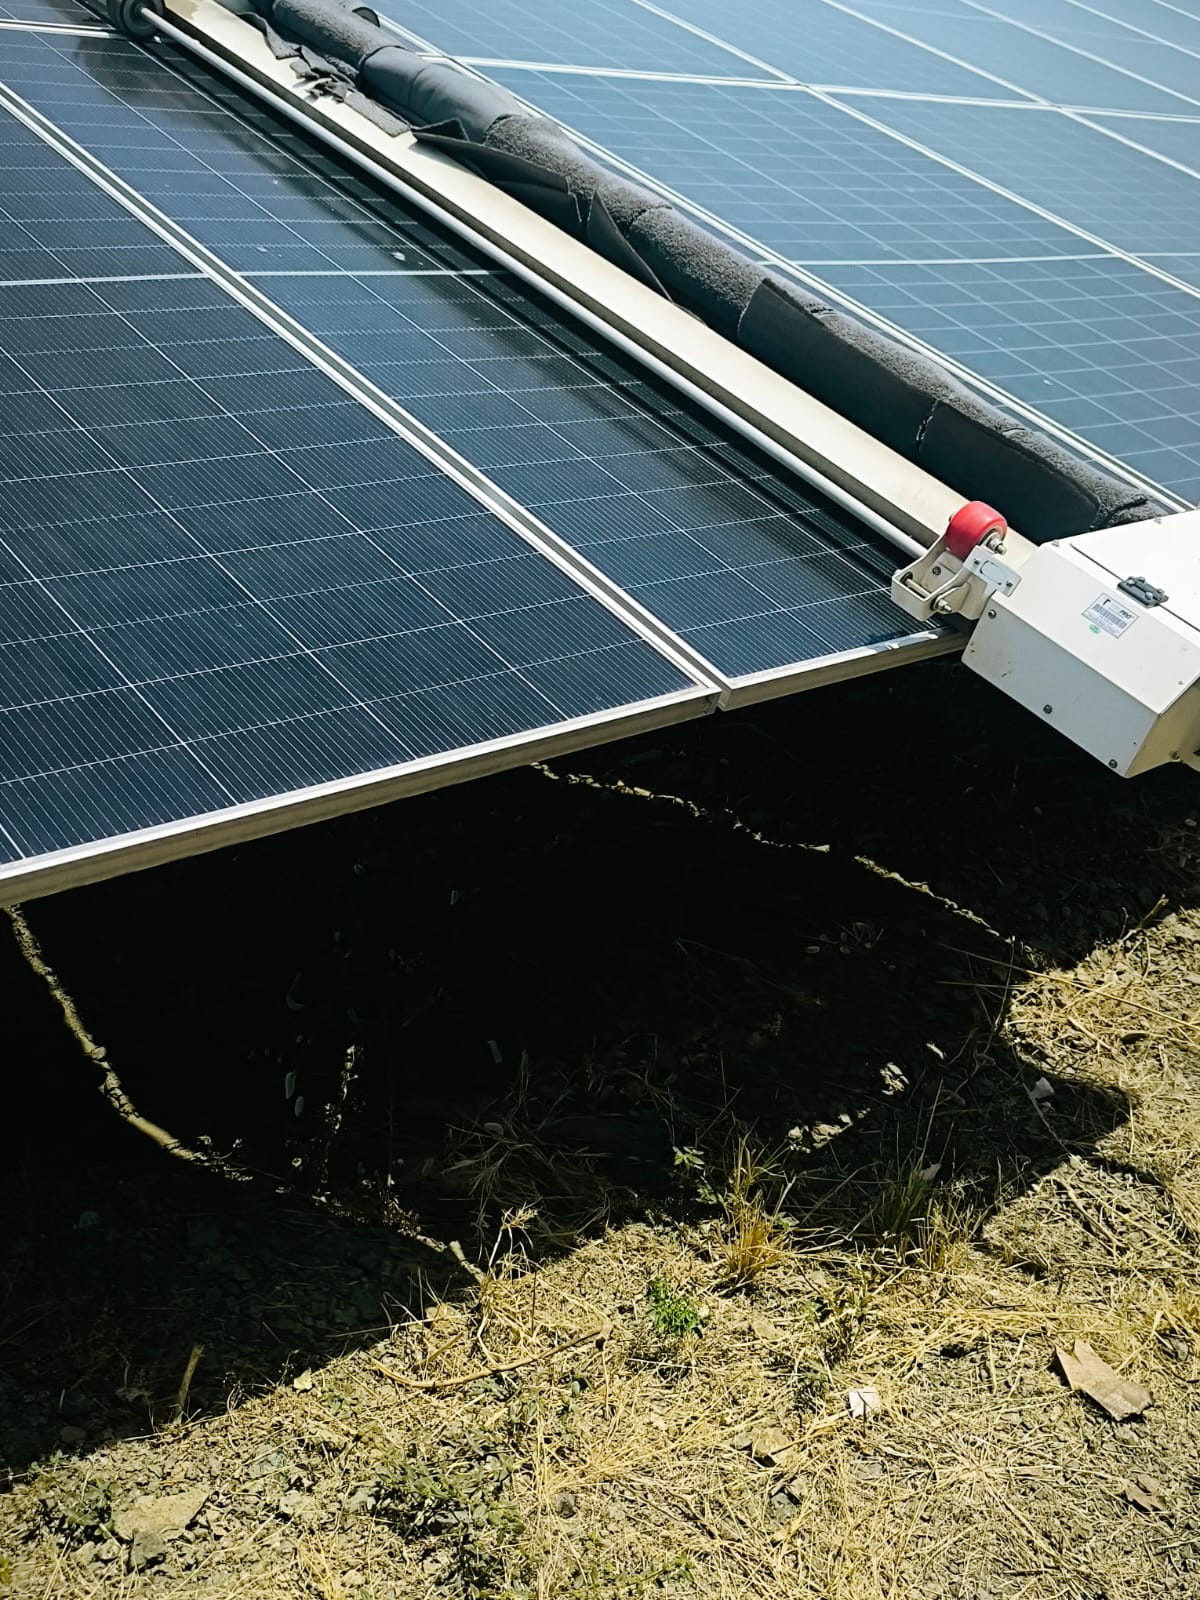
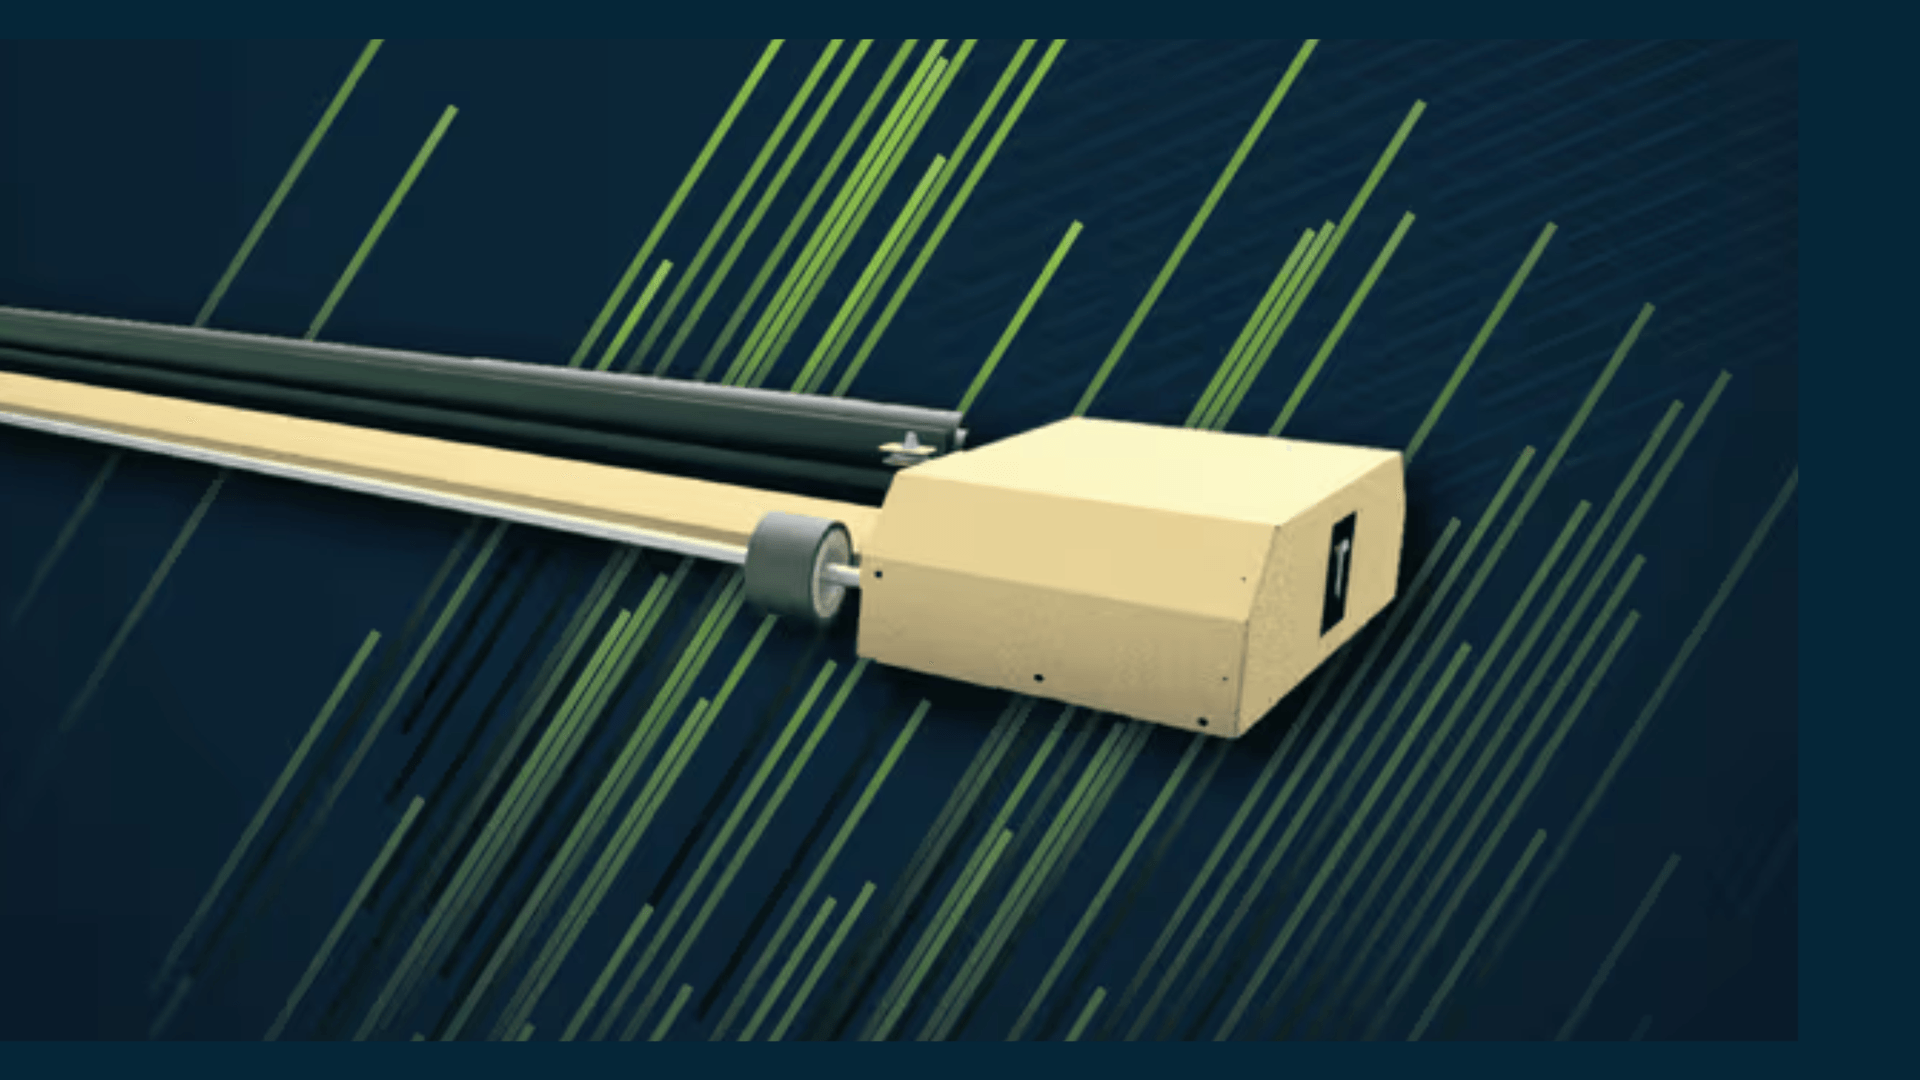
- Step 4: Automated Dispatch: Sync your cleaning robots, such as the GLYDE or NYUMA series, with the SCADA trigger. Once the soiling threshold is breached and humidity is within the safe operational range, the NECTYR fleet portal or your local controller initiates the cleaning sequence automatically.
- Step 5: Post-Cleaning Validation: Post-cycle, the system should log the irradiance levels again to verify that the PR has returned to the expected baseline. If the recovery is below 95% of the theoretical maximum, trigger an automatic site inspection ticket for your O&M team.
By moving beyond manual guesses and adopting this data-led approach, you optimize the lifespan of your robotic hardware and ensure the highest possible output from your automatic solar panel cleaning system. This workflow not only prevents premature wear on brushes but also ensures that every kilowatt-hour saved is tracked and verified against your overall plant O&M budget.
Common integration pitfalls in utility-scale deployments
Integrating environmental sensors into existing utility-scale SCADA requires more than just physical installation. Many operators fail to account for the unique electrical and environmental noise inherent in large-scale PV plants. In arid Indian zones like Rajasthan, high electromagnetic interference from inverters can cause faulty readings if sensor cables are not shielded and grounded according to international standards. Ensure that your pyranometers and soiling sensors are routed through dedicated conduits to prevent crosstalk with DC and AC power lines.
Another common mistake is site selection. Placing a soiling station in a sheltered area, such as near an office block or a maintenance shed, yields data that does not represent the reality of your array rows. Sensors must be placed on the leading edge of a typical tracker or fixed-tilt row to capture dust accumulation accurately. A misplaced sensor often reports lower soiling levels than the rest of the site, leading to delayed cleaning triggers and significant energy yield loss.
Finally, data synchronization remains a frequent pain point for asset managers. Raw sensor data is meaningless without context from the plant controller. Ensure that your IoT stack is configured to log temperature, irradiance, and dust accumulation at the same frequency as your inverter string data. Discrepancies in time-stamping between sensors and inverters can make it impossible to isolate soiling losses from inverter clipping or thermal derating during peak summer months. Consistent data tagging is the bedrock of a successful automatic solar panel cleaning system implementation.
What plant managers should do next
- Conduct a site-wide sensor audit to verify that existing pyranometers are calibrated and positioned at the optimal orientation for your array tilt.
- Define your site-specific soiling thresholds for PR recovery, targeting the 3% to 5% range for high-efficiency, waterless cleaning cycles.
- Integrate your IoT sensor network with your fleet monitoring platform, such as the NECTYR portal, to ensure seamless communication between your data layer and your robotic hardware.
- Schedule a baseline PR analysis to determine if current soiling losses justify the integration of an autonomous cleaning fleet or if a phased deployment is more appropriate for your portfolio.
Sources and further reading
Frequently asked questions
Using IoT sensors beyond cleaning robots allows operators to automate decision-making by aligning cleaning cycles with actual performance degradation. This ensures that cleaning occurs only when the cost of soiling exceeds the cost of the cleaning intervention, which helps minimize energy losses.
An effective IoT stack for utility-scale plants in India should include a synchronized deployment of pyranometers, soiling stations, and humidity sensors to establish real-time environmental telemetry.
In high-dust corridors, IoT sensors prevent Performance Ratio (PR) drift by closing the data gap caused by sudden wind events or sandstorms. This allows for a rapid, targeted cleaning response instead of relying on inefficient, fixed monthly schedules.
While inverters can indicate a drop in power, they cannot distinguish whether the cause is a localized soiling issue, an inverter fault, or shading. Integrating an IoT sensor network allows operators to confirm if the power drop is specifically due to dust.