Managing a ppa generation guarantee soiling strategy is not about cleaning panels when they look dirty; it is about managing a mathematical threshold of energy yield. For Indian utility operators, the gap between predicted and actual generation is often a result of aggressive soiling rates that outpace manual cleaning cycles, leading to contractual penalties and lost revenue.
To maintain compliance, plant managers must move from reactive cleaning to a technical schedule based on Performance Ratio (PR) triggers and regional dust profiles. By aligning cleaning frequency with the specific generation guarantees of the PPA, operators can protect their margins from the volatile soiling conditions typical of the Indian landscape.
Summary for plant managers
- Typical daily soiling loss in India: 0.3% to 0.5%, which can lead to a total generation loss of 15% to 35% if panels are left uncleaned for 30 days.
- Cleaning Trigger: Initiate cleaning cycles when the Performance Ratio (PR) drops by 2% to 5%, or upon reaching a 7-day limit in high-dust zones like Rajasthan and Gujarat.
- Critical Risk: Use of high-TDS groundwater in Western India can cause "white haze" scaling, resulting in a permanent output drop of 10% to 15%.
- Regulatory Deadline: Stricter deviation charges for unscheduled electricity supply are set for implementation by April 2027, making generation predictability a financial necessity.
Linking PPA Generation Guarantees to Soiling Losses
In most utility-scale Power Purchase Agreements (PPAs) in India, the developer guarantees a minimum amount of energy generation or a specific Performance Ratio (PR). When a plant fails to meet these benchmarks, the operator faces liquidated damages or reduced payments. Soiling is the most volatile variable in this equation because, unlike inverter degradation or panel aging, it is an external operational factor that can be controlled through a disciplined cleaning schedule.
The link between soiling and PPA guarantees functions through three primary levers:
1. The PR Erosion Cycle
Performance Ratio is the primary metric used to determine if a plant is operating as designed. As dust, pollen, and industrial pollutants accumulate, the effective irradiance reaching the cells drops, causing a direct decline in PR. In high-dust regions of Western India, daily soiling loss rates can reach 0.47%, meaning that a delay in the cleaning schedule of just two weeks can push a plant below its guaranteed PR threshold. This is why understanding Performance Ratio losses in Indian utility plants is critical for triage; operators must distinguish between "soft losses" (like soiling) and hardware failures to avoid unnecessary technician deployments.
2. Scheduled vs. Actual Generation Gap
PPAs often require a daily or monthly generation schedule. When soiling is ignored, the "Actual Generation" falls behind the "Scheduled Generation." While a 1% drop might seem negligible on a single string, the cumulative effect on a 100 MW plant is massive. At a typical PPA rate of ₹3.0 to 4.0 per kWh, a 5% generation loss due to soiling during peak summer months can result in losses of several lakhs of rupees per day.
3. The "Cementation" Effect and Permanent Loss
The risk to PPA guarantees increases when soiling is left too long. In many Indian states, morning dew mixes with accumulated dust to create a "cemented" layer of grime. If this is not removed via regular cycles, the dirt becomes chemically bonded to the glass. This requires aggressive cleaning, which increases the risk of micro-cracks or abrasive damage, potentially voiding module warranties and causing a permanent dip in the plant's generation capacity.
For operators managing large portfolios, the challenge is that manual labor is often inconsistent. Relying on manual brush cleaning at a 50 MW+ scale frequently leads to "spotty" cleaning, where some blocks are pristine and others remain soiled. This variance creates unstable PR signatures, making it difficult to report accurate quarterly performance data to the MNRE and increasing the risk of failing PPA audits.
Managing Soiling Thresholds: When to Trigger a Cleaning Cycle
For a utility-scale plant manager, cleaning based on visual inspection is an operational failure. To protect PPA generation guarantees, the decision to clean must be driven by a "trigger threshold" based on real-time Performance Ratio (PR) data. The goal is to find the equilibrium point where the cost of the cleaning cycle is lower than the revenue lost to soiling.
In the Indian context, soiling is not linear. According to CEEW data, the average daily soiling loss rate ranges from 0.3% to 0.5%. However, during pre-monsoon months in arid regions, this can spike. If a plant is left uncleaned for 30 days, the generation output loss can swing between 15% and 35%, which almost certainly triggers PPA penalties.
To prevent this, operators should implement a tiered trigger system based on the local environment:
| Environment Type | Typical Daily Loss | PR Drop Trigger | Maximum Cycle Gap |
|---|---|---|---|
| High-Dust (Rajasthan, Gujarat) | 0.4% to 0.5% | 2% to 3% | 7 Days |
| Moderate-Dust (Central India) | 0.2% to 0.3% | 3% to 5% | 14 Days |
| Low-Dust / Coastal (South India) | <0.2% | 5% | 21 to 30 Days |
The most effective way to manage these thresholds is through a "Clean-vs-Soiled" string comparison. By maintaining a few "control strings" that are cleaned daily, operators can measure the delta between the cleaned output and the rest of the plant. When this delta exceeds the 2% to 5% threshold, a full-site cleaning cycle is initiated. However, executing this at a MW-scale requires precise telemetry. Without integrated logs, it is impossible to audit whether a PR drop was caused by soiling or a failing inverter. This is why real-time robot-to-control-room connectivity is essential, as it allows managers to correlate cleaning timestamps directly with PR recovery spikes in the SCADA system.
Regional Scheduling Zoning for Indian Utility Plants
A single cleaning schedule cannot be applied across a pan-India portfolio. The variance in particulate matter, humidity, and water quality necessitates a "zoning" approach to O&M. Failure to zone schedules often leads to over-cleaning in the South (wasting OPEX) and under-cleaning in the West (missing PPA guarantees).
The Dry Belt: Rajasthan, Gujarat, and Uttar Pradesh
In the Dry Belt, soiling is dominated by inorganic mineral dust and high wind-borne particulates. In these zones, the "cementation" effect is a primary risk, where morning dew binds dust to the glass. In these regions, weekly cleaning baselines are the industry standard. Because water scarcity is acute, the shift toward waterless solar panel cleaning systems is no longer optional, it is a strategic necessity to maintain the PPA yield without depleting local aquifers.
The Southern Plateaus and Coastal Belts: Karnataka, Tamil Nadu, and Andhra Pradesh
Southern plants face a different soiling profile, often characterized by organic matter, pollen, and saline deposits in coastal areas. While the frequency of cleaning is lower (often monthly), the "stickiness" of the soiling can be higher. Rain events in these regions can provide a partial clean, but they often leave "streak patterns" that can create localized hotspots if not followed by a professional cleaning cycle.
The High-TDS Water Risk in Western India
One of the most critical technical risks to PPA guarantees is the use of groundwater in the industrial belts of Gujarat and Rajasthan. Much of this water has extremely high Total Dissolved Solids (TDS). When water-based cleaning is used with high-TDS water, the water evaporates, leaving behind mineral salts that create a "white haze" or permanent scaling on the module glass.
This scaling is not a "soft loss" that can be wiped away; it is a physical alteration of the glass surface. Field reports from the CGWB indicate that this permanent scaling can cause a generation drop of 10% to 15%. Once this happens, the plant's theoretical maximum PR is lowered permanently, making it mathematically impossible to meet the original PPA guarantees regardless of how often the panels are cleaned. To mitigate this, plant managers in Western India are increasingly deploying autonomous waterless robots like the GLYDE or NYUMA series, which eliminate the risk of scaling by removing the water variable entirely from the equation.
How does soiling affect the Performance Ratio in PPA contracts?
Soiling affects the Performance Ratio (PR) by reducing the actual energy yield (kWh) relative to the theoretical yield that the plant would produce under clean-glass conditions. In most Indian utility-scale PPAs, the PR is a contractual KPI; if the plant's average PR falls below a guaranteed threshold (typically 75% to 82% depending on the site), the developer must pay liquidated damages or penalties for the under-generation.
From a technical standpoint, soiling creates a "soft loss" that directly suppresses the numerator of the PR equation. According to CEEW data, the average daily soiling loss rate in India ranges between 0.3% and 0.5%. While this may seem negligible on a day-to-day basis, the cumulative effect over a 30-day cycle without cleaning can result in generation losses of 15% to 35%. When these losses occur, the PR drops proportionally, often pushing the plant below its PPA guarantee threshold.
Unlike weather-related losses (cloud cover), which are typically excluded from PR calculations as "non-controllable," soiling is viewed as a controllable O&M variable. If a plant manager fails to execute a cleaning schedule and the PR dips, the resulting revenue loss is a direct hit to the bottom line. For a 100 MW plant operating at a PPA rate of ₹3.50 per kWh, a sustained 2% drop in PR can lead to millions in lost revenue annually. This is why precise PR triage and soft-loss identification are critical; operators must be able to distinguish between a PR drop caused by inverter clipping and one caused by dust accumulation to justify their O&M spend.
Technical Integration: Aligning Cleaning Logs with MNRE Compliance
For utility-scale assets in India, O&M is not just about maximizing yield, it is about documentation. MNRE RESCO guidelines mandate the submission of quarterly performance data, and for IPPs, these reports serve as the primary audit trail for PPA compliance. The technical challenge is that SCADA systems report *what* happened (e.g., a drop in PR), but they rarely report *why* it happened (e.g., a cleaning delay due to labor shortages or water scarcity).
To align cleaning schedules with compliance requirements, plant managers should implement a three-layer integration process:
- Timestamped Execution Logs: Every cleaning event must be logged with the exact date, time, and block coordinates. In manual cleaning, this is often a paper log prone to error. In automated systems, this is handled via telemetry. When a robot completes a row, a digital timestamp is generated, providing an immutable record of when the modules were returned to their baseline reflectivity.
- PR Recovery Correlation: The cleaning log should be overlaid onto the SCADA generation curve. A successful cleaning cycle should show a corresponding "PR spike" within 24 hours. If the log says the plant was cleaned but the PR did not recover, it indicates either an ineffective cleaning method (such as using high-TDS water that left a mineral film) or a mechanical failure in the cleaning equipment.
- Deviation Documentation: When extreme soiling events occur (e.g., a massive dust storm in Rajasthan), the cleaning logs serve as evidence for "Force Majeure" or exceptional event claims. By showing that the cleaning fleet was deployed immediately following the event, operators can argue that the generation dip was an unavoidable environmental impact rather than O&M negligence.
Achieving this level of granularity requires an integrated data layer. Relying on manual spreadsheets for a 50 MW+ site is no longer viable for MNRE audits. This is where real-time robot-to-control-room connectivity becomes a compliance tool. By using a fleet monitoring portal like NECTYR, managers can export automated reports that correlate cleaning frequency with generation recovery, transforming the cleaning schedule from a chore into a verifiable part of the plant's technical performance record.
Mitigating Permanent Generation Loss from High-TDS Water
While the immediate goal of a cleaning schedule is to remove dust and recover the Performance Ratio (PR), the method of cleaning can introduce a permanent risk to generation. In many Indian utility-scale belts, particularly in Gujarat and Rajasthan, groundwater is characterized by high Total Dissolved Solids (TDS). Using this water for wet cleaning creates a technical failure mode known as scaling, or the formation of a "white haze" on the module surface.
Scaling occurs when water evaporates from the module surface, leaving behind mineral deposits like calcium carbonate and magnesium sulfate. Unlike atmospheric dust, which is loose and easily removed, these mineral scales bond chemically to the glass. According to CGWB 2024 reports, this white haze can lead to a permanent output drop of 10% to 15% in Western Indian industrial belts if not managed. For a plant manager, this is a critical PPA risk because scaling is often categorized as an O&M failure rather than an environmental event, meaning the resulting generation loss cannot be excluded from PR calculations.
To mitigate this risk and protect long-term PPA generation guarantees, operators should adopt the following technical protocols:
- Water Quality Baseline: Before implementing any wet cleaning schedule, conduct a TDS analysis of the source water. If TDS levels exceed 500 ppm, standard wet cleaning is high-risk. If levels exceed 1,500 ppm, wet cleaning without pre-treatment is functionally detrimental to the asset.
- Demineralization (DM) Plants: For plants committed to wet cleaning, installing a DM or Reverse Osmosis (RO) plant is the only way to prevent scaling. However, this adds significant CAPEX and increases the O&M cost per MW, often making the process economically unviable at 100 MW+ scales.
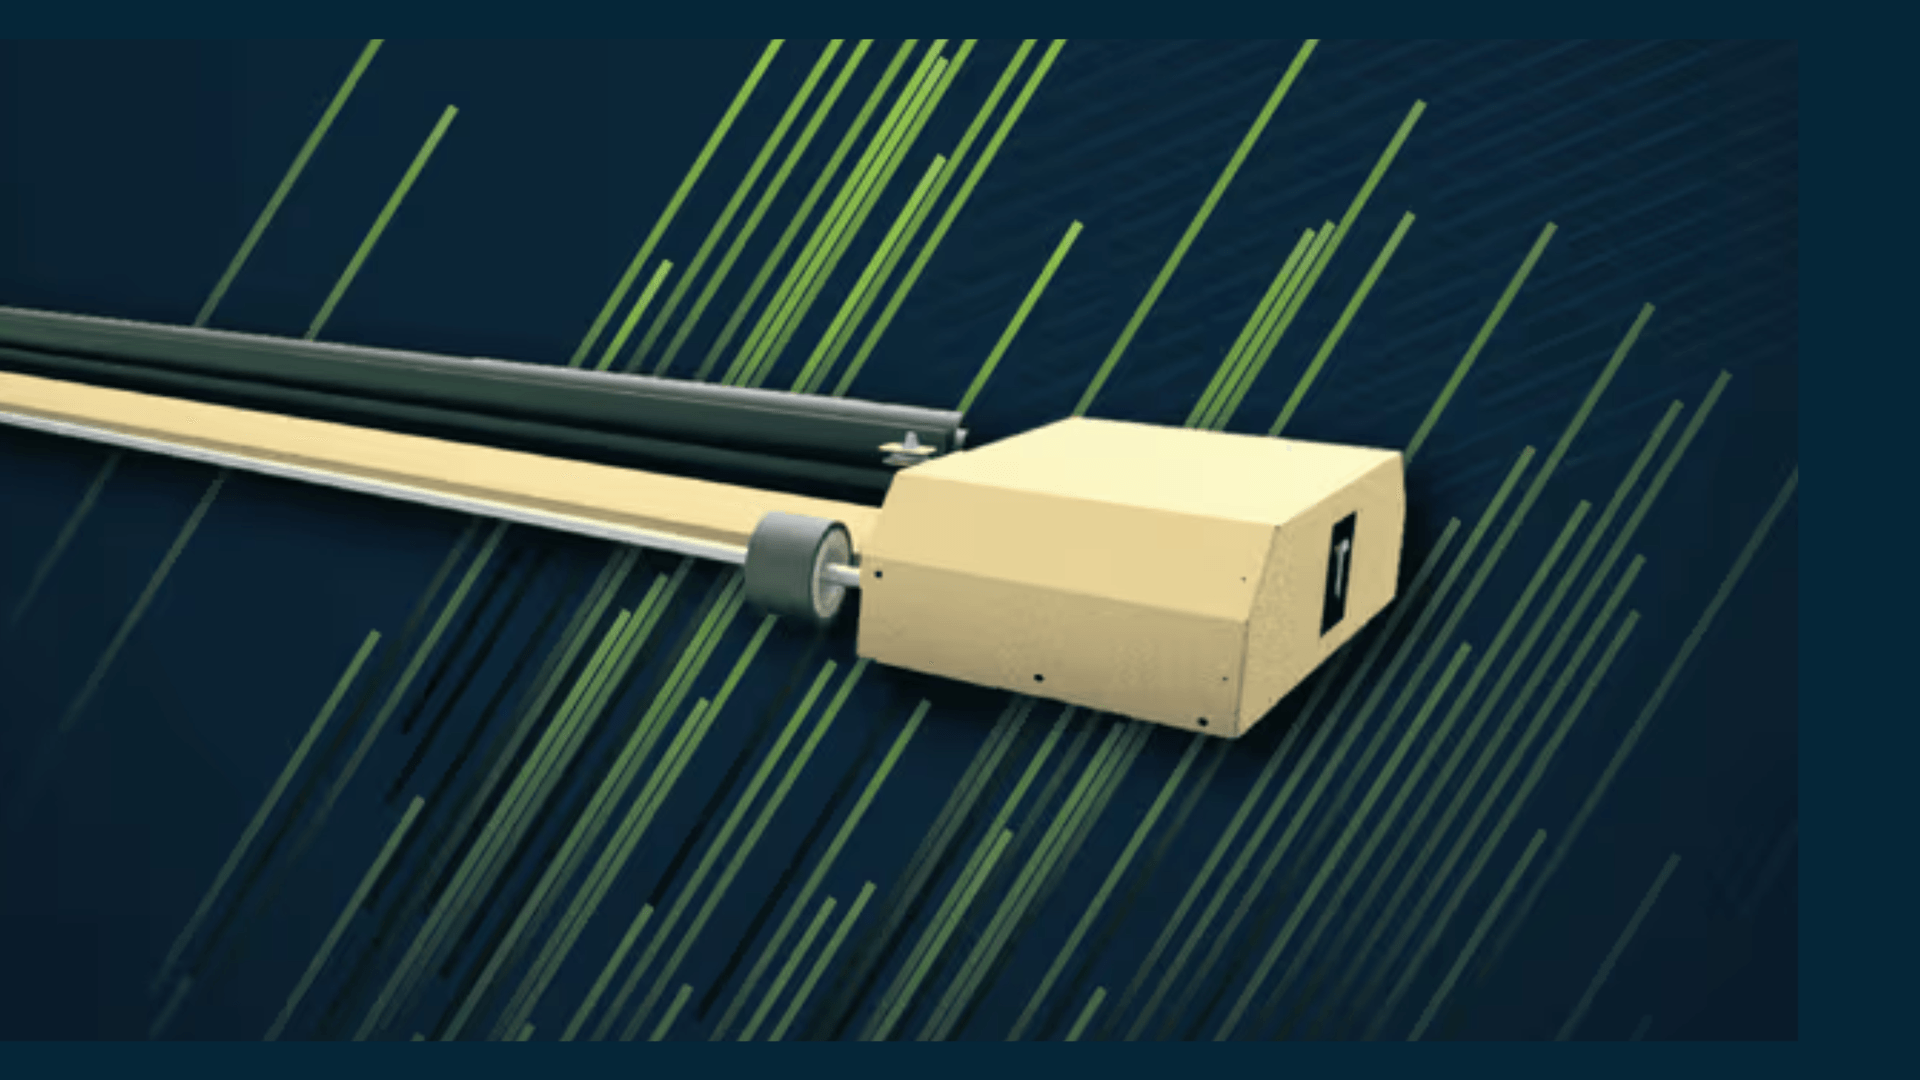
- Transition to Waterless Systems: The most effective way to eliminate scaling risk is to remove water from the equation entirely. Waterless robotic systems, such as the Taypro GLYDE or NYUMA lines, use microfiber and PBT brushes to remove soiling without leaving mineral residues. By eliminating the water-evaporation cycle, plant managers remove the possibility of permanent white haze, ensuring that the glass transmissivity remains at factory levels throughout the project lifecycle.
When comparing the TCO of wet cleaning (inclusive of DM plant maintenance and water sourcing) against waterless automation, the risk mitigation alone often justifies the shift. Avoiding a 10% permanent loss on a 100 MW plant is not just an operational win; it is a fundamental requirement for satisfying lender covenants and PPA guarantees over a 25-year horizon.
Key Takeaways for PPA Compliance
Managing the intersection of ppa generation guarantee soiling and cleaning schedules requires a shift from "calendar-based" cleaning to "performance-based" O&M. To ensure a plant remains compliant and avoids under-generation penalties, plant managers should implement these four strategic pillars:
- Define Hard Technical Thresholds: Stop cleaning on a fixed date. Instead, trigger cleaning cycles based on a specific PR drop (typically 1% to 3%) or a maximum day count (e.g., 7 days in the Dry Belt, 21 days in the Southern Plateaus). This ensures O&M spend is correlated directly to revenue recovery.
- Implement Regional Zoning: Recognize that a single schedule cannot cover a pan-India portfolio. Rajasthan and Gujarat require aggressive, weekly baselines due to higher daily soiling rates (up to 0.47%), while Southern assets can shift toward monthly cadences, reducing wear and tear on equipment.
- Digitize the Audit Trail: Move away from manual logs. Use fleet telemetry and monitoring tools like NECTYR to create timestamped, coordinate-mapped records of every cleaning event. This provides the necessary evidence for MNRE quarterly reporting and protects the IPP during PPA audits.
- Eliminate Scaling Risks: In high-TDS regions, prioritize waterless cleaning technologies. Protecting the module glass from permanent mineral scaling is the only way to ensure that the theoretical generation modeled at financial close remains achievable in year 10 and beyond.
By integrating these technical thresholds with autonomous execution and rigorous documentation, utility operators can transform cleaning from a variable cost into a predictable tool for PPA guarantee management.
Frequently asked questions
Typical daily soiling loss in India: 0. 3% to 0.
In high-dust zones like Rajasthan and Gujarat, operators should initiate cleaning cycles when the Performance Ratio (PR) drops by 2% to 5%. To avoid significant generation gaps, a strict 7-day cleaning limit should be implemented. This technical approach ensures the plant meets its guaranteed energy yield despite volatile regional dust profiles.
Using high-TDS groundwater in Western India poses a critical risk. It can cause white haze scaling on the panels, leading to a permanent output drop of 10% to 15%. This permanent degradation can make it mathematically impossible to meet PPA generation guarantees, regardless of subsequent cleaning efforts, thereby risking the project's financial viability.
Operators must shift from reactive cleaning to technical schedules based on PR triggers to ensure generation predictability. This is increasingly critical because stricter deviation charges for unscheduled electricity supply are set for implementation by April 2027. Maintaining a disciplined cleaning schedule protects margins and prevents financial penalties related to these upcoming regulatory deadlines.