Summary for plant managers: Balancing CAPEX and lifetime OPEX
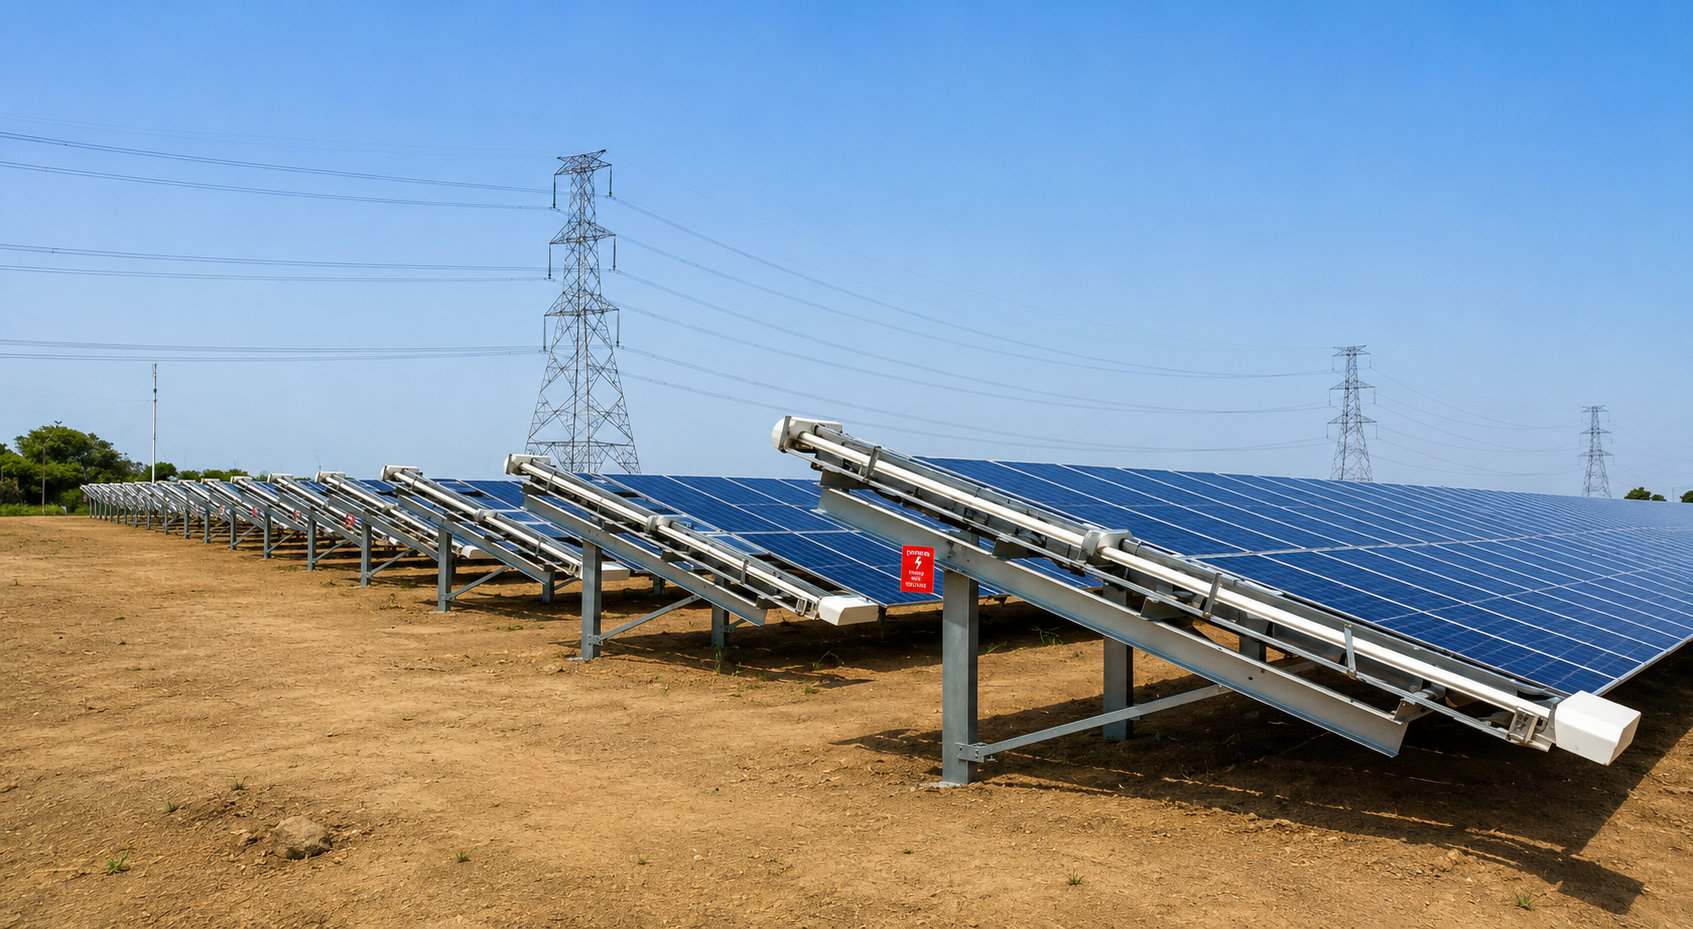
For utility-scale solar asset owners in India, the total cost of ownership is defined by the tension between initial module procurement and the long-term, non-linear expense of maintaining performance ratio (PR). While the pv panel price per watt serves as the primary capital expenditure (CAPEX) driver, the subsequent operational expenditure (OPEX) is frequently underestimated during the feasibility study phase. Managing a 50 MW or 100 MW site effectively requires transitioning from a commodity-purchasing mindset to a lifecycle-performance model where cleaning frequency is treated as a strategic lever rather than an administrative line item.
- Typical PV panel prices in India currently range from ₹16 to ₹40 per watt, excluding balance of system (BOS) and land costs.
- Manual cleaning costs for utility-scale farms average ₹300–₹500 per kW/annum, whereas automated robotic solutions can reduce this to ₹100–₹150 per kW/annum.
- Utility-scale plants in India face annual soiling losses between 4% and 7%, which can spike to 25% during dry quarters in high-dust regions like Rajasthan and Gujarat.
- Water-based cleaning requires approximately 2,500 liters per MW per cleaning cycle, creating a significant OPEX burden and sustainability risk in water-scarce regions.
How does the pv panel price affect long-term O&M strategy in India?
The procurement of PV modules is often governed by a focus on the lowest per-watt cost, but this strategy ignores the downstream implications of module sensitivity to environmental conditions. When developers select a low-cost panel, the margin saved on the initial CAPEX is often eroded within the first two years of operation due to high sensitivity to soiling and degradation under India’s varying dust profiles. In utility-scale projects, the pv panel price is only one part of the plant stack; the long-term O&M budget must account for the specific cleaning technology required to maintain the manufacturer-specified performance levels.
Strategic planning requires assessing whether the chosen module technology, whether monocrystalline or bifacial, requires more frequent or specialized cleaning interventions. For instance, bifacial modules, while offering higher generation gains, are uniquely susceptible to rear-side soiling in high-dust environments, which can negate the efficiency gains if not managed through an automated, frequent cleaning schedule. Linking your O&M approach to your panel selection early ensures that you are not overpaying for high-efficiency hardware that is perpetually choked by dust-induced losses.
For a detailed look at how these financial decisions affect your bottom line over the full 25-year asset life, you can explore the methodology for calculating solar plant ROI and payback period. Properly calibrating your cleaning regime is not just about keeping the glass clean; it is about protecting the initial investment made when you first negotiated the per-watt module contract. As site complexity increases, particularly in projects utilizing tracking systems, maintenance becomes more intensive; understanding the nuances of solar tracker maintenance is essential for anyone managing modern, high-output utility sites in India.
Ultimately, the financial viability of an Indian utility-scale plant depends on maintaining a tight correlation between the investment in high-quality panels and the deployment of an O&M infrastructure that prevents power output degradation. When O&M strategies are reactive rather than predictive, the cost of labor and water consumption can lead to a steady climb in OPEX, effectively undoing any short-term savings achieved during the module procurement phase. For projects looking to quantify these savings, utilizing a price calculator can provide clarity on the break-even points for switching from manual teams to autonomous robotic fleets.
Managing soiling losses: The hidden tax on your energy yield
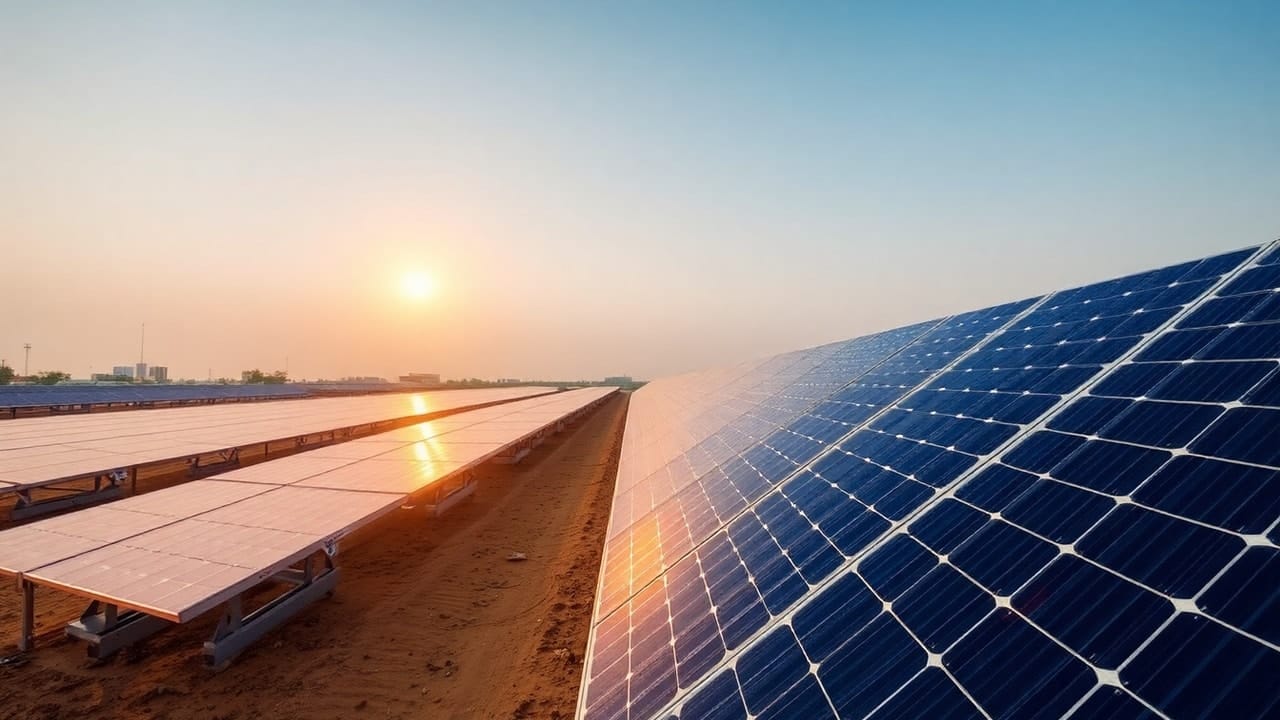
Soiling represents one of the most critical variables in the operational performance of utility-scale solar farms in India. When the pv panel price is the focus of procurement, there is a risk of underestimating the silent, daily degradation caused by dust, pollution, and agricultural residue. In regions like Rajasthan and Gujarat, soiling is not merely an occasional nuisance; it is a consistent tax on the plant’s Performance Ratio (PR). Industry data indicates that utility-scale assets can face annual energy losses between 4% and 7%, with these figures spiking to 25% during prolonged dry spells or dust storms. When this loss is compounded over a 25-year asset life, the cumulative revenue erosion often far exceeds the initial capital expenditure savings achieved by selecting lower-tier modules.
The impact of soiling is non-linear. As dust builds up, it does not just reduce light transmission; it creates hotspots that can permanently damage PV cells. For large-scale projects, the strategy for managing these losses must move from reactive, ad-hoc cleaning to a predictive schedule based on real-time soiling data. When you consider the photovoltaic panels price, you are essentially investing in a machine that requires a clean glass surface to function at its peak. If the cleaning schedule is too infrequent, the drop in PR triggers a chain reaction of lower energy sales, increased warranty claims, and, in severe cases, premature component failure.
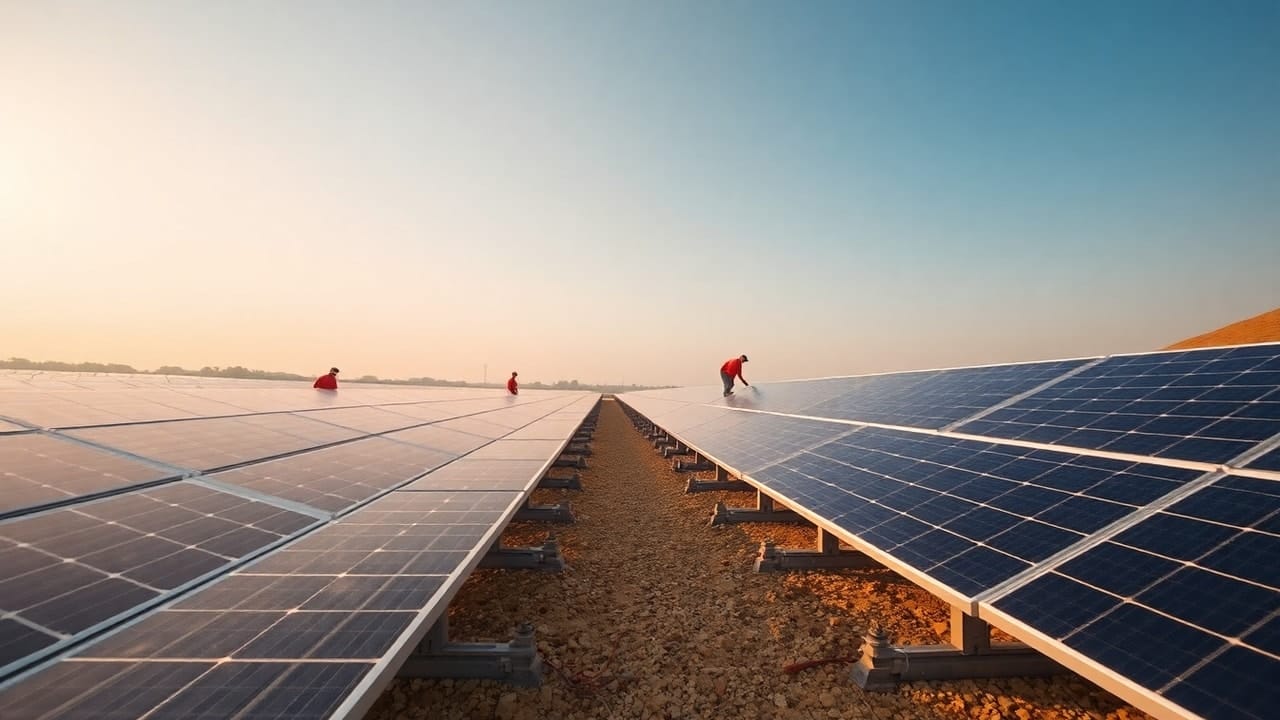
For plant operators, the decision of how often to clean is a financial calculation. High-dust regions demand more aggressive, frequent cycles, yet manual cleaning at such frequency creates significant operational risks. Using manual labor to clean a 50 MW plant twice a month involves hundreds of workers who move across the site, increasing the risk of micro-cracks in panels and damage to expensive tracker components. If you are operating a site with tracking systems, your maintenance strategy must also align with the mechanical limitations of your hardware; learning more about solar tracker maintenance is vital to ensure that your cleaning intervention does not cause mechanical misalignment or electrical downtime.
Budget lines: Manual labor vs. automated robotic cleaning
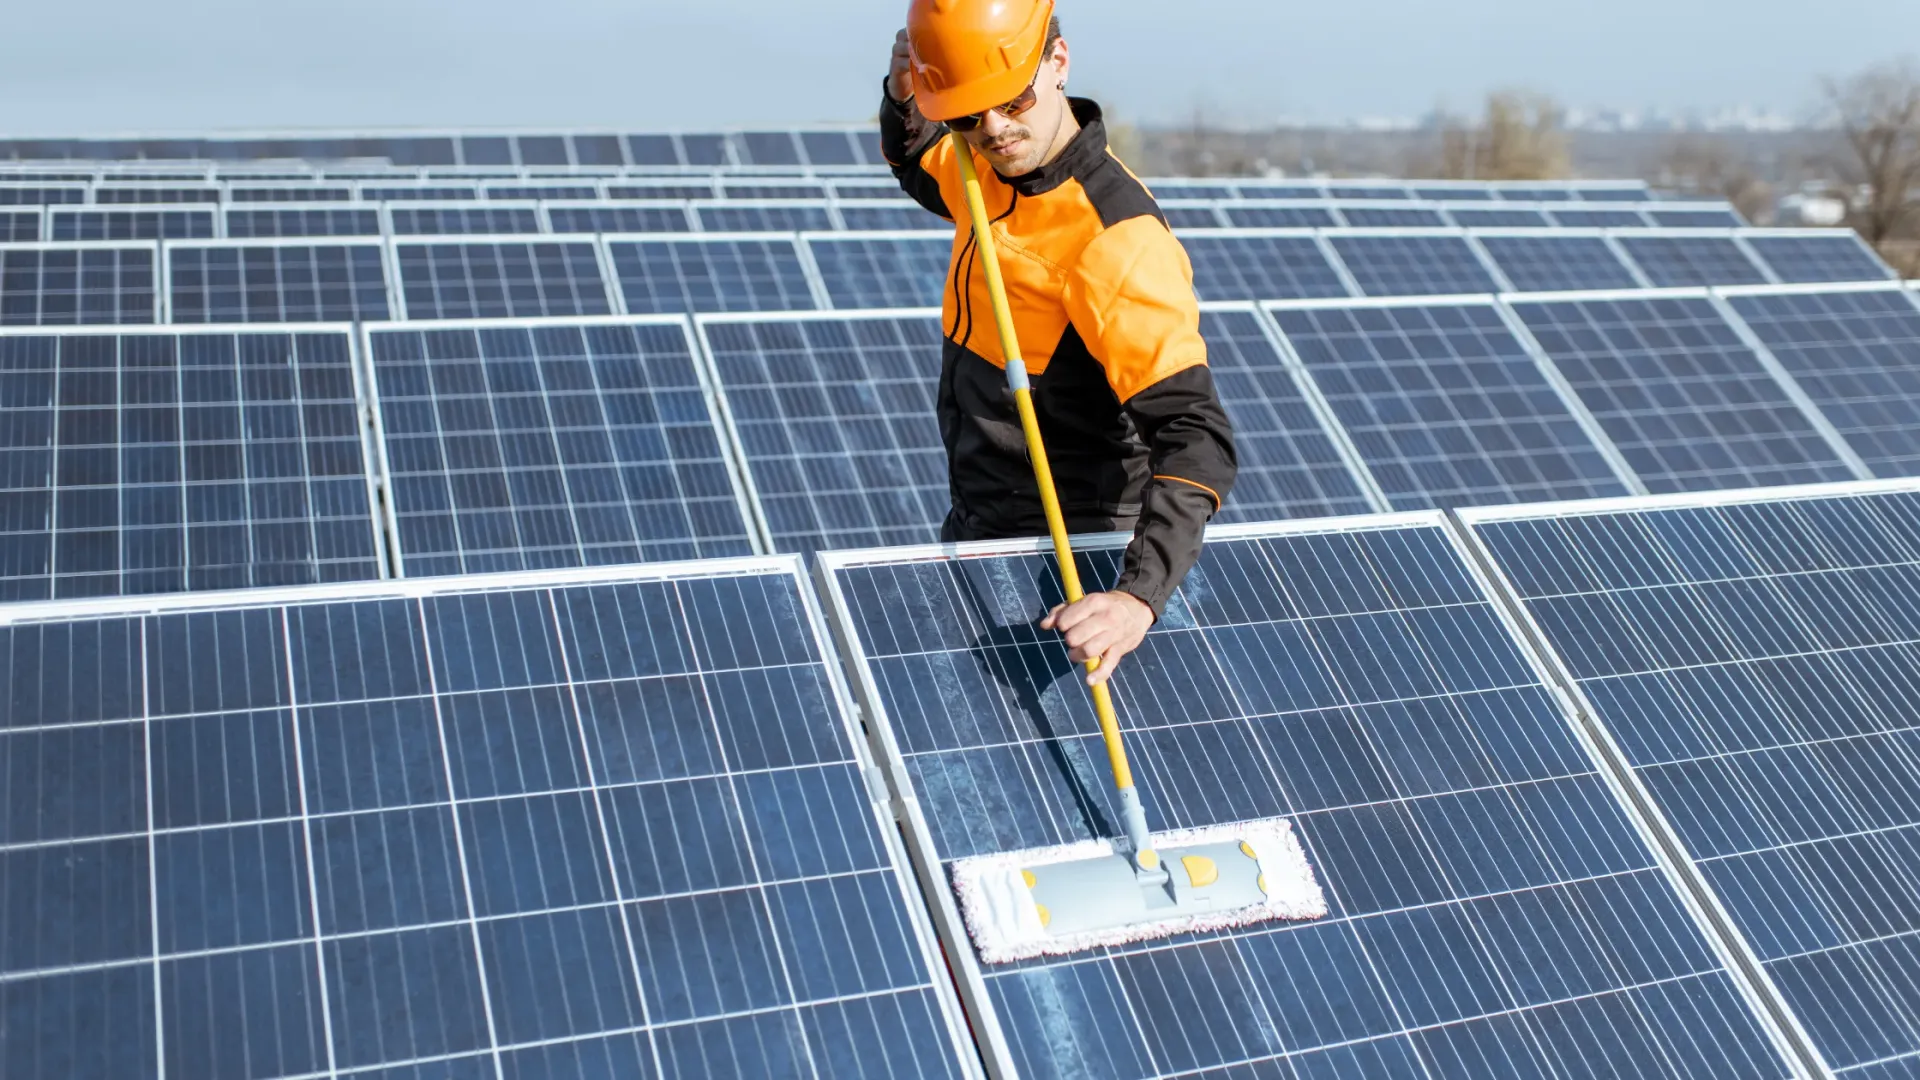
The operational budget for a utility-scale solar plant in India is often dominated by labor costs, with traditional manual cleaning consistently representing one of the largest annual line items. When benchmarking against the pv panel price per watt, asset owners must evaluate their OPEX in terms of cost per kWh recovered. Manual cleaning typically costs between ₹300 and ₹500 per kW per annum. This figure includes wages, transportation, safety gear, and, most importantly, the massive volume of water required. Traditional methods consume approximately 2,500 liters of water per MW per cycle, a resource that is becoming increasingly scarce and expensive in the primary solar hubs of India.
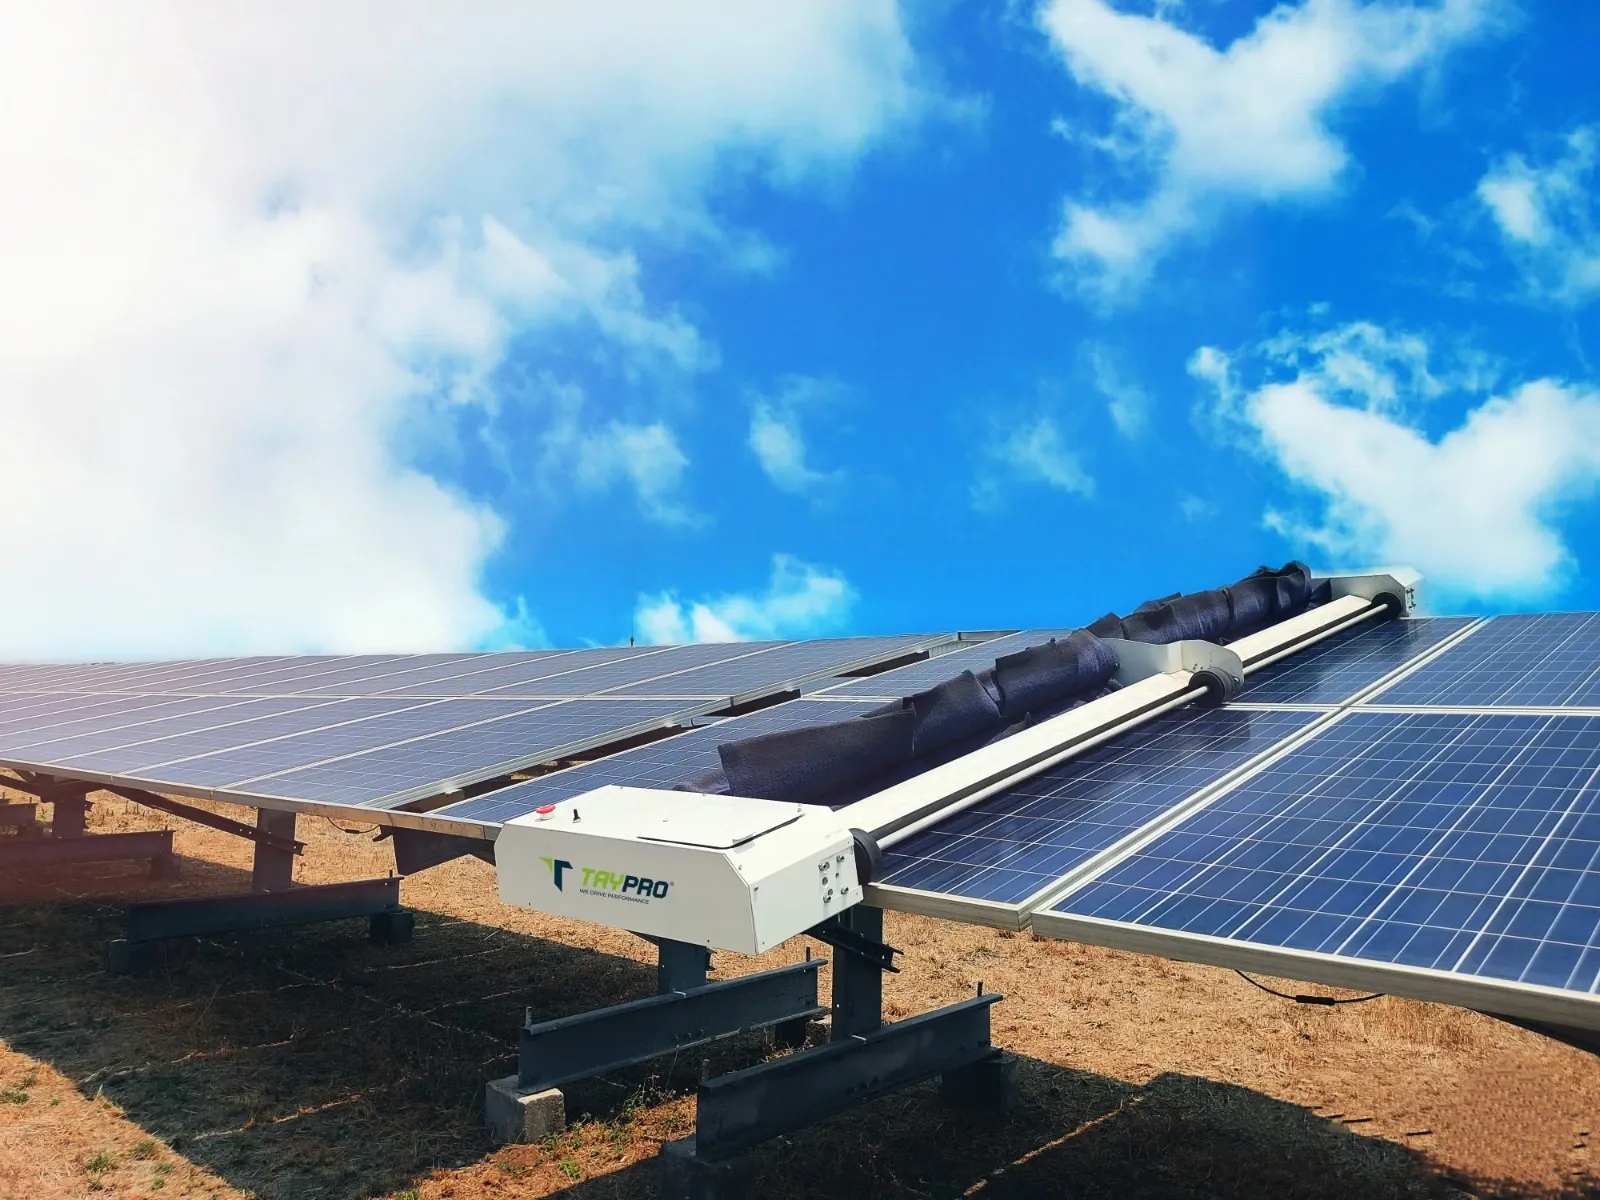
Automated robotic solutions offer a fundamentally different budget structure. By shifting from an OPEX-heavy manual model to an asset-based robotic system, firms can reduce annual cleaning costs to between ₹100 and ₹150 per kW per annum. While the initial capital outlay for robots is higher than hiring a seasonal cleaning crew, the ROI is realized through higher generation consistency and lower long-term labor dependence. For a detailed breakdown of how to project these savings against your initial capital investment, reviewing how to calculate solar plant ROI and payback period provides the necessary financial framework for making the transition to autonomous fleets.
| Feature | Manual Cleaning | Automated Robotic Cleaning |
|---|---|---|
| Annual Cost | ₹300–₹500 per kW | ₹100–₹150 per kW |
| Water Usage | ~2,500 Liters / MW per cycle | Waterless |
| Cleaning Frequency | Limited by labor availability | Daily / On-demand (AI-scheduled) |
| Risk of Damage | High (Micro-cracks, tracker stress) | Minimal (Engineered contact) |
The shift to robotic cleaning also fundamentally changes the risk profile of the plant. Autonomous systems can be scheduled during night hours or low-yield periods, ensuring that the plant is always operating at peak efficiency when the sun is brightest. In contrast, manual teams are often restricted by daylight hours and site access constraints, leaving panels dirty during prime production windows. For an asset owner, the decision is no longer just about the pv panel price but about controlling the variance in daily generation by eliminating the reliance on intermittent human labor.
Water scarcity and operational costs in Indian solar farms
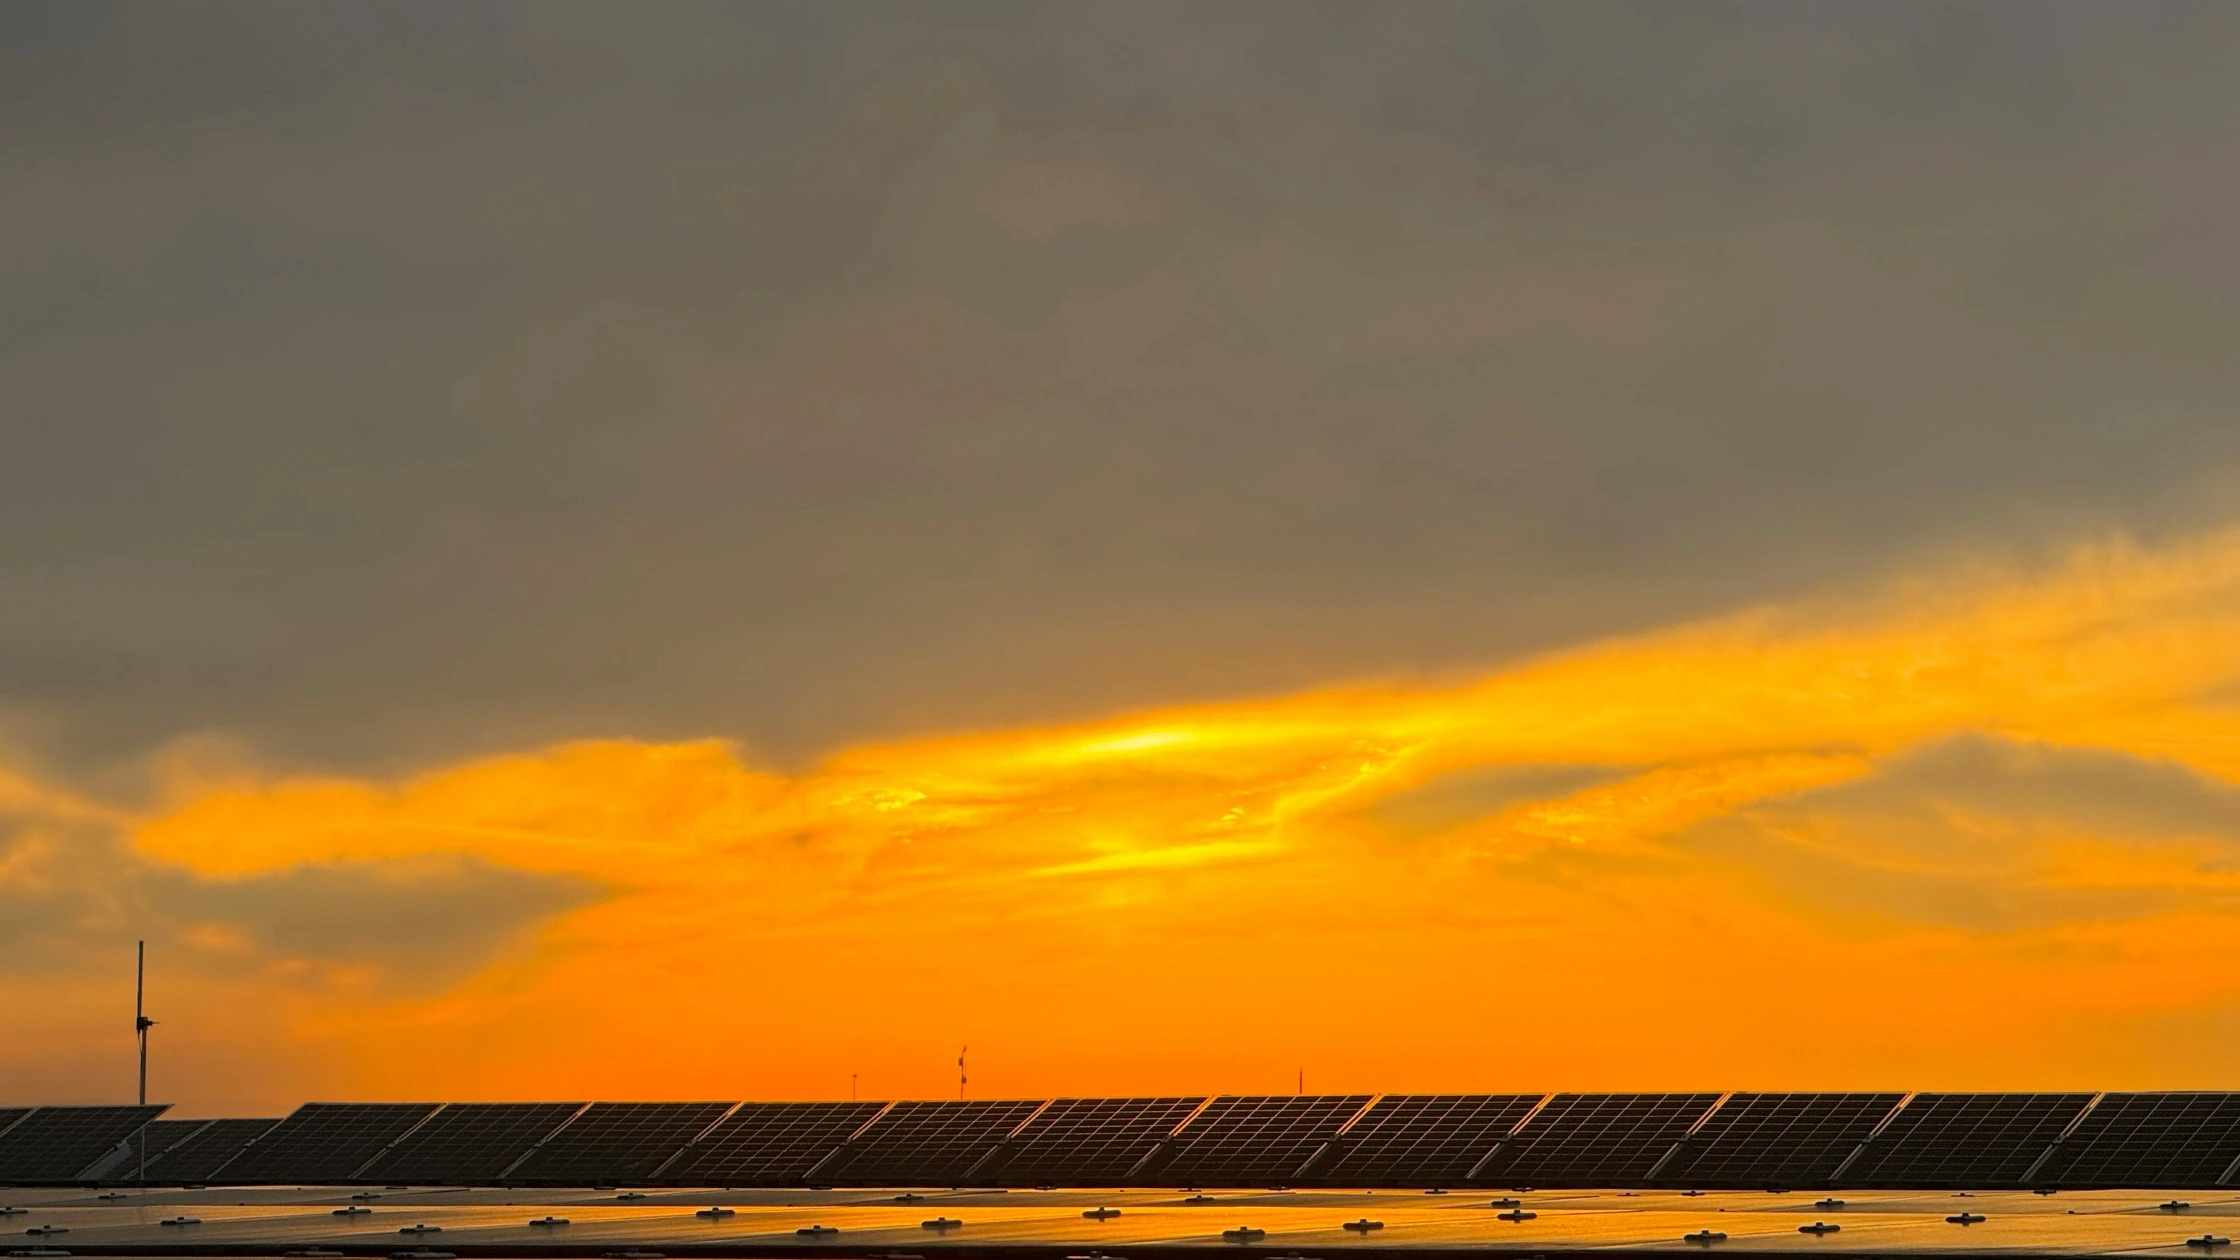
For utility-scale projects, water is not merely a utility, it is a finite asset that dictates operational continuity. In regions like Rajasthan and Gujarat, where daily soiling rates can exceed 0.47% during peak dry seasons, the reliance on water-based cleaning is a significant operational liability. Traditional wet cleaning consumes approximately 2,500 liters of water per MW per cycle. When scaled across a 100 MW portfolio, this equates to hundreds of thousands of liters of water consumed annually, often sourced from costly water tankers if groundwater is unavailable or saline.
The financial impact of this water usage extends beyond the procurement costs. When water is scarce, the logistical challenge of transporting thousands of liters to remote, sun-drenched sites creates a bottleneck in cleaning frequency. If the water supply is inconsistent, the site manager is forced to delay cleaning cycles, allowing dust to bake onto the surface of the PV modules. This delay results in a cumulative performance ratio (PR) loss that often reaches 15% to 25% over a dry quarter. For an asset owner, this is not just an O&M inconvenience; it is a direct erosion of the revenue potential that was originally modeled in the project’s internal rate of return (IRR).
Furthermore, local environmental regulations in high-stress water zones are increasingly scrutinizing heavy industrial water consumption. Transitioning to waterless cleaning methods is no longer just an economic optimization; it is a regulatory hedge. Asset owners who account for the full lifecycle cost of water, including logistics, labor, and potential resource taxes, often find that their O&M budgets are heavily skewed toward variables they cannot easily control. By integrating waterless, autonomous technologies, the budget shifts from volatile, resource-dependent line items to predictable, asset-based depreciable costs.
Analyzing the ROI of autonomous cleaning systems
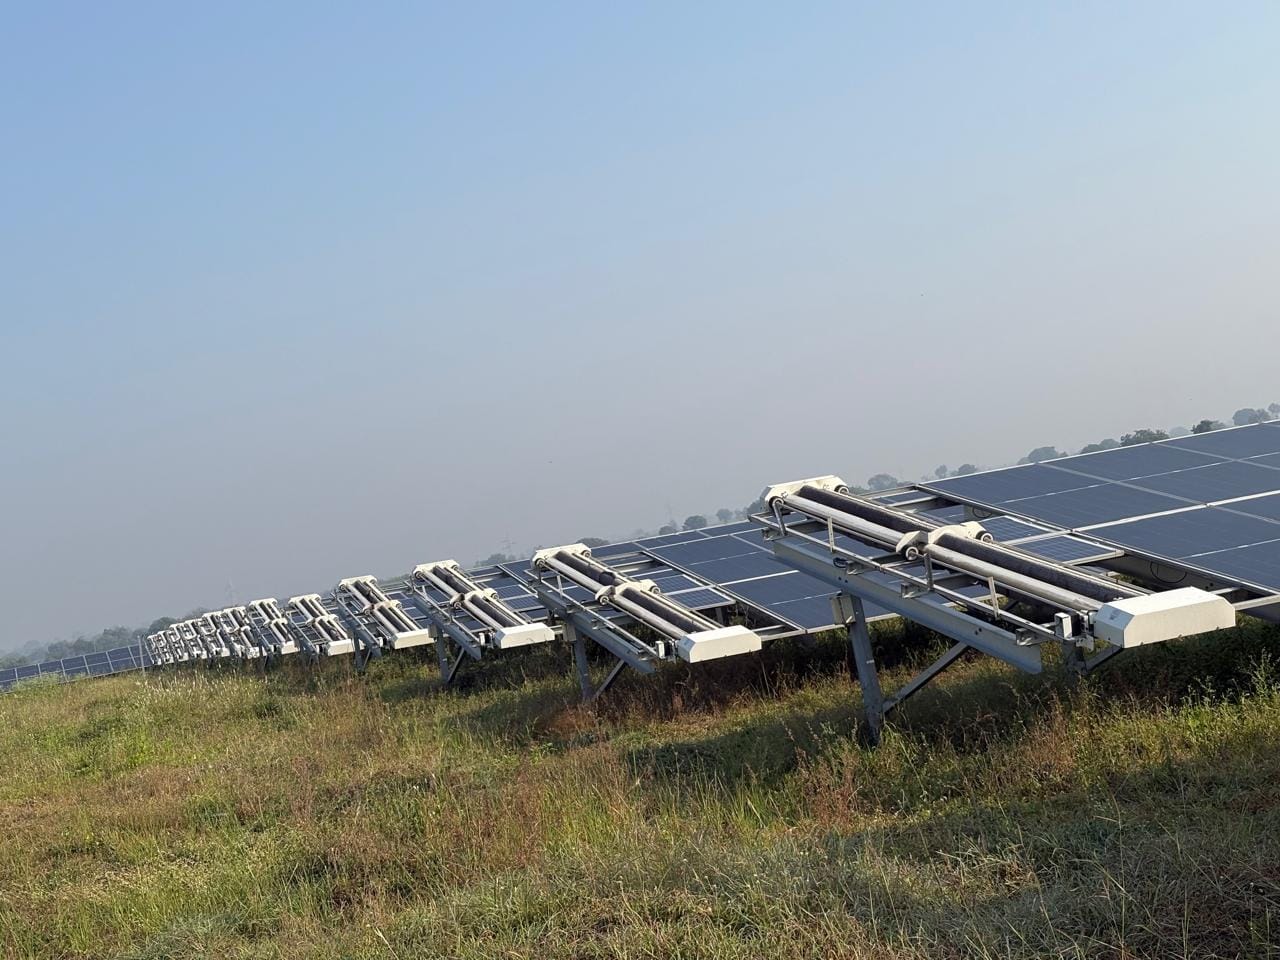
Determining the ROI of an autonomous cleaning investment requires looking beyond the initial pv panel price and focusing on the total cost of ownership (TCO) over a 25-year plant life. In the Indian market, where labor costs are rising and the demand for consistent yield is higher than ever, the transition to autonomous cleaning is typically justified when the cost of recovered energy outweighs the amortization of the robotics hardware. A typical utility-scale deployment of autonomous robots can recover 188 GWh+ of generation across a fleet, representing a significant upside in revenue generation compared to stagnant, manual-only cleaning schedules.
To calculate your specific ROI, compare your current manual cleaning spend (typically ₹300–₹500 per kW per annum) against the projected OPEX of an automated fleet (approx. ₹100–₹150 per kW per annum). The delta between these figures provides the surplus cash flow available to service the capital investment in the hardware. If your site experiences high soiling rates, the payback period for these systems often falls within 24 to 36 months, depending on the site-specific PR loss recovery. You can refine your project planning by visiting our solar panel cleaning robot price calculator to see how specific site variables impact your break-even timeline.
Beyond simple cost-per-cleaning metrics, consider the impact on the hardware itself. Manual cleaning, while familiar, introduces human error, micro-cracks from improper pressure, and mechanical strain on tracking systems. Autonomous systems like the GLYDE or NYUMA series are designed to respect the structural integrity of the mounting systems, ensuring that your long-term infrastructure health is not compromised. As discussed in our guide on solar tracker maintenance, aligning your cleaning intervention with the mechanical constraints of your tracker tables is essential for avoiding premature equipment failure.
Key takeaways for asset owners and EPC leads
- Evaluate the Lifecycle Cost: Do not base decisions on the pv panel price alone; factor in the annual 4–7% energy loss caused by soiling and the subsequent cost of recovery.
- Prioritize Waterless Infrastructure: Given the water-scarce reality of India’s solar corridors, waterless robotic systems offer a predictable OPEX model that hedges against rising water logistics costs.
- Measure by PR Recovery: Shift the focus from the cost per cleaning cycle to the PR gain. A 1% increase in PR is worth significantly more in revenue than the savings found by delaying a cleaning cycle.
- Plan for Integration Early: Whether you are in the planning stage or retrofitting an existing MW plant, evaluate the compatibility of your tracker hardware (e.g., NEXTracker vs. Gamechanger) with autonomous cleaning solutions before commissioning.
- Utilize Data Analytics: Deploying fleet management layers like NECTYR allows you to move from fixed, manual calendars to AI-driven, on-demand cleaning that triggers only when soiling thresholds are crossed.
Frequently asked questions
For utility-scale solar asset owners in India, the total cost of ownership is defined by the tension between initial module procurement and the long-term, non-linear expense of maintaining performance ratio (PR). While the pv panel price per watt serves as the primary capital expenditure (CAPEX) driver, the subsequent operational expenditure (OPEX) is frequently underestimated during the feasibility study phase.
Cleaning frequency depends on regional dust profiles and seasonal shifts. In high-dust zones like Rajasthan, soiling losses can reach 25% during dry quarters, necessitating more frequent interventions. Asset managers must balance these losses against the cost of water, which requires 2,500 liters per MW per cycle, to determine the optimal cleaning schedule for their site.
Yes, robotic systems generally offer superior long-term value. While manual cleaning costs range from ₹300–₹500 per kW/annum, robotic solutions reduce these expenses to ₹100–₹150 per kW/annum. For a 50MW plant, the transition to automation significantly lowers OPEX and provides more consistent cleaning performance, which helps mitigate the non-linear expense of maintaining the plant's overall performance ratio.
Environmental contaminants dictate cleaning needs by accelerating soiling losses. In desert regions, airborne dust particles settle rapidly, necessitating frequent cleaning to prevent the 25% performance drops seen in dry seasons. Similarly, industrial pollution creates sticky residues that manual or robotic cleaners must remove more aggressively, forcing operators to adjust their maintenance budgets to account for increased cleaning cycles.