Quick answer: Mitigating soiling for sunlight panels
Effective soiling mitigation at utility-scale sites in India requires a transition from reactive, calendar-based cleaning to data-driven, autonomous operations. By aligning cleaning frequency with real-time soiling levels, operators can protect the performance ratio (PR) of their assets across varying environmental conditions.
- Typical energy yield losses due to soiling in India range from 5% to 25% depending on local dust profiles and regional humidity levels.
- Optimal cleaning cycles in high-dust corridors, such as Rajasthan, often require maintenance every 7 to 15 days, whereas coastal or less dusty sites may only necessitate a cycle every 30 to 45 days.
- Waterless robotic cleaning can reduce water consumption by 100% and cut O&M operational expenses by 30% to 50% compared to traditional manual water-based washing.
- Maintaining a consistent PR requires integrating real-time soiling detection with automated cleaning schedules rather than relying on fixed, arbitrary calendar intervals.
What is the impact of soiling on sunlight panels in India?

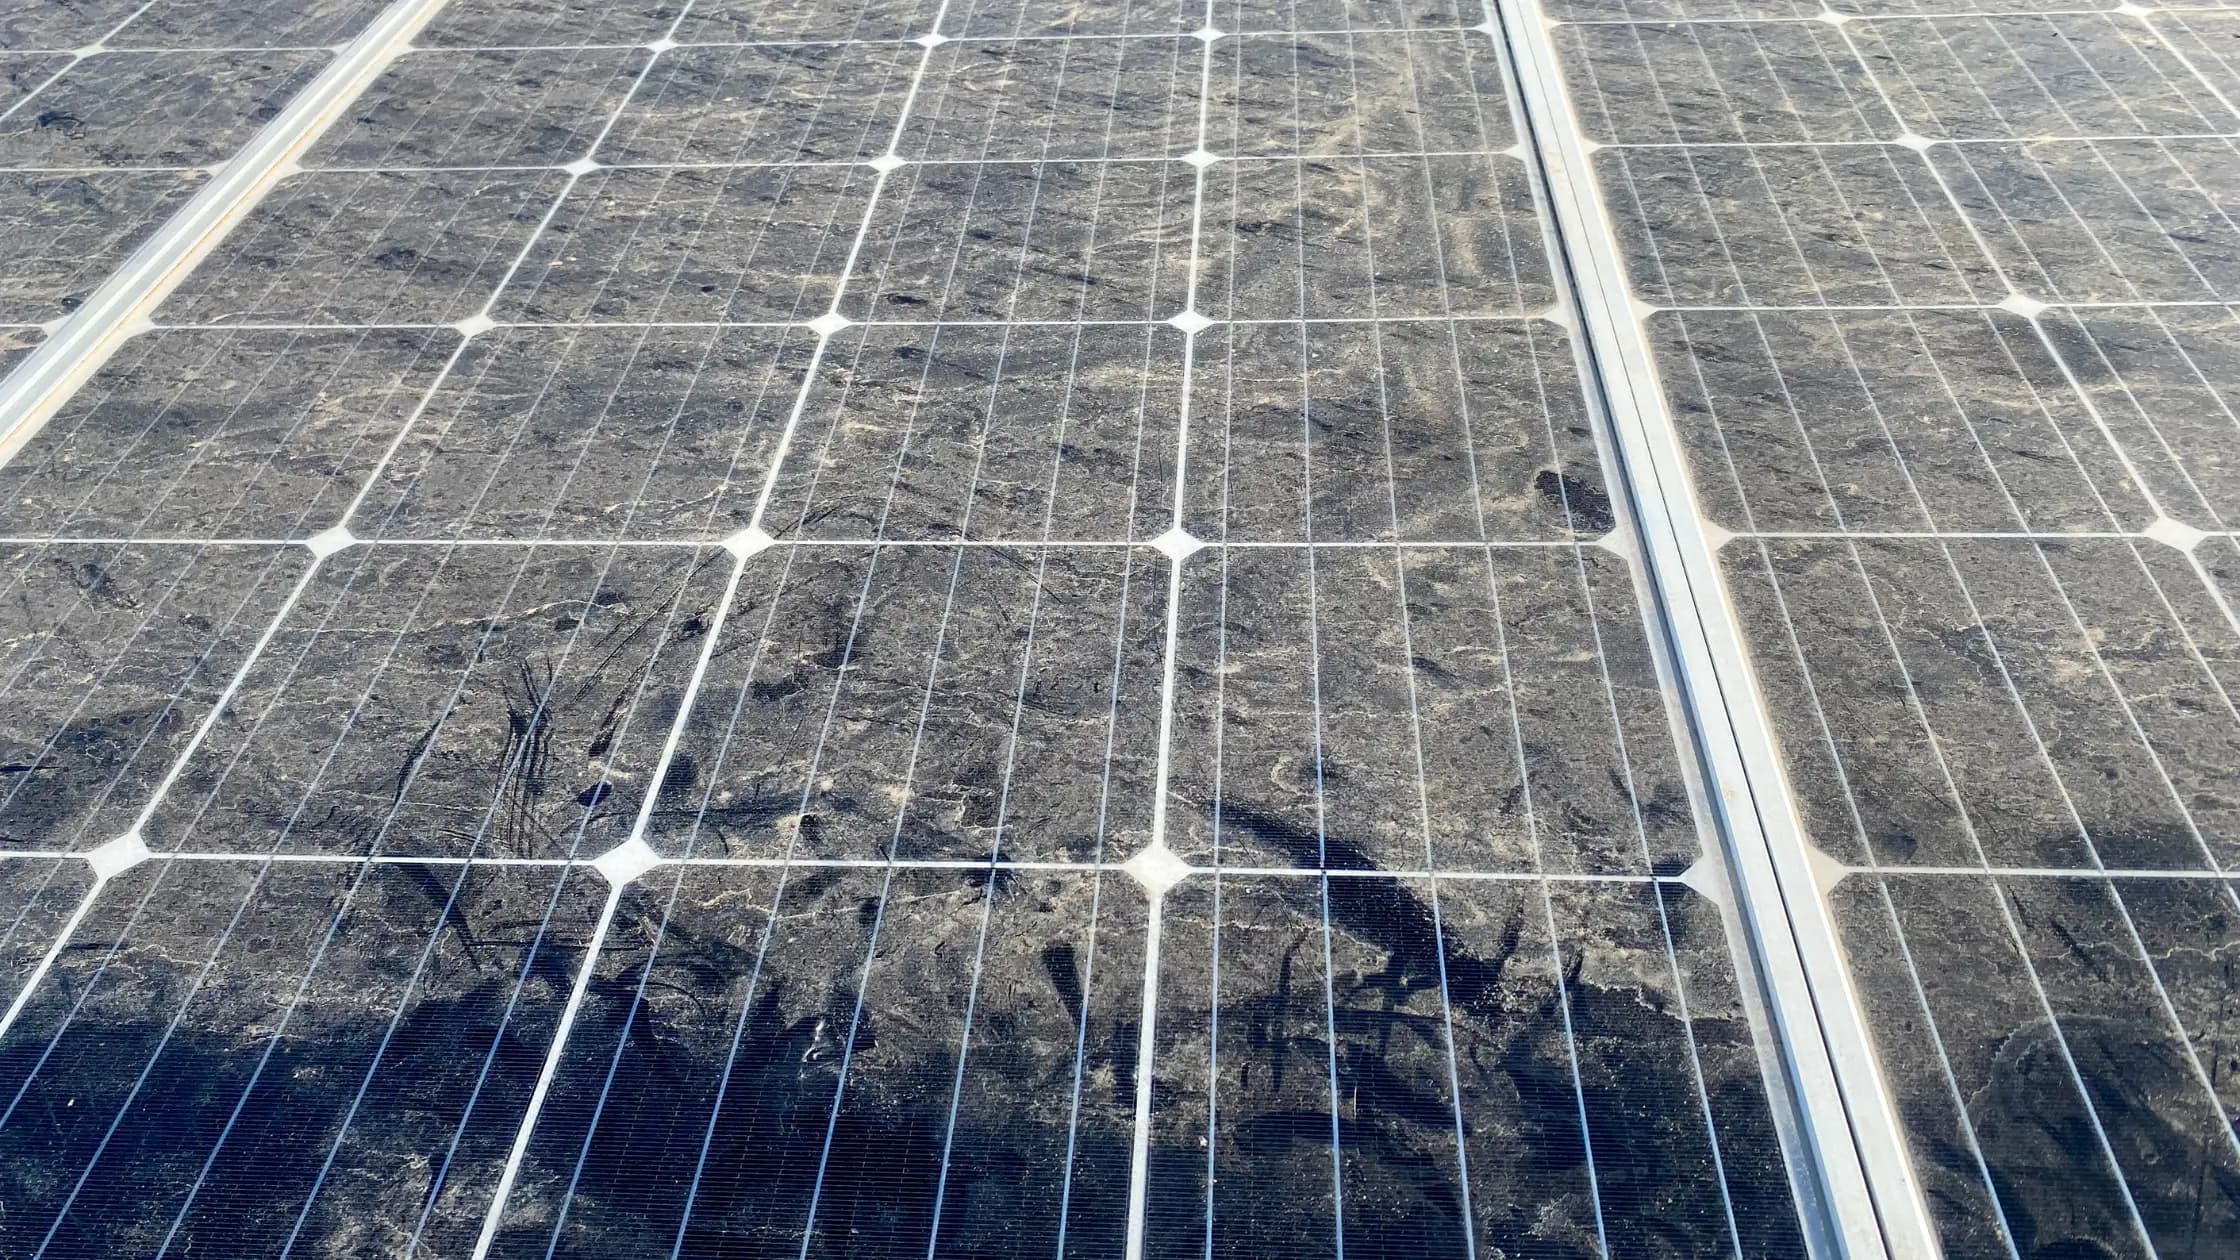
For utility-scale sunlight panels, soiling is the single largest variable factor influencing annual energy yield losses. In India, the composition of dust varies significantly by geography, from the loose, wind-blown sands of Rajasthan to the industrial pollutants and high-humidity deposits common in southern or coastal regions. When these particles accumulate on the module surface, they create a physical barrier that attenuates incident light before it reaches the solar cells.
The technical impact is twofold. First, there is a direct reduction in current, which translates to immediate lost revenue. Second, and perhaps more damaging, is the risk of hotspot formation. When sunlight panels are partially obscured by localized soiling, the resulting mismatch in current within the module can cause individual cells to operate in reverse bias, leading to localized heating that degrades the panel material over time. This accelerates the degradation rate beyond the manufacturer's typical 25-year performance warranty.
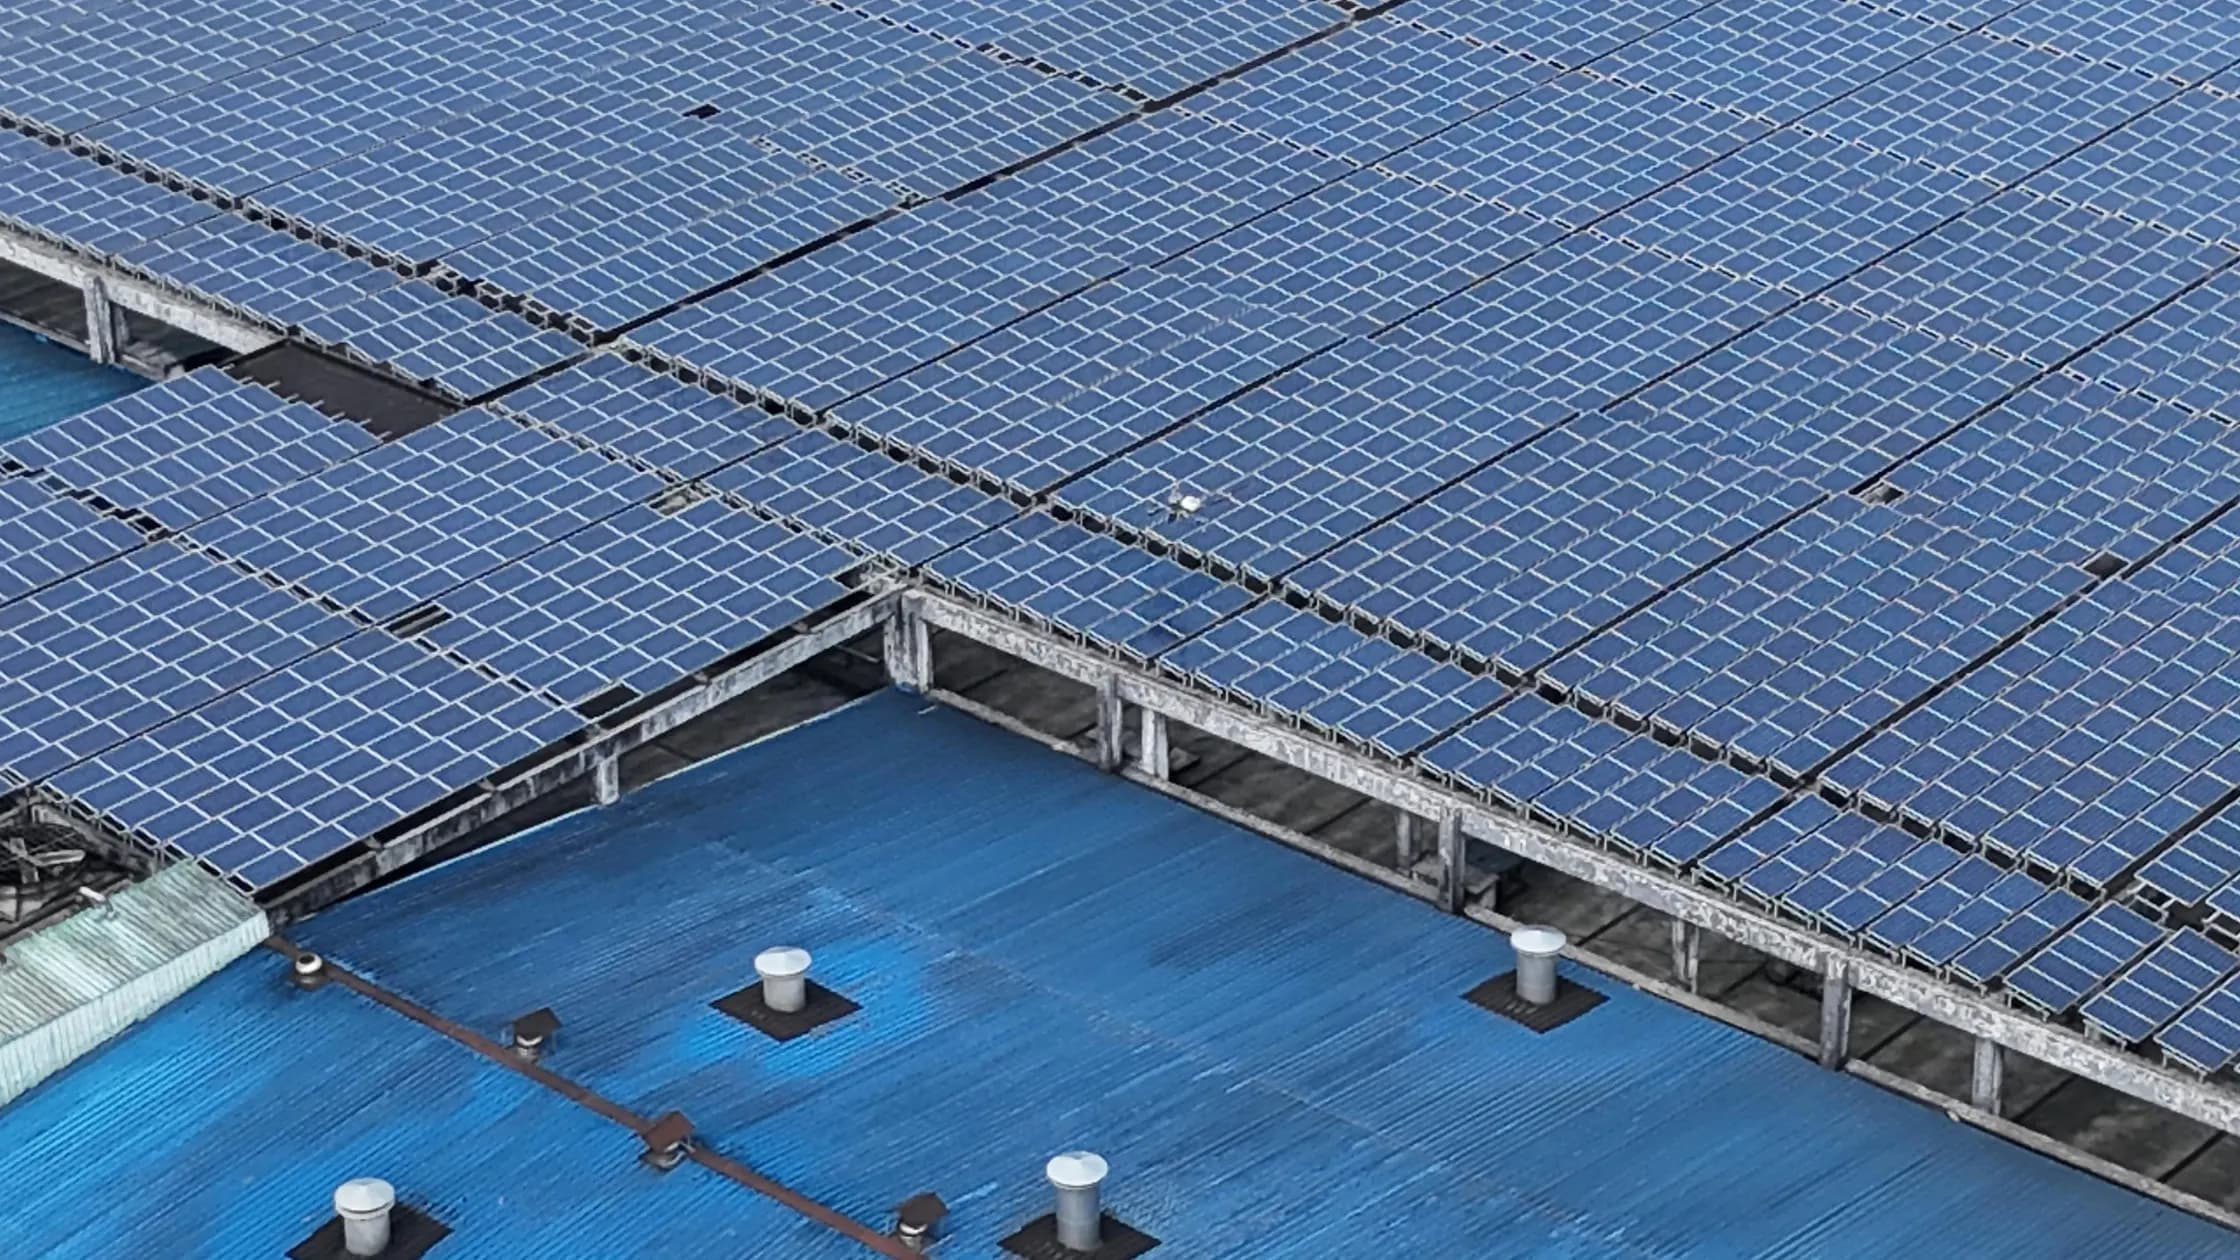
At a 50 MW plant scale, even a minor 2% increase in average monthly soiling losses can aggregate into significant annual revenue leakage. Many operators find that relying on traditional cleaning methods, such as manual water-based brushing, often results in an uneven cleaning quality, leading to sub-optimal PR and increased water procurement costs. As noted in our Solar Panel Maintenance Checklist 2026, moving toward a standardized, automated approach is critical for maintaining high performance metrics in India's diverse climate. Consistent, low-contact cleaning preserves the anti-reflective coating on high-efficiency sunlight panels, ensuring that the initial investment in module quality is fully realized through lower long-term O&M expenditures.
For operations teams currently managing large-scale assets, understanding the correlation between dust accumulation and transmission loss is essential. Effective utility-scale solar operations involve monitoring these losses through SCADA systems and verifying that cleaning frequency is triggered by actual output drops rather than fixed schedules. When the plant's control system can differentiate between irradiance fluctuations and soiling-induced drops, the maintenance team can prioritize higher-risk blocks, optimizing the utilization of cleaning equipment and labor across the entire fleet.
How often should you clean utility-scale sunlight panels?
Determining the optimal cleaning frequency for utility-scale sunlight panels requires moving beyond the traditional calendar-based approach toward a data-driven model that prioritizes the specific soiling rates of your site. At a 50 MW+ scale, an arbitrary monthly cleaning schedule often leads to either wasted operational expenditure during low-dust periods or severe revenue loss due to deferred maintenance during high-deposition events. The industry-typical standard suggests cleaning frequencies range from 7 to 15 days in high-soiling zones like Rajasthan, whereas sites in Karnataka or Maharashtra might only require intervention every 30 to 45 days.
The decision to initiate a cleaning cycle should be dictated by the Performance Ratio (PR) of the specific plant block. Modern operations teams utilize SCADA-integrated sensors or advanced connectivity solutions to monitor irradiance and current output in real time. When the delta between the expected output and actual production exceeds a predefined threshold, typically 2% to 3%, the automated cleaning system should be triggered. This approach ensures that you are only performing maintenance when the economic benefit of recovered energy exceeds the marginal cost of the cleaning operation, effectively protecting the return on investment for your photovoltaic modules.
O&M strategies for diverse Indian environments
Executing an effective O&M strategy in India requires a localized understanding of the climatic variables impacting sunlight panels. The country's topography demands tailored mitigation strategies, as a "one-size-fits-all" approach to soiling management often fails to account for the chemical composition of local pollutants. For instance, coastal plants in Gujarat face challenges related to sea salt spray and humidity, which can turn fine dust into a sticky film that is significantly harder to remove than the loose silt encountered in arid desert regions. As detailed in our Solar Panel Maintenance Checklist 2026, ignoring these regional distinctions is a common mistake that leads to accelerated coating wear and premature module degradation.
To optimize performance across diverse Indian utility sites, asset owners should evaluate the following environmental factors during the O&M procurement phase:
- Arid and Desert Zones: High wind speeds coupled with fine, abrasive dust require frequent, low-impact dry cleaning to prevent the micro-scratching of protective anti-reflective coatings.
- Industrial Corridors: Sites located near coal-based power plants or high-traffic transport routes often face soot and oily deposits. Here, the priority is to avoid water-based cleaning that can create mud streaks, instead opting for mechanical dry-cleaning methods that lift contaminants without leaving residues.
- Agricultural and High-Humidity Belts: Biological growth and moisture-trapping dust require a consistent, dry-cleaning frequency to prevent the formation of localized shading spots and potential hotspot formation, which can jeopardize the long-term warranty of your sunlight panels.
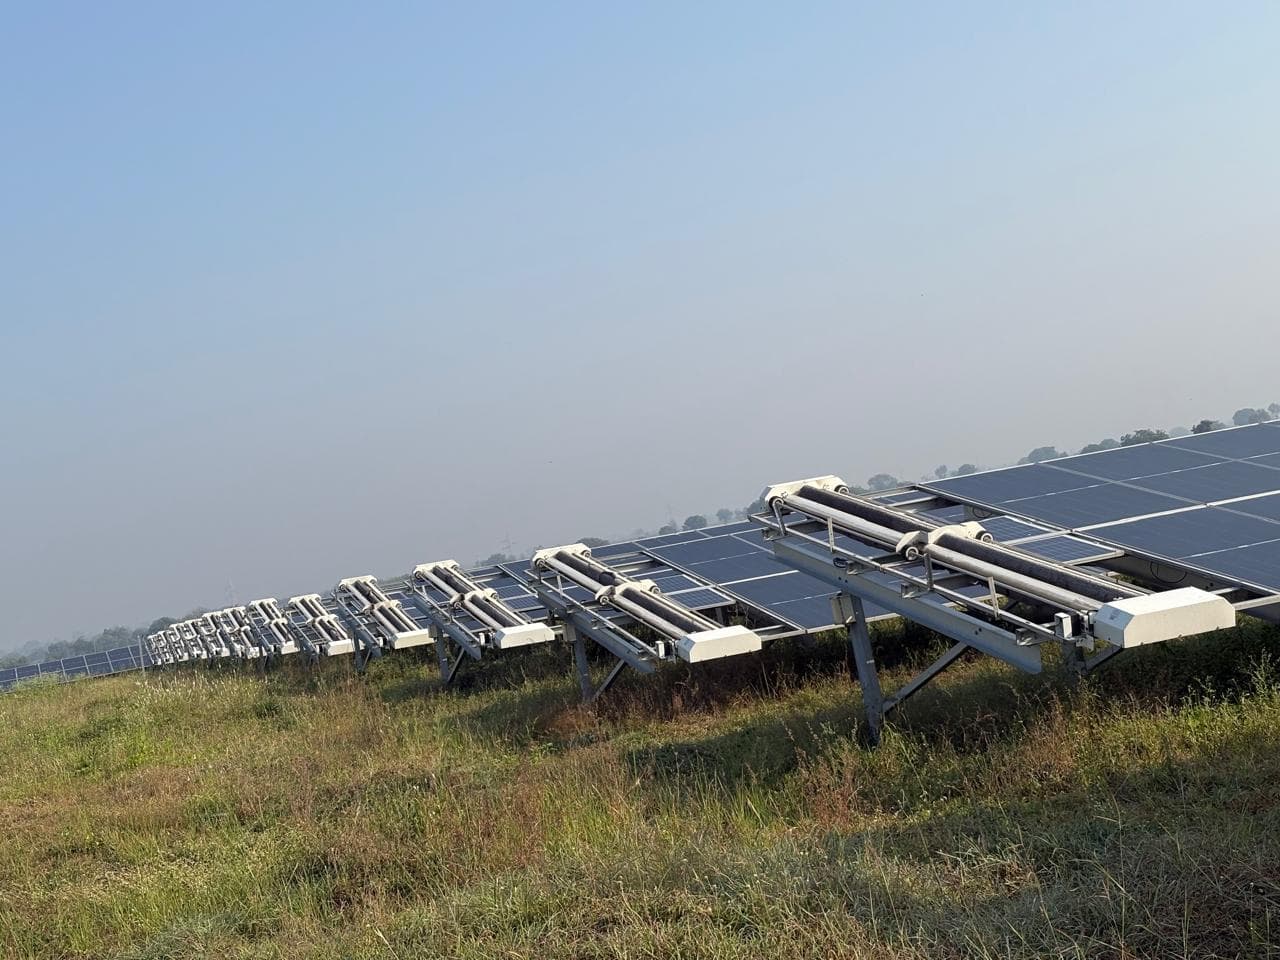
Effective O&M for utility-scale plants also requires a clear strategy for the transition between wet and dry seasons. During the monsoon, while rainfall provides a natural cleaning mechanism, it can also lead to mud splashing on the lower rows of tracker-mounted modules. Integrating an automated system allows operators to bypass rows that have been cleaned by rain, while specifically targeting sections where heavy mud accumulation persists. This intelligent scheduling not only reduces the operational burden on your cleaning assets but also minimizes the mechanical wear and tear on your trackers and robotic systems, extending the overall lifecycle of your solar panel cleaning system.
Comparing cleaning methods: TCO and technical trade-offs
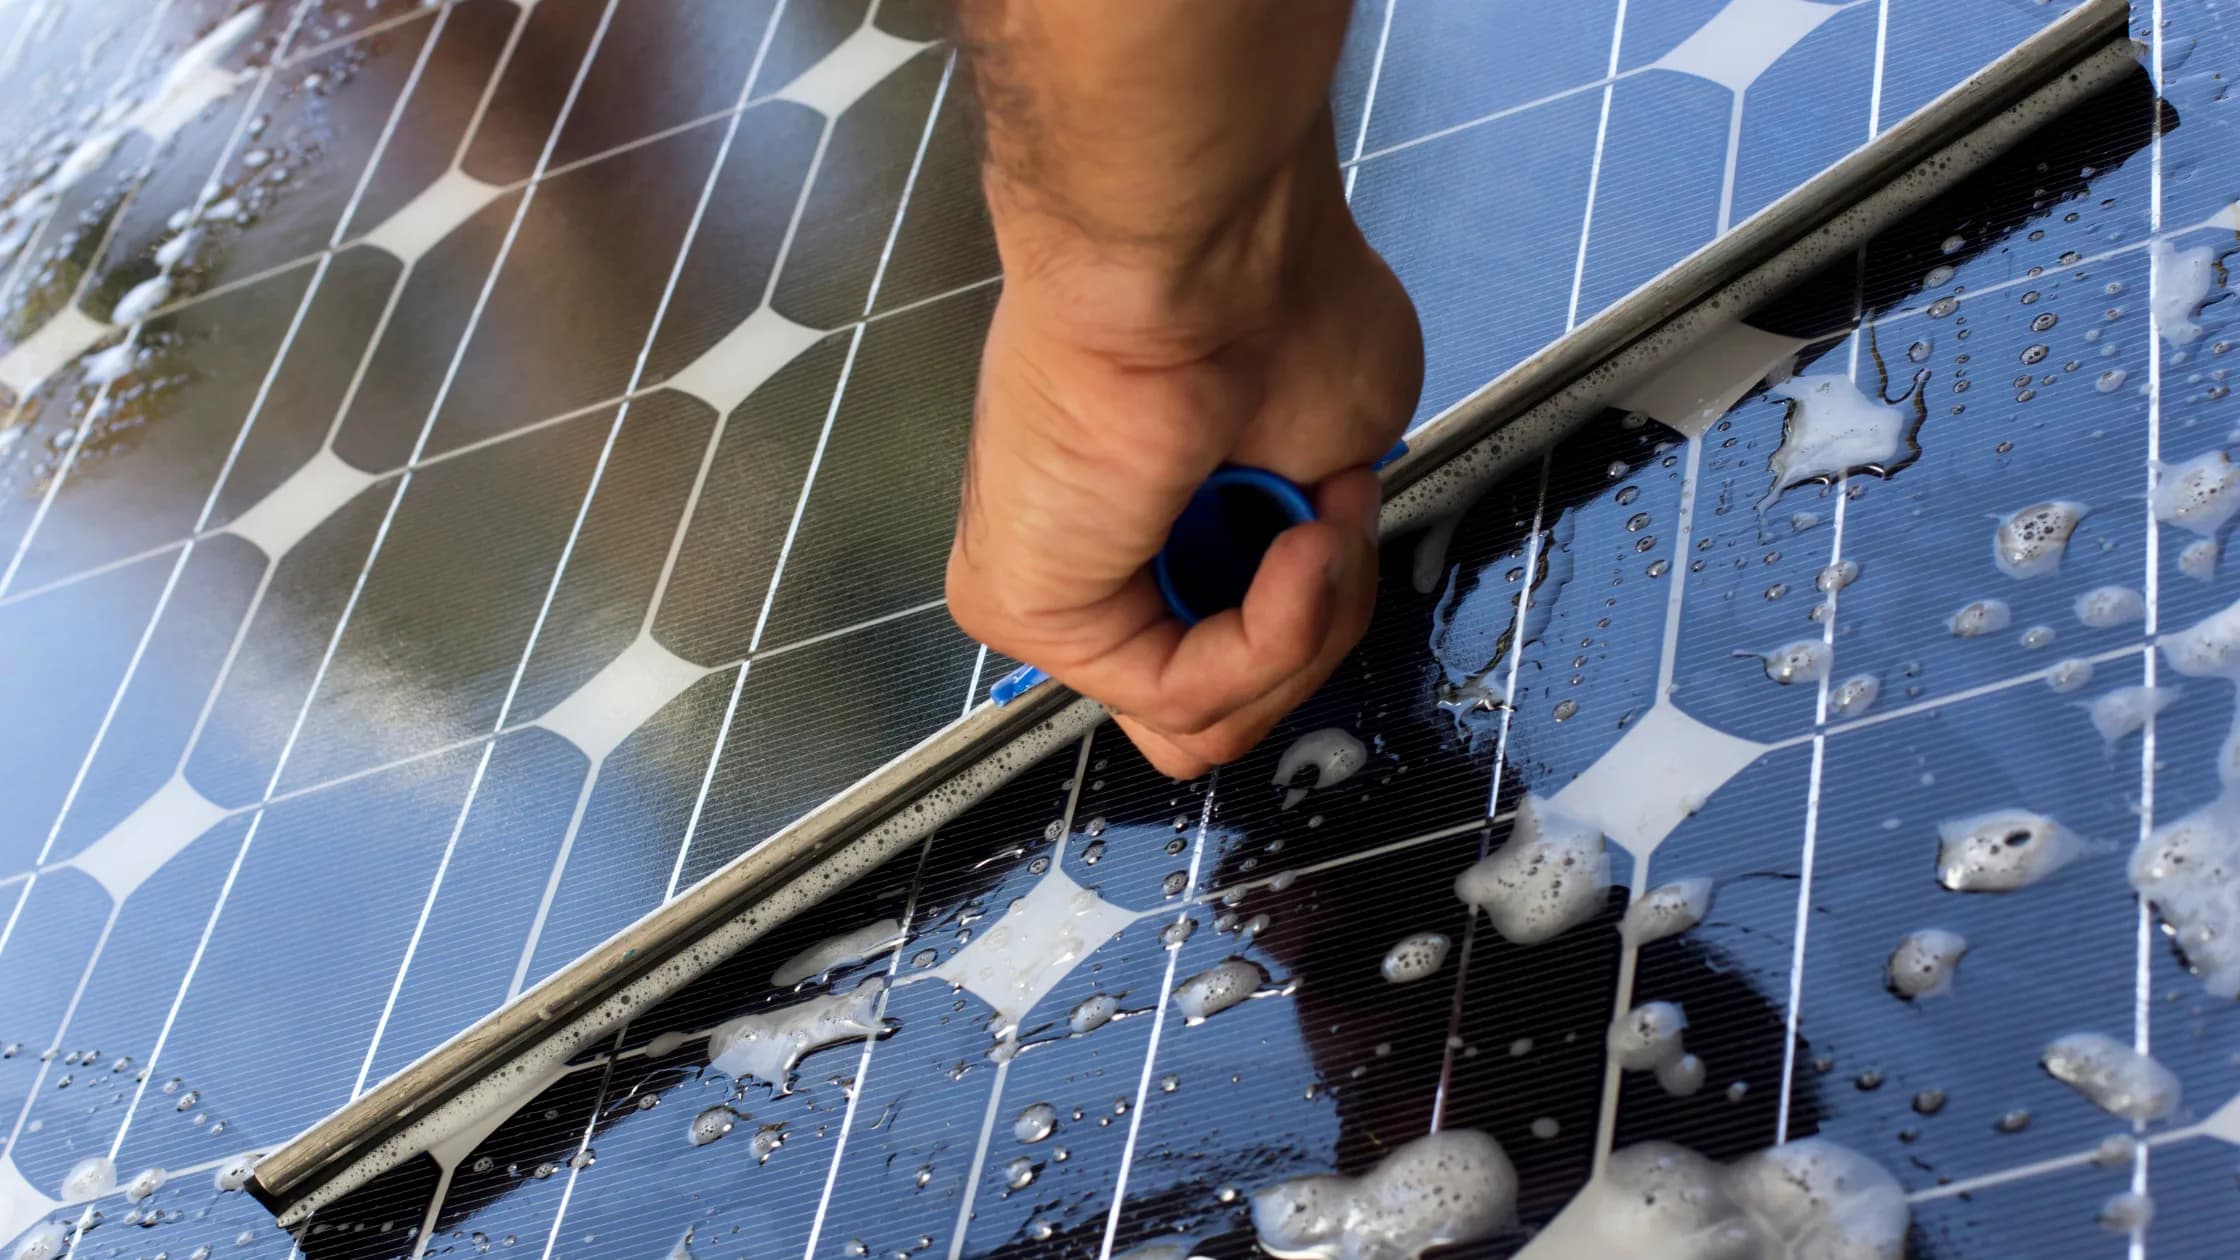
For utility-scale assets in India, the choice between manual, semi-automatic, and fully automatic cleaning systems is no longer just about the immediate bill for labor. Asset owners must evaluate the Total Cost of Ownership (TCO) over a 20- to 25-year lifecycle. Manual brush cleaning, while low in initial capital expenditure, introduces high recurring OPEX and, more importantly, high operational risk. Manual cleaning crews often operate with varying levels of pressure and consistency, which can lead to micro-scratching on the anti-reflective (AR) coatings of sunlight panels. Over a 50 MW+ portfolio, these scratches accumulate, leading to permanent losses in light absorption and potential hotspot formation that degrades the module string performance.
In contrast, automated waterless solutions, such as those utilizing single-pass PBT brushes like the NYUMA or dual-pass microfiber technologies like the GLYDE, offer a standardized cleaning profile. By removing the variability of manual labor, these systems ensure that the cleaning force and frequency remain constant across every row. The table below outlines the primary technical trade-offs for utility-scale operators:
| Cleaning Method | Operational Consistency | AR Coating Safety | Water Usage | TCO Profile |
|---|---|---|---|---|
| Manual Brush | Low (Variable) | High Risk (Abrasion) | High (Water-based) | High OPEX; High Risk |
| Semi-Automatic (e.g., HELYX) | Moderate | High (Low pressure) | Zero (Waterless) | Balanced; Ideal for Distributed Sites |
| Fully Automatic (e.g., GLYDE/NYUMA) | Very High | High (Controlled) | Zero (Waterless) | Higher Capex; Lowest Long-term OPEX |
The TCO calculation must also factor in the cost of water logistics. In arid regions like Rajasthan, the expense of sourcing, storing, and transporting water for cleaning can exceed the actual cost of labor. By switching to waterless robotic systems, operators eliminate the water-related cost center entirely, while concurrently boosting annual yield by preventing the prolonged soiling buildup that typically occurs during the gap between manual cleaning cycles.
Integrating automation into your O&M procurement
The integration of autonomous cleaning robots into a utility-scale plant should be treated as a strategic procurement decision rather than a simple BOS addition. For plant managers looking to optimize their performance ratio (PR), the procurement phase must verify three critical pillars: hardware durability, software compatibility, and service scalability. As discussed in our Solar Panel Maintenance Checklist 2026, an automated system is only as effective as its integration with the plant SCADA. Procuring hardware that lacks an intelligent NECTYR-like fleet management portal leaves the operator blind to real-time performance impacts, effectively negating the benefits of the automation investment.
When shortlisting suppliers, focus on the following procurement criteria to ensure your sunlight panels remain protected:
- Tracker Compatibility: Ensure the robot body articulation is rated for your specific tracker type, such as the flexible bridge requirements for single-axis trackers found in the GLYDE-X or NYUMA-X series.
- Environmental Robustness: Confirm IP ratings (typically IP65) and thermal operating ranges, ensuring the equipment is tested for the high-heat, high-dust environments prevalent in Indian utility sites.
- Service and Support SLAs: Automation requires a commitment to uptime. Evaluate the supplier’s regional manufacturing and warehouse footprint, Taypro, for instance, operates 8+ warehouses across India to minimize response times for critical spares.
- Predictive Intelligence: Prioritize systems that allow for data-driven cleaning cycles based on local irradiance levels rather than static, time-based schedules.
By moving from reactive maintenance to a data-driven, autonomous model, asset owners can achieve a higher return on their initial investment. The transition to waterless robotic operations has already demonstrated significant industry impact, with over 188 GWh of additional generation recovered and 700 million liters of water saved annually across Taypro-serviced sites. This shift is not just an efficiency gain; it is a fundamental shift in how utility-scale solar is operated, turning sunlight panels from a static asset into an actively managed and optimized generation engine.
Key takeaways for plant managers
- Monitor PR, not just schedules: Trigger cleaning cycles based on real-time performance drops of 2% to 3% to maximize the economic efficiency of your maintenance spend.
- Choose based on geography: Select cleaning technologies that match your local pollutant profile, opting for dual-pass microfiber or single-pass PBT brushes based on the stickiness and abrasion profile of your local dust.
- Standardize to protect panels: Automate cleaning to ensure uniform pressure across module surfaces, significantly reducing the risk of AR coating wear associated with manual brushes.
- Audit your TCO: Factor in the hidden costs of water logistics, labor turnover, and potential module degradation when comparing CAPEX-heavy automation against traditional manual O&M.
Frequently asked questions
Effective soiling mitigation at utility-scale sites in India requires a transition from reactive, calendar-based cleaning to data-driven, autonomous operations. By aligning cleaning frequency with real-time soiling levels, operators can protect the performance ratio (PR) of their assets across varying environmental conditions.
The most effective strategy involves integrating real-time soiling monitoring with automated cleaning systems. Optimal cleaning cycles depend on local profiles, ranging from 7 to 15 days in high-dust regions like Rajasthan to 30 to 45 days in coastal areas. Moving away from reactive, manual methods helps stabilize your performance ratio while reducing long-term operational expenses and potential cell degradation.
For utility-scale projects, waterless robotic cleaning is superior to manual methods. It eliminates water consumption entirely and can cut total operational expenses by 30% to 50%. Manual cleaning is often inconsistent, leading to uneven results, whereas automated robotic solutions provide precise, frequent maintenance that ensures maximum light absorption and protects the long-term integrity of your sunlight panels.
High ambient humidity, common in coastal regions, causes airborne pollutants and moisture to form stubborn deposits on sunlight panels. These layers are more difficult to remove than dry dust found in arid zones. Consequently, operators must implement frequent, data-backed cleaning schedules to prevent these adhesive layers from hardening, which protects the modules from physical degradation and significant revenue loss.