Quick answer: Budgeting for utility-scale solar
For utility-scale solar asset owners in India, the photovoltaic panels price accounts for the largest slice of your initial CAPEX, typically between 50% and 60% of total plant costs. Managing the lifetime budget requires balancing this high upfront hardware investment with the recurring operational expenses needed to maintain a high performance ratio (PR) over 25 years.
Average cost of a 1 MW utility-scale solar plant in India ranges from ₹4 crore to ₹5 crore, with modules accounting for 50-60% of total CAPEX.
Annual O&M budgets should allocate 1-3% of total setup costs (approx. ₹5-8 lakhs/MW) to maintain performance ratios.
Unmanaged soiling in Indian dry belts can lead to generation losses of 15-25% in a single quarter, significantly eroding ROI.
Automated waterless robotic cleaning improves energy output by 5-8% compared to manual methods, providing a 6-8 year payback period.
Current trends in photovoltaic panels price and CAPEX breakdown

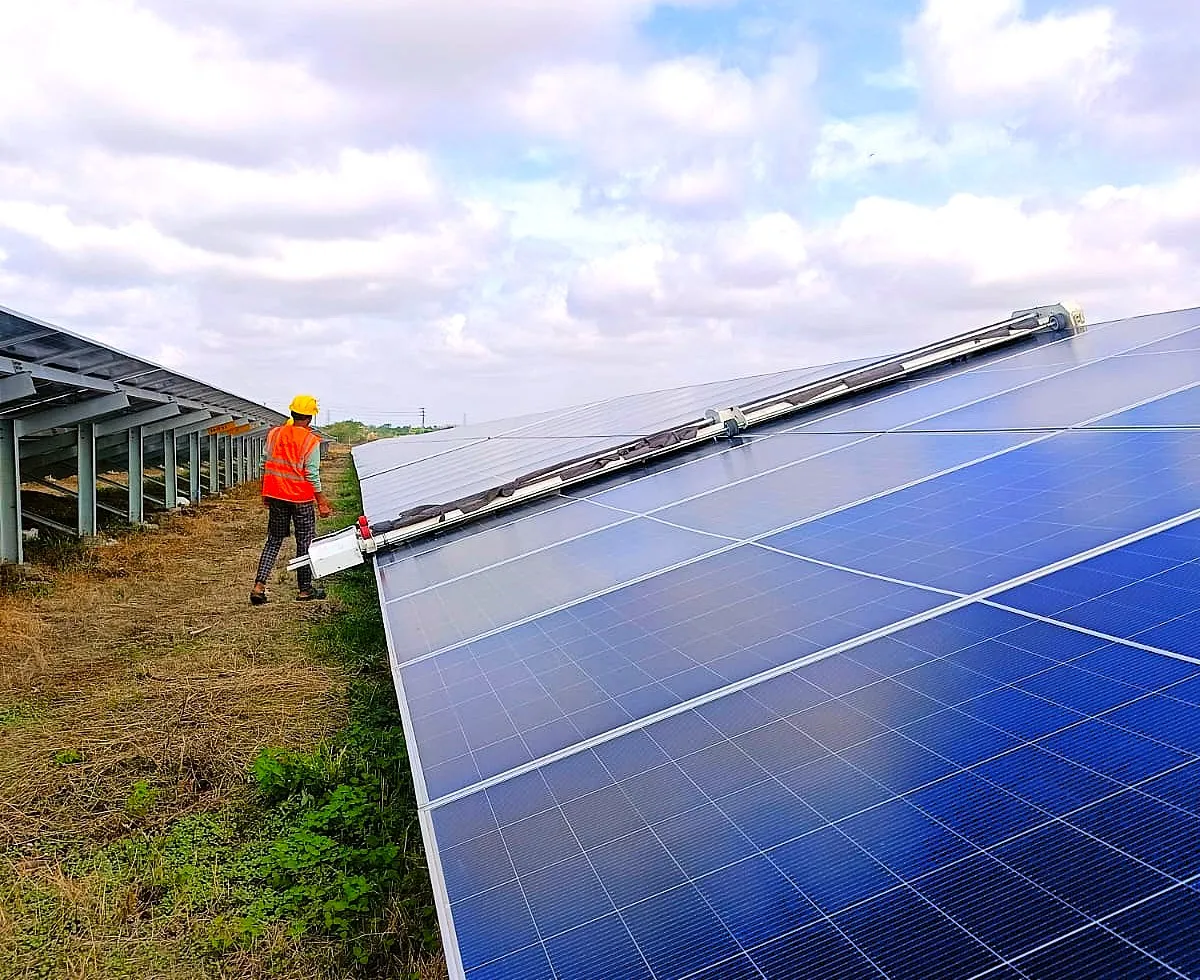
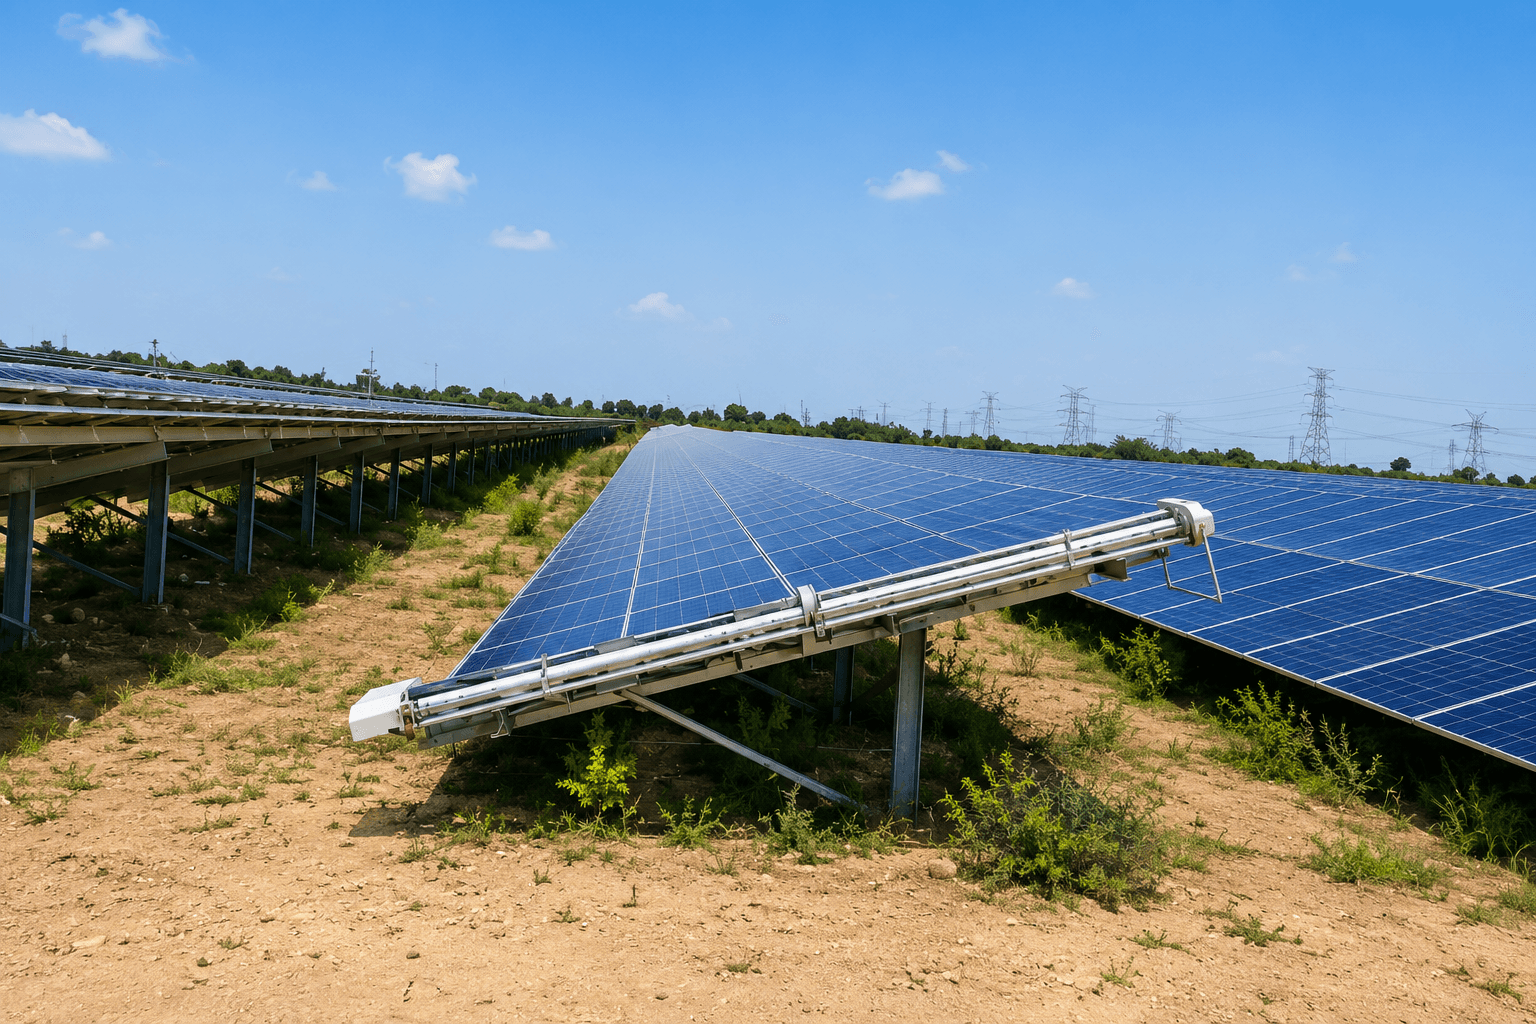
Photovoltaic Panels Price: Per-MW Budget Lines Indian Asset Owners Use, Product/page preset (cleaningTech): Taypro dual-pass waterless solar panel cleaning technology at a utility-scale solar site in India
The landscape for photovoltaic panels price in India is characterized by rapid technological shifts and significant price deflation. As of 2026, asset owners are seeing a continued transition toward high-efficiency Mono PERC and TOPCon modules. While the primary hardware cost has seen a notable reduction of nearly 40.7% in recent cycles, the total cost per MW is increasingly influenced by balance-of-system (BOS) components and, more critically, the long-term O&M strategy defined during the commissioning phase.
When you analyze a 1 MW project budget, the module cost is only the beginning of your financial exposure. Asset owners must look beyond the initial purchase price to consider the total cost of ownership (TCO). In regions prone to high dust accumulation, the decision to invest in an automatic solar panel cleaning system or a manual cleaning crew becomes a defining factor in your annual OPEX. If you are comparing equipment models, utilize our solar panel cleaning robot price calculator to determine how your selected module type and site soiling rate impact your long-term revenue.
Infrastructure integration is no longer an afterthought. Asset owners currently favor sites that plan for waterless cleaning infrastructure in the initial EPC scope. By integrating systems like our GLYDE or NYUMA robots early, you reduce the long-term labor costs associated with manual brushing and the high water consumption penalties associated with traditional cleaning methods. Modernizing your O&M approach at the time of procurement ensures that your chosen modules maintain their warranted efficiency throughout their lifespan, rather than suffering from premature degradation caused by abrasive cleaning brushes or water-induced mineral deposits.
How does soiling loss impact your O&M budget per MW?
For utility-scale assets in India, soiling is the most volatile variable in your OPEX budget. While the photovoltaic panels price determines your initial outlay, daily performance degradation acts as a silent tax on your revenue. In India’s dust-heavy regions, including the arid belts of Rajasthan and Gujarat, performance ratio (PR) losses due to dust accumulation can reach 0.6% daily. Without a proactive intervention strategy, a plant can lose 15–25% of its potential generation in a single dry quarter.
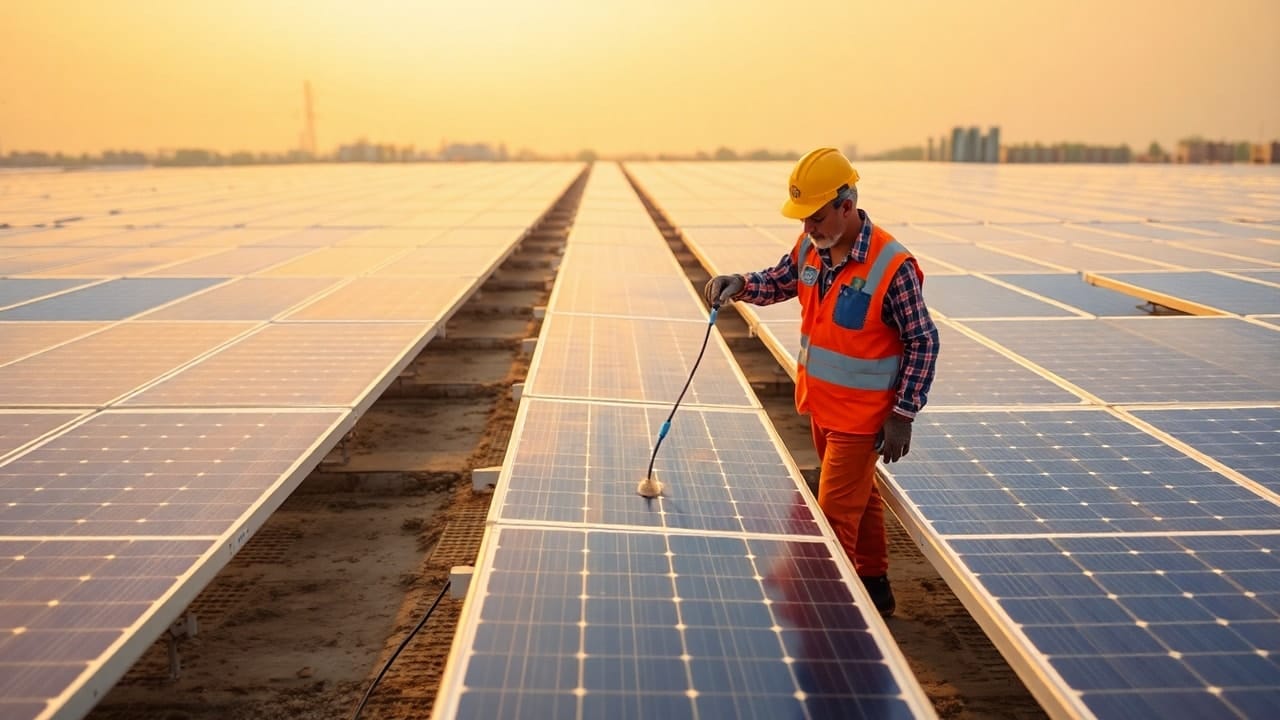
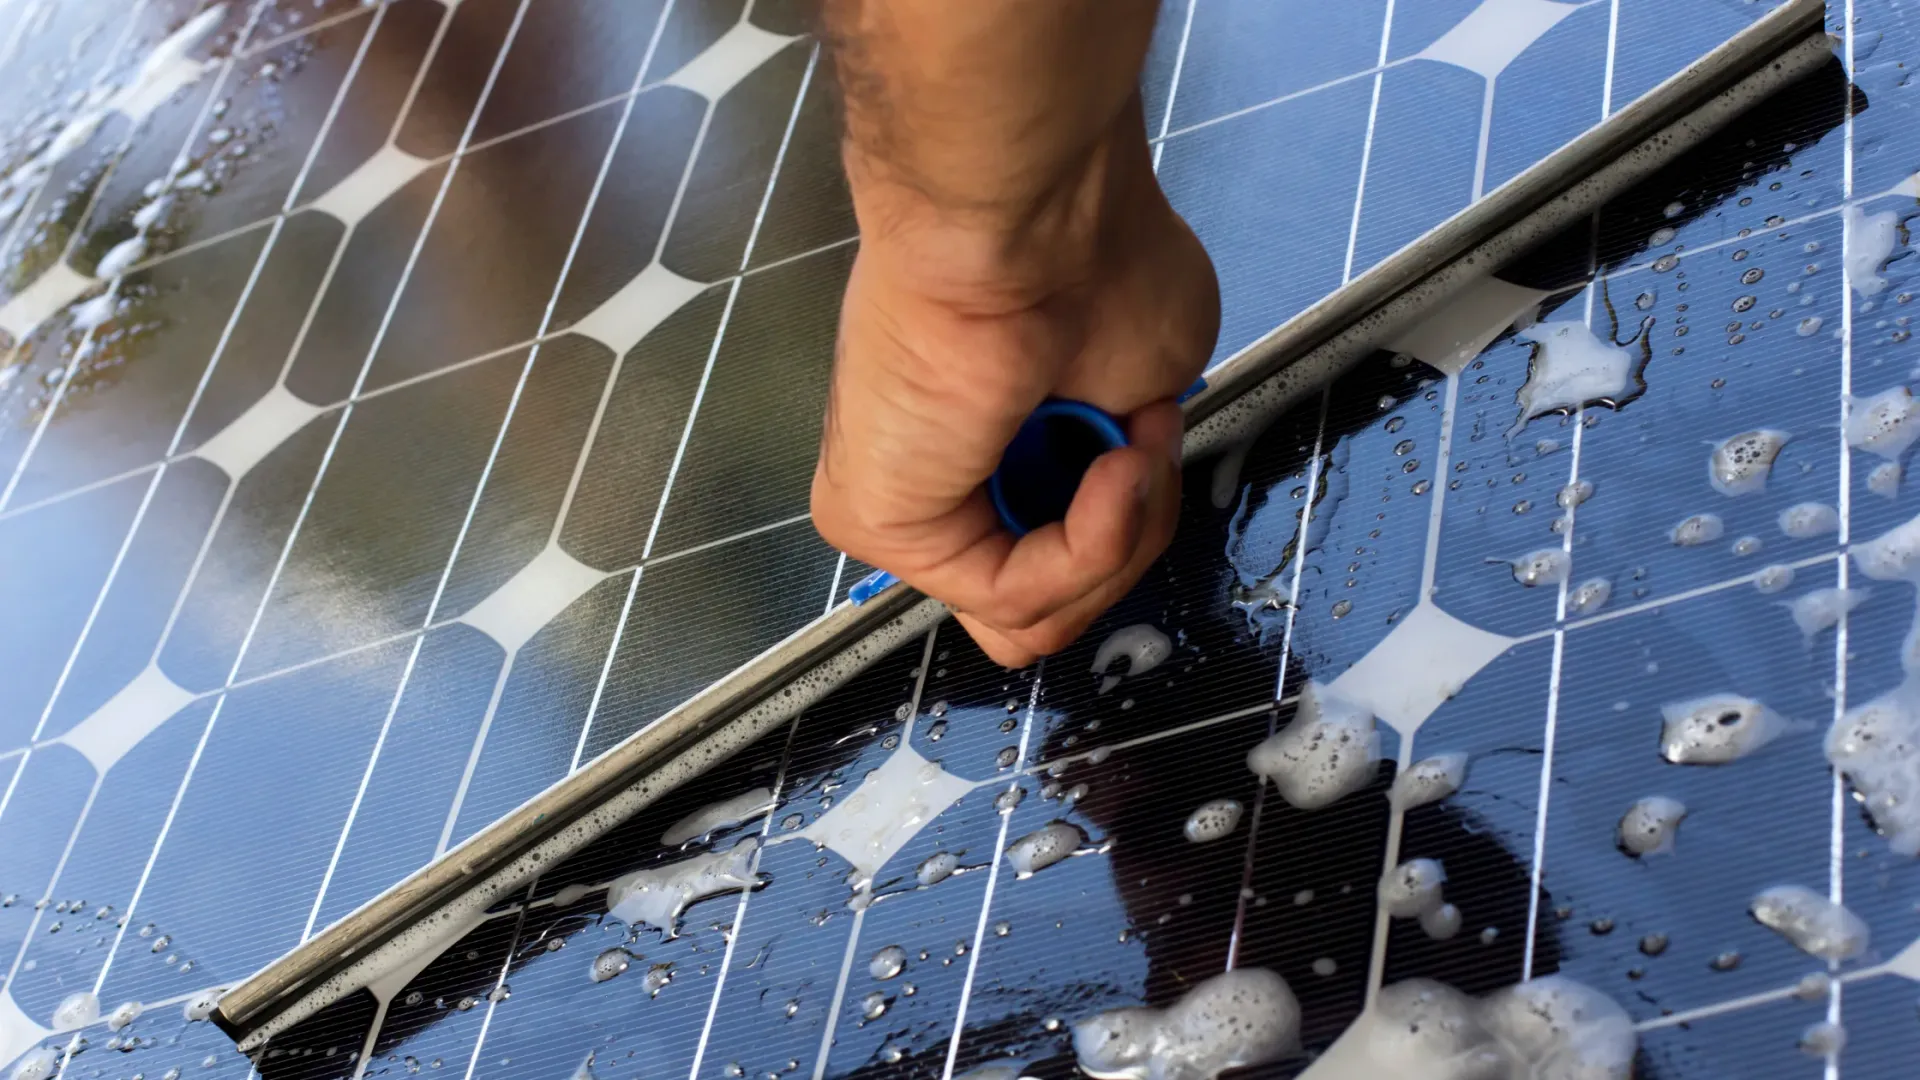
When you break down the budget, manual cleaning is often deceptively expensive. Asset owners frequently underestimate the indirect costs of traditional labor: water logistics in arid zones, potential micro-cracking of cells from abrasive brush pressure, and the extended time-to-clean which leaves panels soiled for days. When soiling reduces output by even 5%, a 50 MW plant could lose millions of rupees in annual revenue, far outweighing the cost of the cleaning labor itself.
To quantify the risk, asset managers should look at the Cost of Energy (CoE) impact. A structured solar panel cleaning system prevents these losses by maintaining consistent PR. By shifting from reactive manual cycles to an automated automatic solar panel cleaning system, you stabilize your revenue stream against the predictable fluctuations of India’s seasonal dust storms.
Is a robotic cleaning system worth the investment for a 50MW+ site?
Yes, for utility-scale sites exceeding 50 MW, the transition to autonomous cleaning is typically justified by the reduction in labor intensity and the preservation of long-term module integrity. A 50 MW plant scale provides the density required to optimize the deployment of NYUMA or GLYDE robotic fleets, where the amortized cost per module is significantly lower than a recurring contract for manual brush crews.
The business case relies on three primary vectors: water savings, increased energy yield, and reduced O&M overhead. Industry-typical data indicates that automated cleaning systems can improve energy output by 5–8% in dusty environments. When you calculate the payback period, typically falling between 6 and 8 years for utility plants, the investment becomes a tool for risk mitigation. Our solar panel cleaning robot price calculator can assist in modeling your specific site conditions against these variables.
Metric | Manual Labor | Autonomous Robotic (Taypro Model) |
|---|---|---|
Annual PR Impact | Variable (High losses between cycles) | Consistent (Optimized via AI scheduling) |
Water Requirement | High (1–2 liters per panel/wash) | Zero (Waterless technology) |
Labor Intensity | High (Recurring headcount) | Low (Monitoring via NECTYR) |
Module Safety | Risk of micro-cracks (Manual brushes) | High (Microfiber/Soft-PBT contact) |
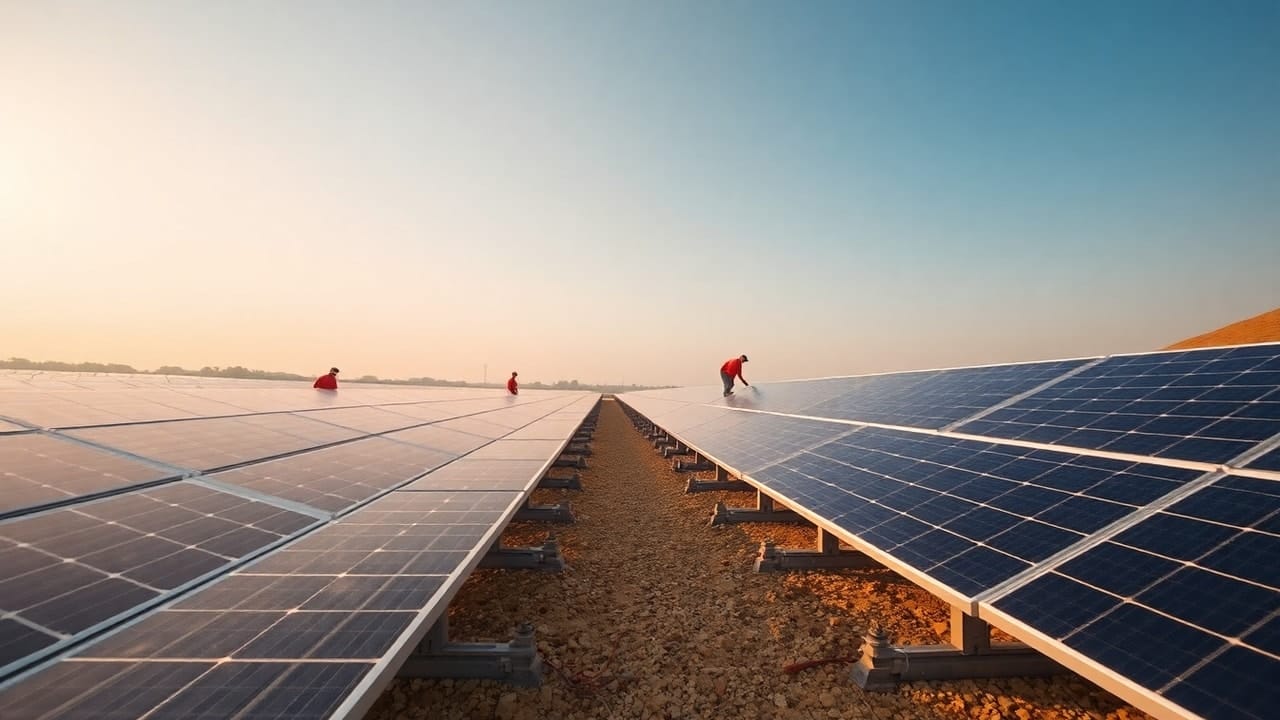
Operational trade-offs: Manual labor vs. automated waterless cleaning
For a utility-scale operator, the choice between manual crews and an automatic solar panel cleaning system is fundamentally a choice between variable operational expenditure (OPEX) and fixed performance assurance. Manual labor, while seemingly lower in entry cost, presents significant risks regarding water availability, module surface integrity, and the sheer logistics of coordinating large, decentralized teams across thousands of acres. In India, where utility-scale projects often span arid, water-stressed regions, the procurement of water for cleaning can become a hidden bottleneck, often requiring tanker fleets that further complicate plant logistics.
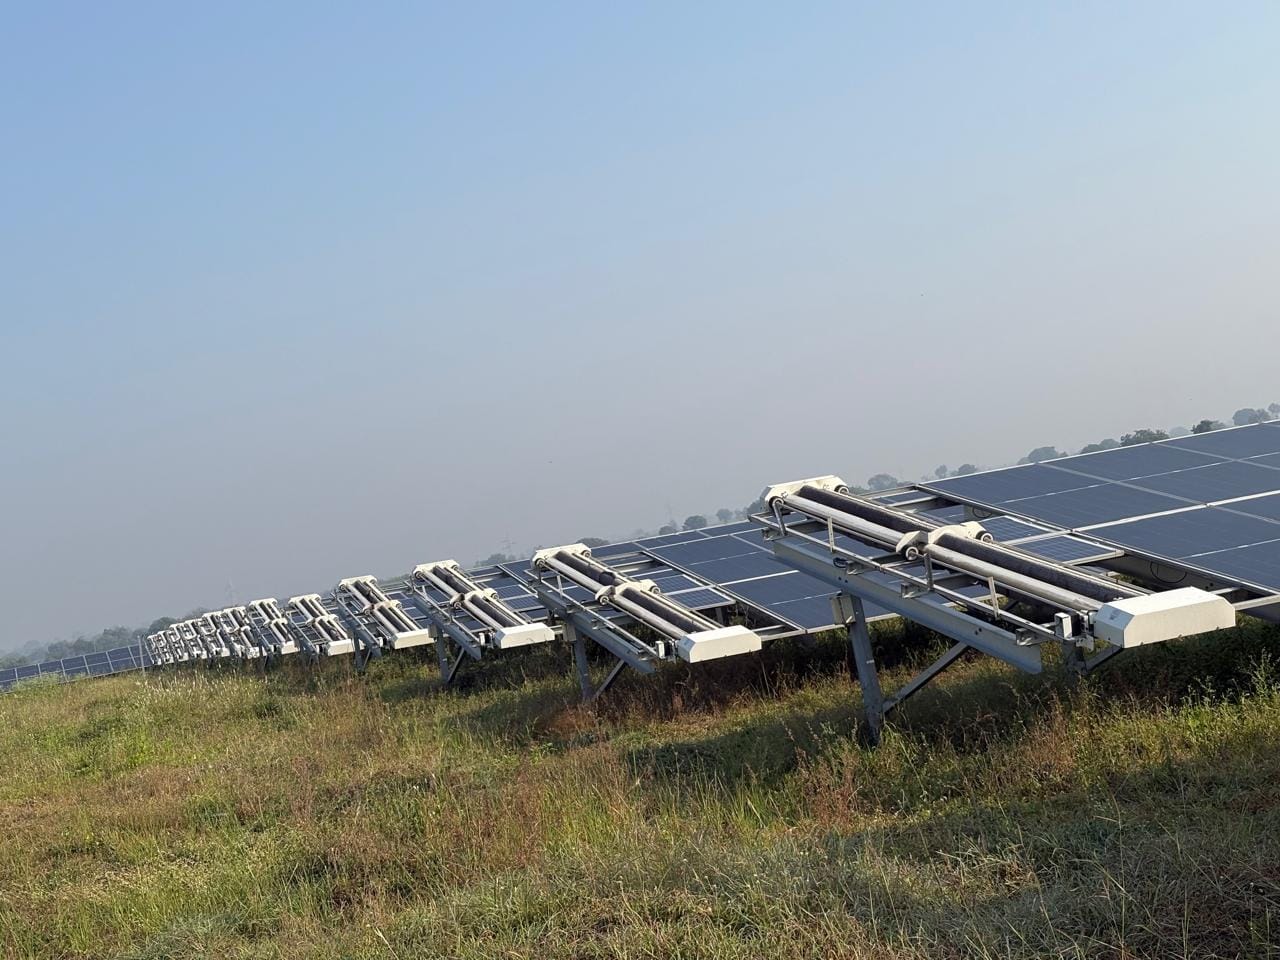
Automated systems, specifically our waterless robotic lines like NYUMA and GLYDE, eliminate these variables by operating on a programmed, high-frequency schedule. By utilizing dual-pass microfiber or high-efficiency PBT brushes, these robots ensure consistent cleaning quality that manual brushing rarely matches due to human inconsistency and fatigue. When analyzing the cost per MW, asset owners must factor in the degradation risk. Traditional manual brushing carries a higher probability of micro-cracks on cells caused by excessive physical pressure or abrasive materials. In contrast, autonomous systems offer controlled, non-abrasive contact designed to preserve the PV module's protective coatings over a 25-year lifespan.
Furthermore, the solar panel cleaning robot price calculator highlights that the ROI for robots is driven by the frequency of the cleaning cycle. Manual cleaning cycles are often limited by weather windows and labor costs, whereas robotic fleets can operate during low-yield periods or nights, ensuring maximum solar harvesting during peak daylight hours. For managers overseeing fleet operations, the integration of NECTYR software allows for real-time visibility into every robot's status, eliminating the uncertainty that comes with managing dispersed manual labor teams.
Integrating cleaning infrastructure into the initial EPC scope
The most cost-effective way to deploy robotics is to treat them as integral to the plant's structural design during the EPC phase, rather than a bolt-on expense after commissioning. By incorporating cleaning infrastructure at the design stage, you optimize the solar panel cleaning system for seamless compatibility with your chosen tracker or fixed-tilt structure. This includes essential preparations such as ensuring unobstructed row-to-row connectivity for autonomous movement, providing integrated power supply for charging, and mapping the plant layout for RF mesh network coverage.
Integrating at the EPC stage allows developers to amortize the cleaning infrastructure costs into the broader project CAPEX, often resulting in lower financing rates compared to retrofitting individual units into operating assets. When a plant is designed with robotic movement in mind, the installation of systems like the GLYDE-X for trackers becomes a standard technical spec rather than a late-stage field modification. This proactive approach ensures that the fleet of robots, whether deploying the 200+ units we manufacture monthly or standardizing across our 150+ current site deployments, performs with maximum uptime from day one.
Checklist for EPC-Integrated Cleaning
Path Clearance: Ensure consistent row-to-row transitions that accommodate the mechanical limits of the robot model (e.g., maximum terrain slope of 15° for fixed-tilt systems).
Power & Connectivity: Provision dedicated docking stations and ensure the site layout is compatible with the mesh network frequency required for the robot to communicate with the NECTYR fleet portal.
Tracker Compatibility: Confirm that the tracker's rotation range and structural integrity align with the specific requirements of NYUMA-X or GLYDE-X models.
Service Access: Design maintenance depots within the site layout for robot storage and battery management, reducing downtime during off-season cycles.
Monitoring Integration: Link the cleaning system's data outputs directly to the SCADA system to correlate cleaning frequency with generation yield improvements.
Key takeaways for plant managers and asset owners
Factor in long-term yield: Do not just look at the upfront photovoltaic panels price; look at the 25-year performance ratio impact caused by soiling, which can be reduced by 5–8% through automated cleaning.
Prioritize waterless technology: In water-scarce regions of India, waterless cleaning avoids the logistical nightmare and recurring costs of water transport, making it the most sustainable and cost-effective choice per MW.
Embrace the Opex-as-a-service model: If CAPEX constraints are significant, our dedicated Opex cleaning services provide a pay-per-clean solution that aligns costs with revenue generation.
Early integration: Engage with cleaning technology providers during the site design phase to ensure compatibility between your tracker hardware and the robotic cleaning fleet.
Use data to drive cycles: Move away from calendar-based cleaning to performance-based scheduling via NECTYR to minimize operational waste and maximize energy harvest.
Frequently asked questions
For utility-scale solar asset owners in India, the photovoltaic panels price accounts for the largest slice of your initial CAPEX, typically between 50% and 60% of total plant costs. Managing the lifetime budget requires balancing this high upfront hardware investment with the recurring operational expenses needed to maintain a high performance ratio (PR) over 25 years.
Annual operation and maintenance budgets for utility-scale solar plants should allocate between 1 and 3 percent of the total setup costs. In current market conditions, this equates to approximately ₹5 lakhs to ₹8 lakhs per megawatt annually. Consistent budgeting for these operational requirements is essential to maintain high performance ratios and protect the integrity of the initial hardware investment against environmental degradation.
Yes, automated waterless robotic cleaning significantly improves energy output by 5 to 8 percent compared to traditional manual cleaning methods. By integrating these systems, asset owners can achieve a payback period of 6 to 8 years. This technology ensures consistent module cleanliness, which is vital for maintaining the performance ratio and maximizing revenue generation throughout the lifetime of the solar farm.
The most significant factor causing power generation losses is unmanaged soiling, particularly in India's dry belts. Accumulated dust and debris on panel surfaces can lead to generation losses of 15 to 25 percent in a single quarter. If left unaddressed, these losses significantly erode the project return on investment, making effective cleaning strategies and waterless infrastructure critical components of a successful utility-scale asset management plan.