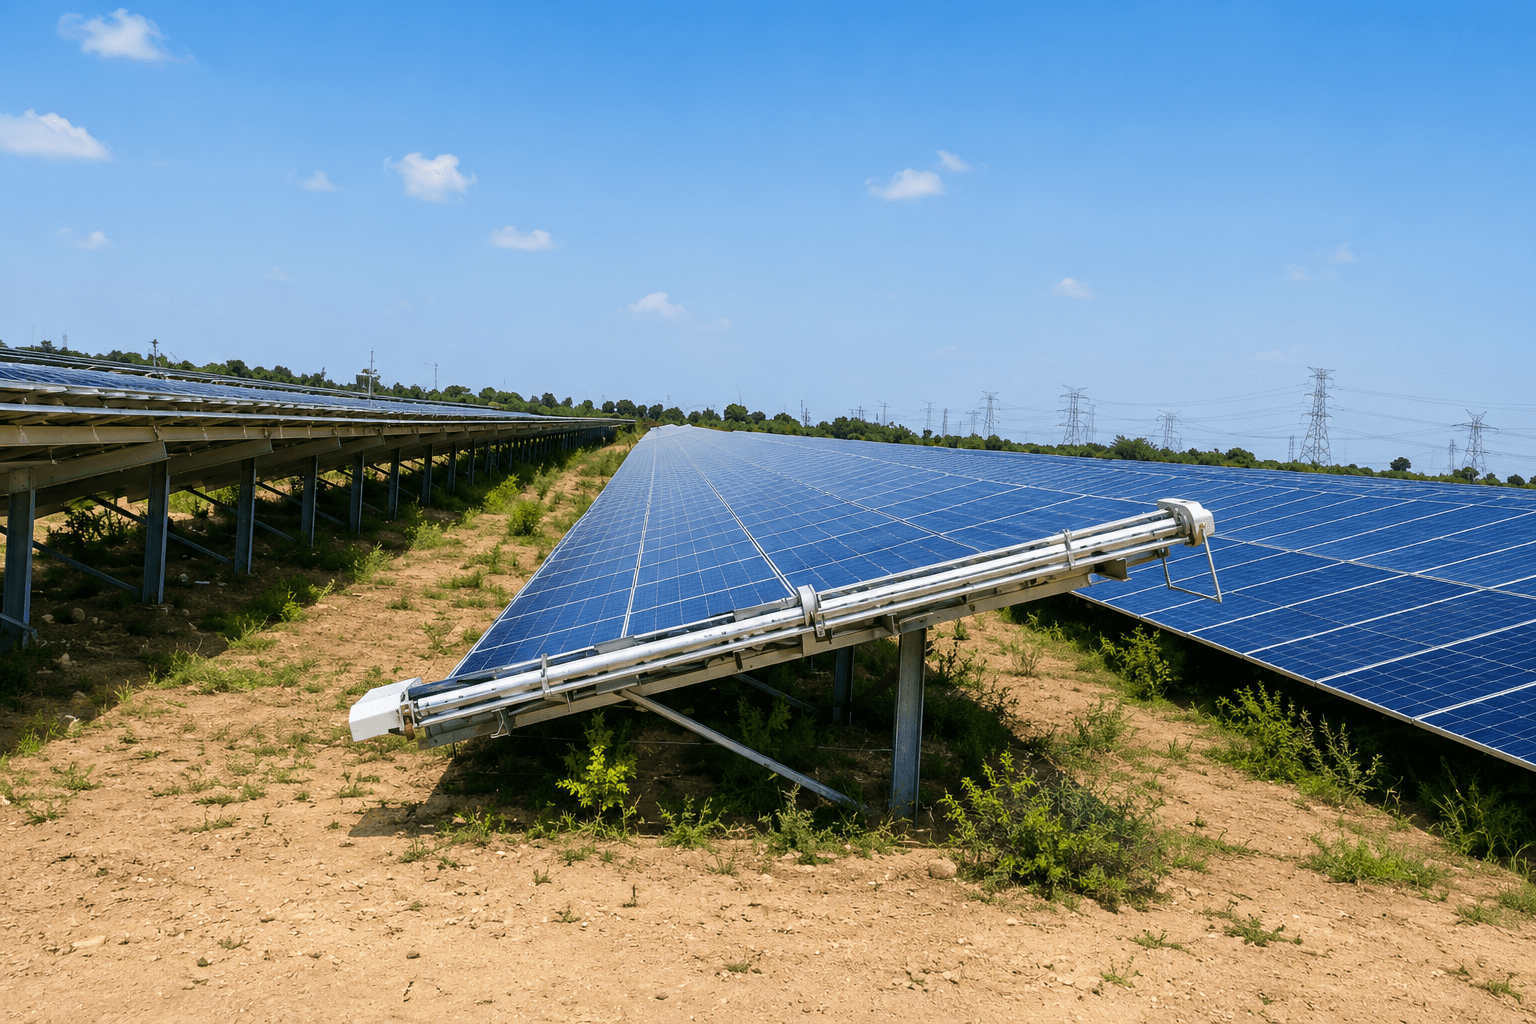
ESG frameworks can feel abstract on a 50 MW Rajasthan plant until you translate them into operations: Are you delivering the green MWh you modeled? Are you drawing groundwater to wash modules in a stressed district? Do contractors work safely at height and on live DC fields? Those are ESG questions wearing O&M uniforms.
Indian utility solar now sits inside lender covenants, corporate offtaker audits, and sustainability-linked loan KPIs. This article connects Environmental, Social, and Governance pillars to data plant managers already have, with emphasis on cleaning, water, and performance integrity.
Quick answer
- Environmental: delivered MWh, water per clean, land and dust impacts.
- Social: labour safety, local water competition, community dust from access roads.
- Governance: PR reporting honesty, vendor audits, incident logs, method changes.
- Soiling is performance integrity, not a footnote in investor decks.
- Pair narrative with carbon value of delivered and lost MWh.
Environmental: delivered energy, soiling, and water
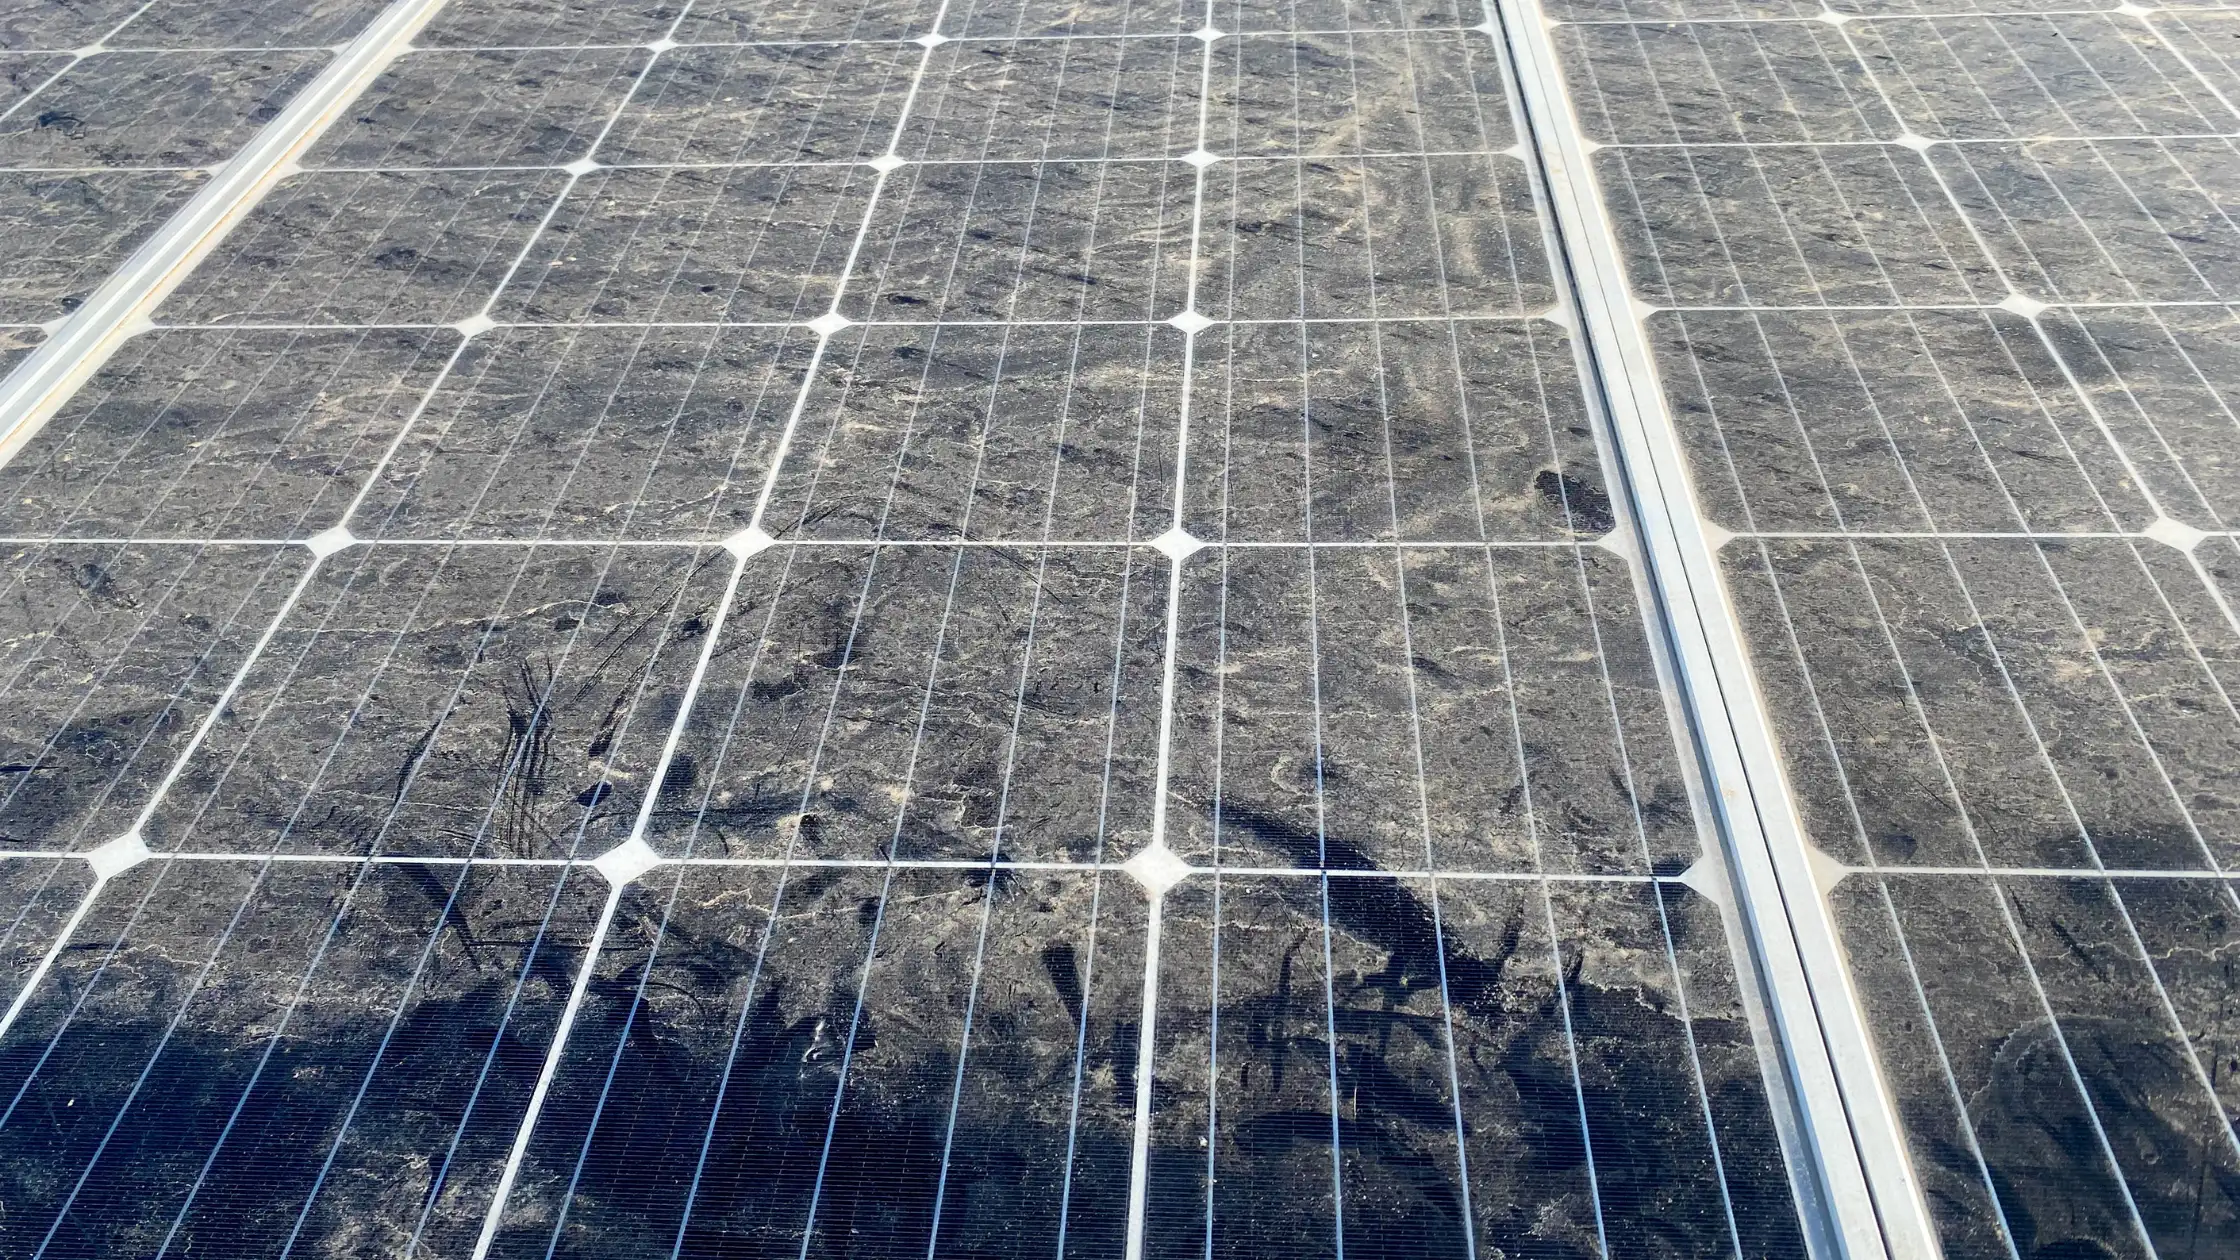
Environmental claims for solar rest on renewable MWh actually delivered. Soiling reduces output without changing the module brand on the sustainability report. If models assume quarterly cleaning and operations stretch to biweekly manual reality, undelivered MWh is both a revenue and environmental gap.
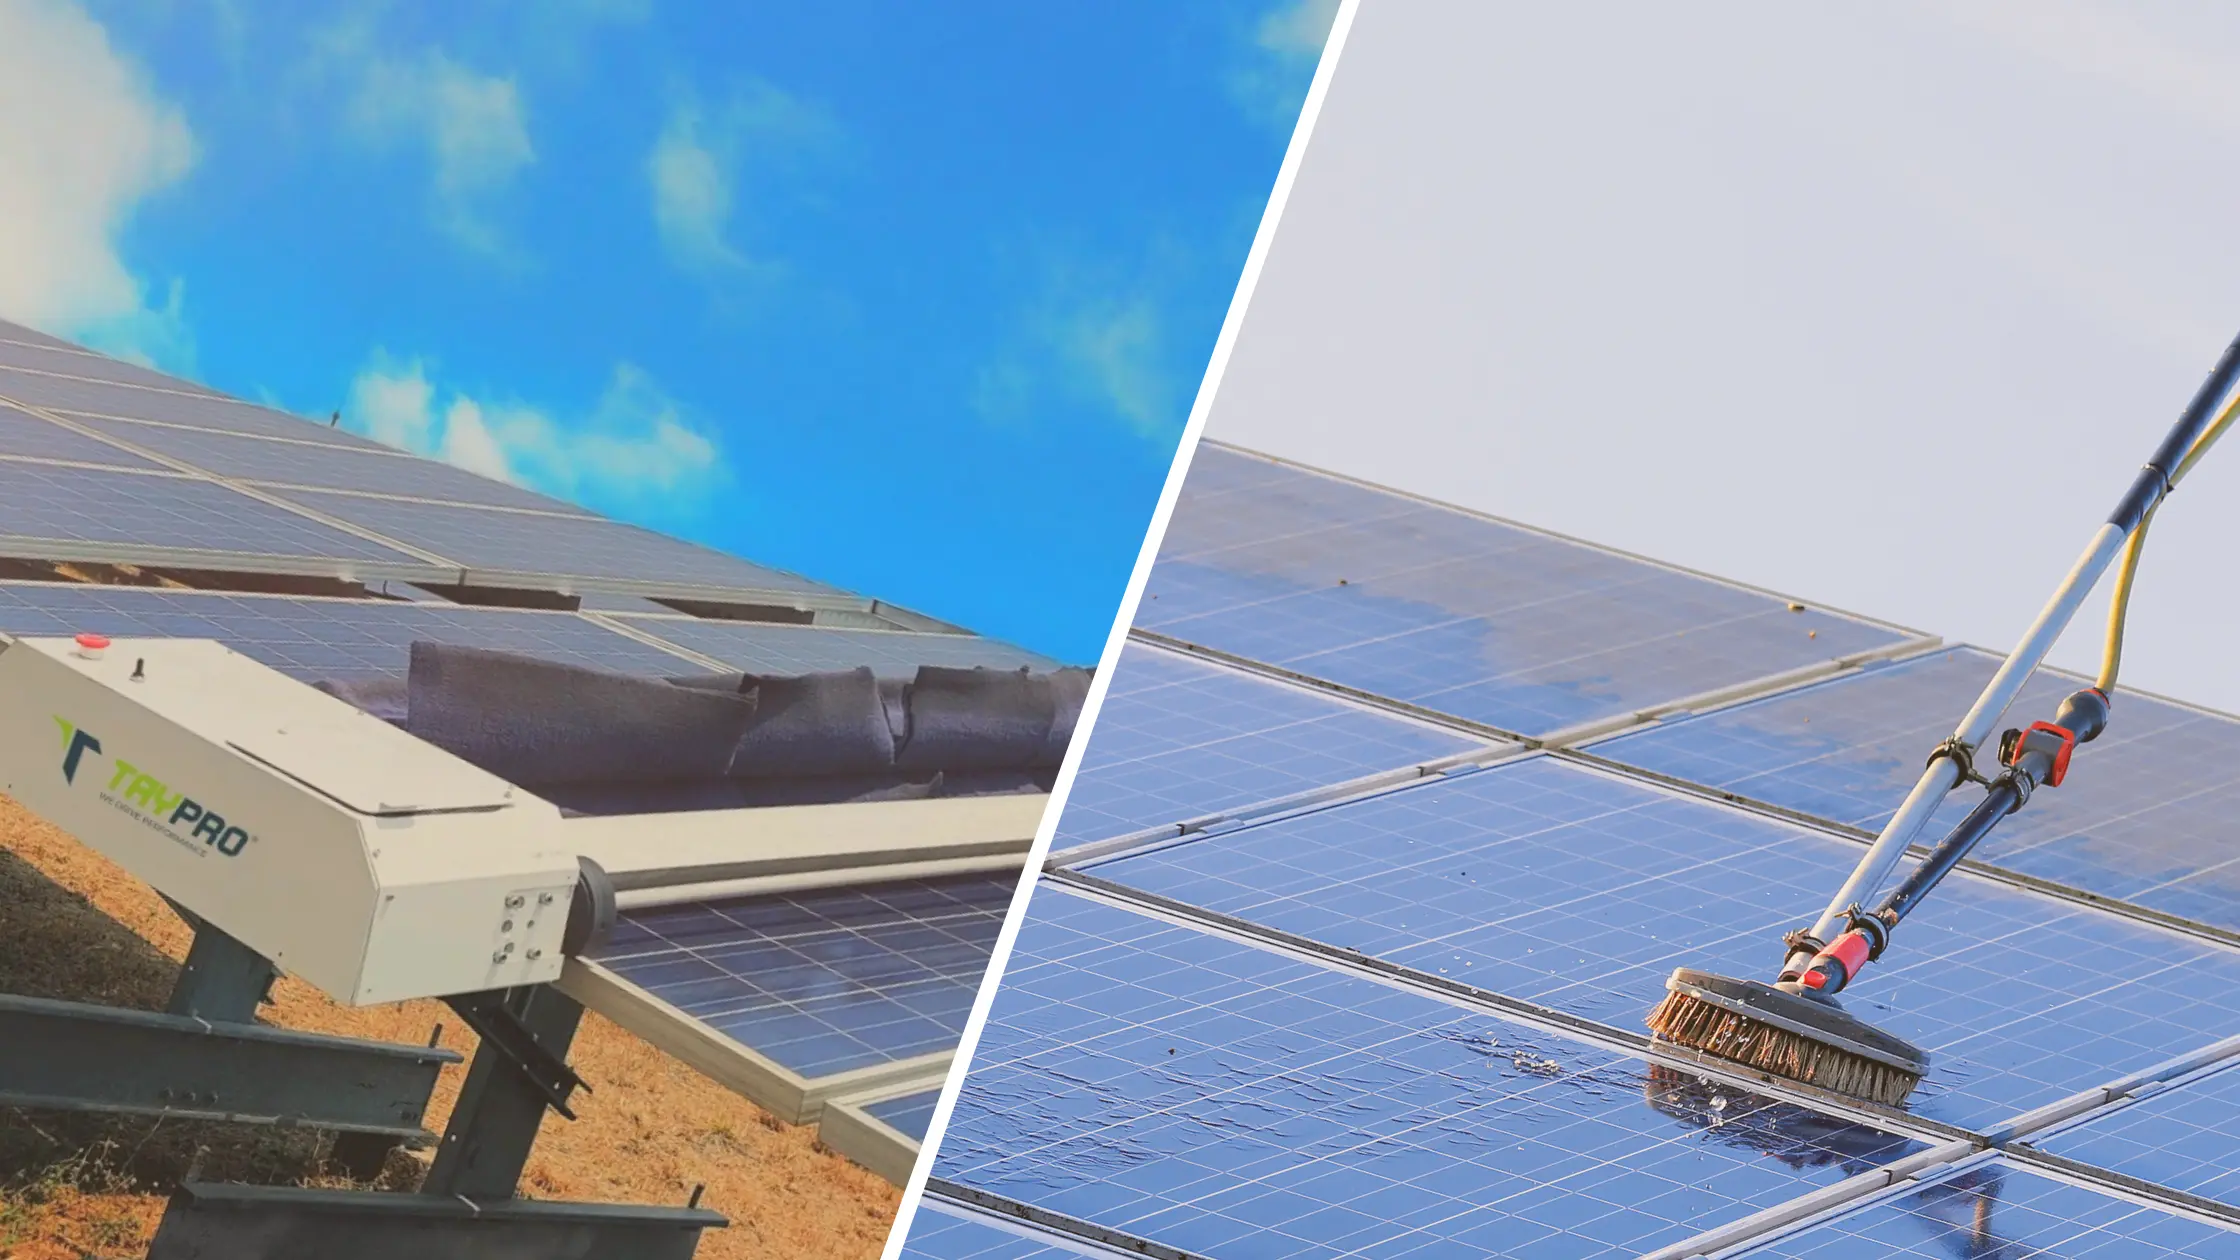
Water use is the second environmental flashpoint. Traditional wet cleaning consumes litres per module that ESG packs increasingly question where borewell depth fell since commissioning. Waterless methods reduce withdrawal and tanker traffic, supporting stronger water stewardship narratives.
| Environmental metric | Typical source | Why investors care |
|---|---|---|
| Delivered vs P50/P90 MWh | SCADA, third-party review | Proves green output integrity |
| Soiling attribution | Reference modules, PR models | Separates ops leakage from weather |
| Water per MW cleaned | Flow meters, tanker invoices | Stress district risk |
| Cleaning method changes | O&M records | Shows adaptive stewardship |
Illustrative impact: soiling and emissions (50 MW plant)
Assume 90 GWh annual generation at full PR, 3% average soiling loss from infrequent cleaning, grid factor near 0.82 kg CO2/kWh illustrative:
- Lost generation ≈ 2.7 GWh/year.
- Emissions not avoided ≈ 2,200 tonnes CO2e/year (order-of-magnitude).
- At internal carbon price ₹1,500/tonne illustrative ≈ ₹33 lakh narrative value.
Methodology must match your offtaker contract. The point: soiling is an emissions story, not only a rupee story.
Social: crews, communities, and water competition
Manual cleaning at scale employs large seasonal workforces. Social performance means trained contractors, harness rules on rooftops and trackers, fair payment terms, and incident reporting. Undocumented daily wage cycles without safety oversight create social risk that surfaces in audits after accidents, not before.
Community interfaces include dust from access roads during dry season, tanker traffic past villages, and competition for water where agriculture shares aquifers. Waterless robotic programs can reduce tanker load when validated, but introduce job displacement questions. Honest ESG reporting addresses trade-offs rather than claiming robots solve every social dimension.
Governance: data you can defend
Governance is whether leadership knows true plant performance and discloses it consistently. Investors punish surprises more than modest shortfalls explained with corrective action.
| Governance artifact | Minimum content |
|---|---|
| Monthly PR pack | PR vs budget, soiling vs curtailment split |
| Cleaning logs | Dates, blocks, method, water litres if wet |
| Robot pass exports | Row coverage after dust events |
| Vendor audits | Safety, insurance, labour compliance |
| Module OEM cleaning approval | Filed method statements |
Connect to PR calculation discipline and monitoring beyond cleaning.
Cleaning method changes as ESG events
Switching from wet manual to waterless robots is an operational and disclosure event. Document:
- Baseline water withdrawal year before change.
- Pilot PR and pass coverage evidence.
- Post-change water and delivered MWh comparison.
- Workforce transition plan for manual contractors.
Robotic cleaning without measured gains is optics. Traditional vs robotic comparison helps structure before/after narratives.
What plant managers should report upstream
- Shortfall MWh explained: curtailment vs soiling vs inverter vs tracker.
- Cleaning method and any major method change with dates.
- Major dust events and hours-to-response.
- Water litres per MW per year (wet sites).
- Safety incidents and near-misses on cleaning campaigns.
Asset management can aggregate into annual sustainability packs without asking operators to learn GRI codes overnight.
ESG and thin PPAs: same math, different audience
When tariff is ₹2.80–3.50/kWh, lost MWh from soiling hurts EBITDA and weakens green delivery claims simultaneously. Offtakers buying bundled renewable attributes care that delivered MWh match schedules. Cleaning is a governance control like inverter maintenance, not a discretionary garden hose activity.
Read importance of cleaning at MW scale and utility O&M overview.
ESG frameworks Indian IPPs encounter
Utility owners report through multiple lenses: lender environmental covenants, corporate offtaker supplier questionnaires, and voluntary standards such as GRI-aligned sustainability packs. You do not need to master every framework to improve disclosures. Map plant data once:
| Framework question theme | Plant data source |
|---|---|
| Renewable output integrity | SCADA MWh vs model, PR splits |
| Water stewardship | Litres per MW cleaned, source type |
| Occupational safety | Cleaning incident logs, training records |
| Supply chain governance | Contractor audits, insurance verification |
When offtakers ask about "green MWh integrity," soiling explanation belongs in the same paragraph as curtailment and outage attribution. Hiding soiling inside generic "weather variance" erodes trust in governance scores.
Board and lender conversations
Translate operations to risk language executives use:
- Revenue risk: undelivered MWh from avoidable soiling at contract tariff.
- Permit risk: water withdrawal scrutiny in stressed districts.
- Reputational risk: safety incidents on manual cleaning campaigns.
- Refinance risk: technical advisor questions on PR trends vs model.
Waterless robotic programs can address water and throughput themes simultaneously when pilot data supports claims. Present before/after water litres and PR on identical blocks, not vendor projections alone.
Annual sustainability pack template for plant managers
Asset management can request this one-page monthly rollup from each site:
- Delivered MWh vs budget; split curtailment / outage / soiling explanation.
- Cleaning method, total passes, litres per MW if wet.
- Reference module soiling trend or PR vs clean baseline chart.
- Safety incidents and near-misses on cleaning work.
- Major method or contractor changes with effective dates.
Consistency across Rajasthan and Gujarat sites lets group sustainability officers defend narratives without site-by-site fire drills before offtaker audits. Carbon pricing context adds executive framing for undelivered MWh.
Third-party assurance and lender technical advisors
Refinancing and green bond allocations increasingly use independent technical advisors who ask for raw SCADA exports, not PowerPoint summaries. Prepare annual data room folders: PR monthly series, cleaning logs, water invoices, safety records, and robot pass exports if applicable. Gaps in cleaning documentation read as governance weakness even when generation is strong.
When advisors flag PR below model, respond with attributed splits and corrective action dates. "We will clean more" without method change or budget approval fails credibility. Waterless vs water-based comparisons support method-change memos to credit committees.
Social license and local water narratives
Community relations teams should align with O&M on water stories before local media visits. If tankers run daily during drought headlines, prepare data on litres per MWh delivered and any shift to waterless methods. Proactive disclosure beats reactive crisis calls.
Linking ESG to annual O&M budget reviews
When budget committees cut cleaning lines, sustainability officers should show simultaneous impact on delivered MWh and water metrics. Integrated review prevents siloed decisions that look like savings but erode green output claims.
Key takeaways
- ESG on solar plants is delivered MWh, water, safety, and honest PR reporting.
- Soiling loss belongs in sustainability narratives as performance leakage.
- Waterless cleaning can strengthen environmental metrics when measured.
- Governance requires logs, splits, and vendor audits, not slogans.
- Quantify lost MWh in emissions terms for board and offtaker conversations.
ESG packs for solar should show water use, cleaning coverage, and delivered MWh integrity together. Isolated green claims invite auditor questions.
Related reading
Frequently asked questions
Cleaning restores delivered MWh, which supports avoided-emissions claims tied to actual output. Water-intensive cleaning in stressed regions creates environmental and social trade-offs that sustainability reports should disclose alongside generation integrity.
Delivered versus modeled energy, curtailment separated from soiling, water use per MWh cleaned, safety incidents on site, contractor labour practices, and documented cleaning method changes over the asset life.
It can reduce water withdrawal and improve delivered renewable output when adopted with measured PR gains. Buying robots without pass logs and performance proof is green capex without green outcomes.
Yes, as operational leakage between modeled and actual green output. It demonstrates governance of performance integrity and honest reporting to offtakers and lenders.
Multiply lost MWh by your grid emission factor or contracted green attribute methodology. On a 50 MW plant, 3% annual soiling loss can represent thousands of tonnes of CO2 equivalent in undelivered avoided emissions. Pair with carbon pricing context for board narratives.