Manual versus robotic solar cleaning debates often stall on capex sticker shock while ignoring MWh left on the table during slow storm recovery. Indian utility owners need a single ROI frame: five-year fully loaded cost against recovered energy at the PPA tariff, with water and labour inflation included. Without that, boards approve the cheaper AMC and wonder why PR drifts every May.
This article walks through ROI evaluation for manual wet cleaning services versus robotic waterless programs on 10–100 MW plants, with illustrative tables, sensitivity logic, and links to deeper method comparisons.
Quick answer
ROI = recovered MWh value minus five-year TCO, not capex alone.
Manual: lower upfront, higher water and cycle-time risk.
Robot: higher capex/lease, wins on throughput and water.
Pilot PR data beats vendor default recovery claims.
Stress-test uptime at 70%, 85%, and 95% for robots.
Define the ROI numerator and denominator
Benefit side: incremental MWh from cleaning × PPA tariff (or merchant capture price), plus optional water savings and avoided labour surge premiums where quantifiable.
Cost side: all cleaning spend over five years including mobilization after storms, supervision, insurance, robot depreciation or lease, spares, and training. Exclude unrelated O&M like inverter repairs.
Normalize PR using reference strings or soiling stations so inverter outages do not fake cleaning benefit.
Manual wet service cost drivers
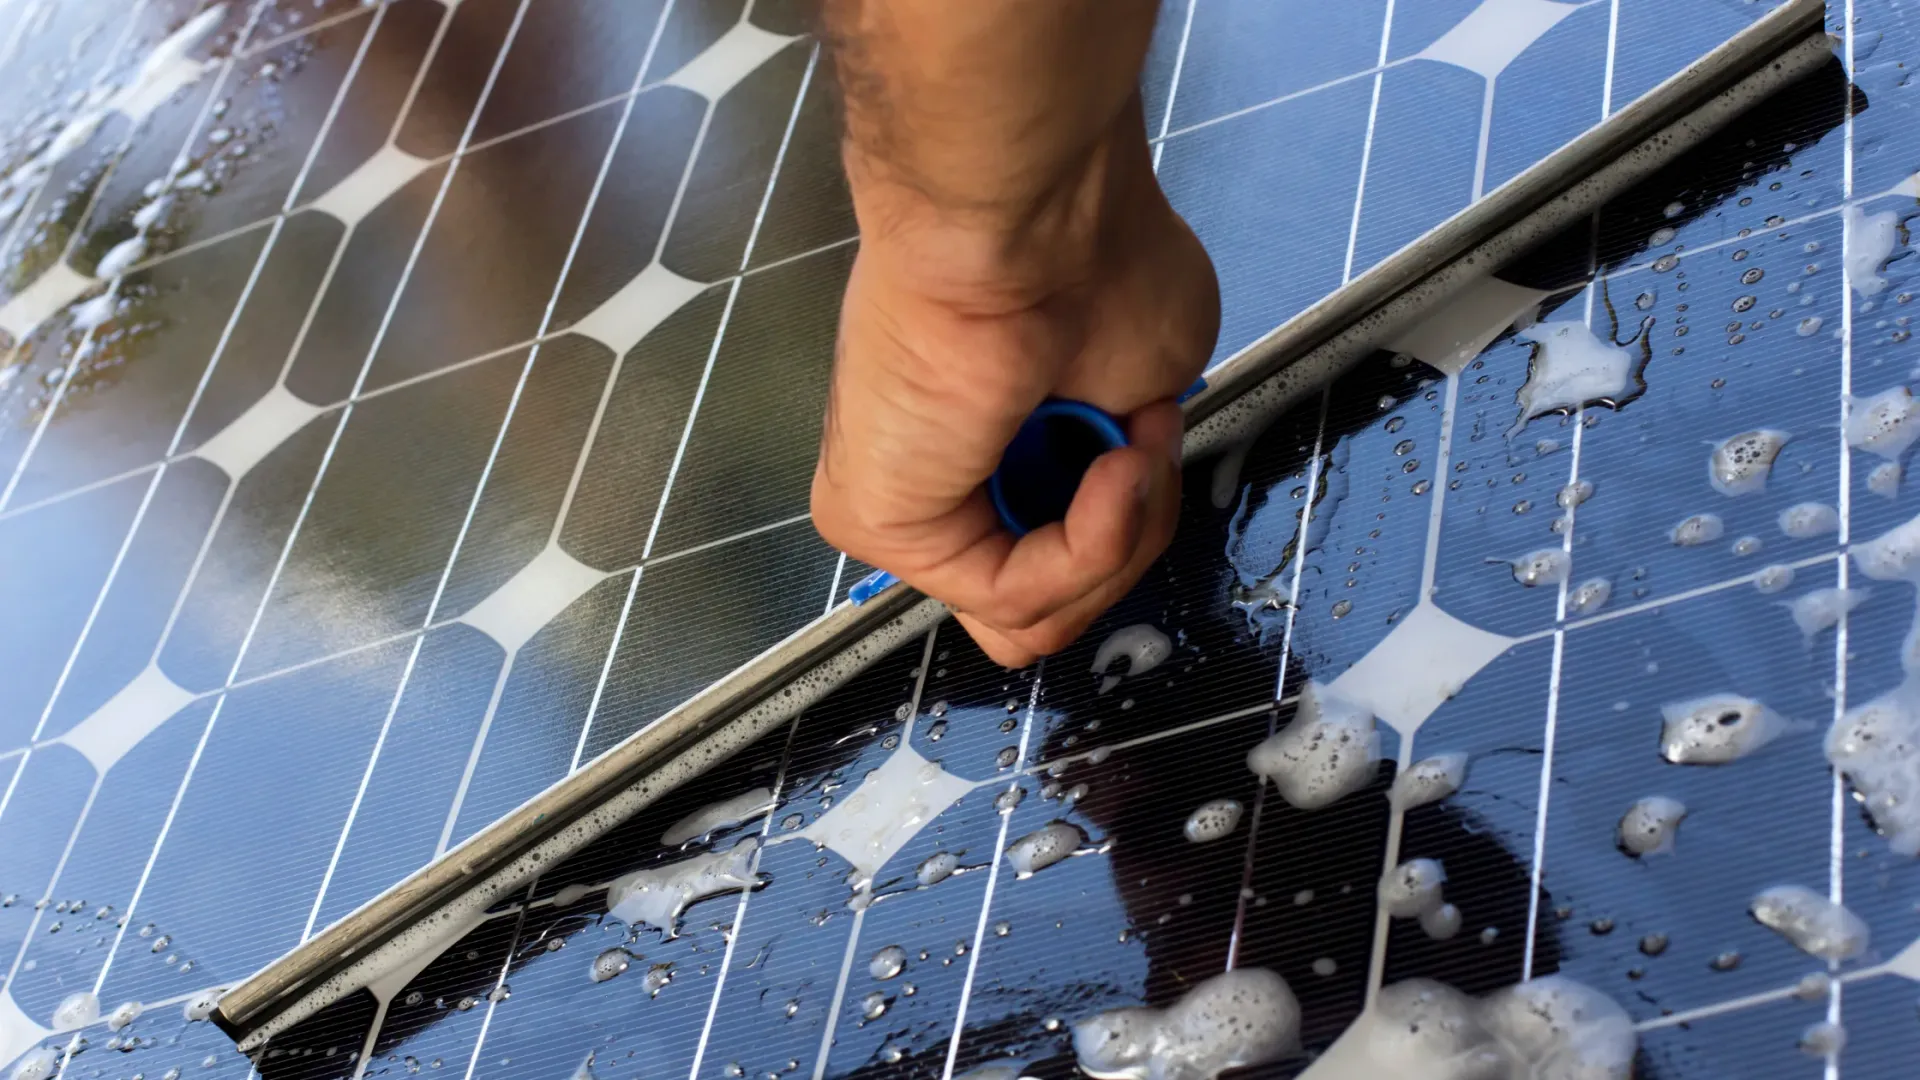
Manual programs bill as AMC per MW, per pass, or hybrid. Hidden costs include tanker water in Rajasthan, night/weekend surge rates, rework after stripe cleaning, and PR loss while waiting for crew mobilization. Industry patterns on 25–50 MW plants show full-plant manual cycles of 7–14 days in moderate dust, longer after severe events.
Labour inflation of 6–8% annually compounds on crew-heavy scopes. Model it explicitly in five-year TCO.
Robotic waterless service cost drivers
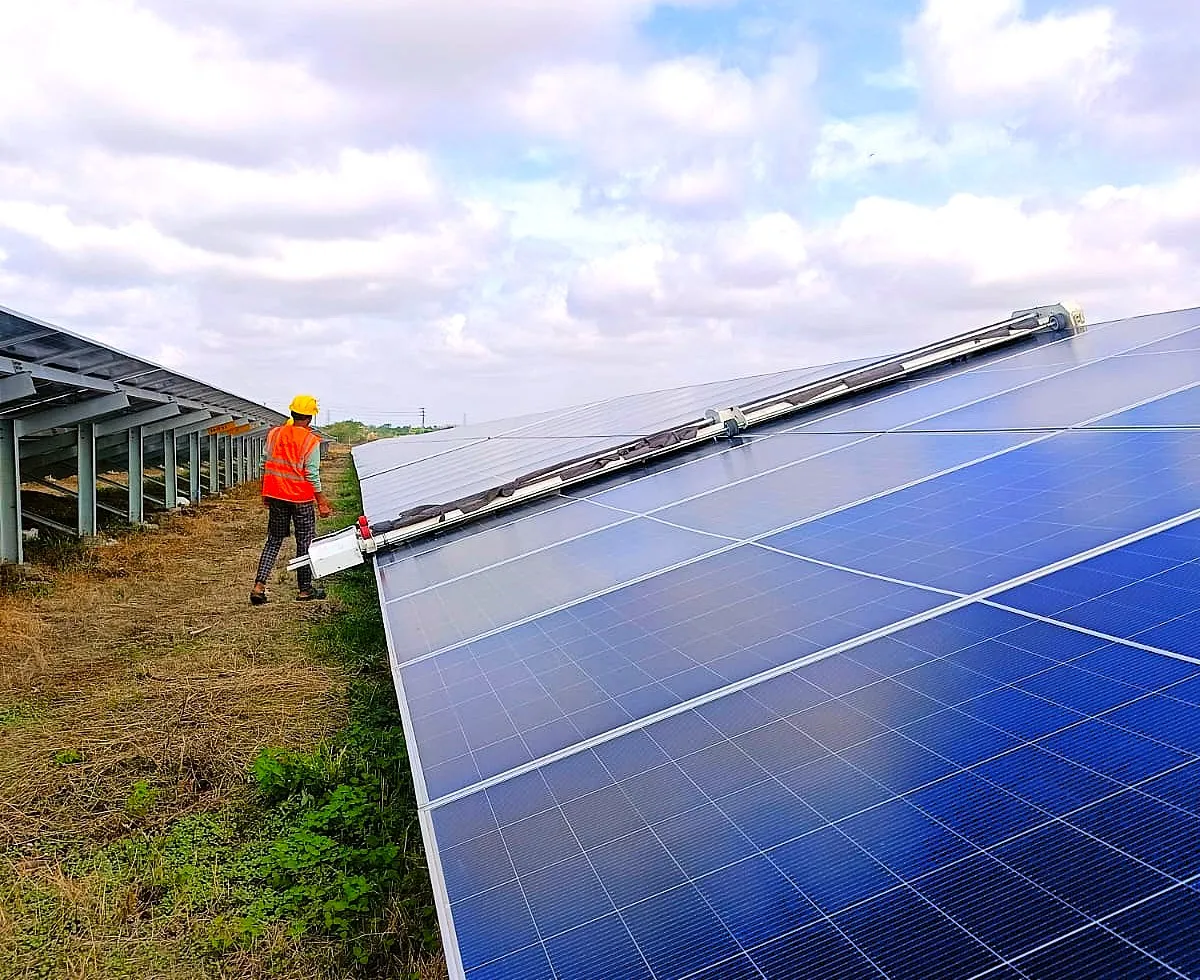
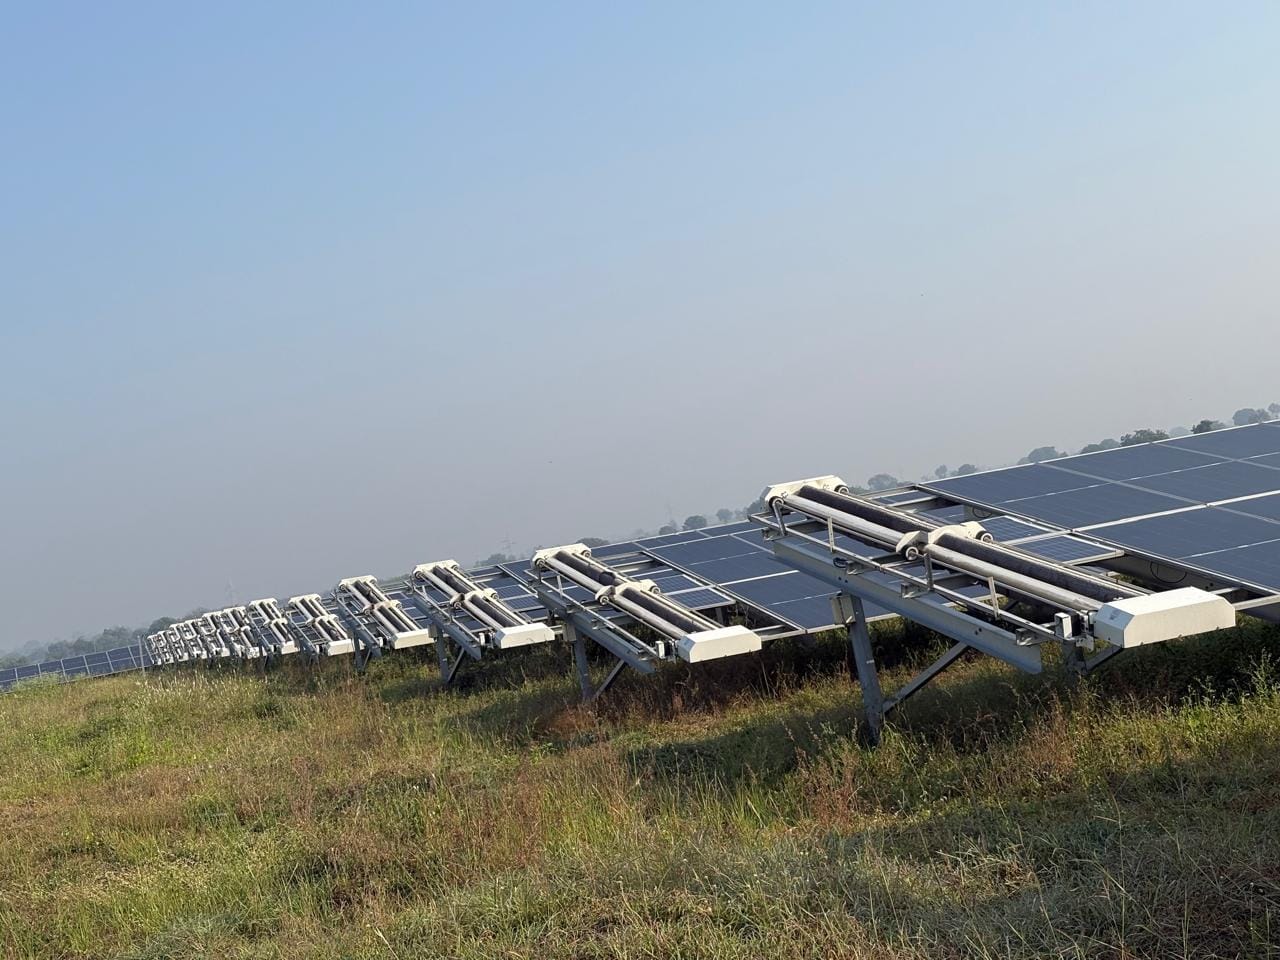
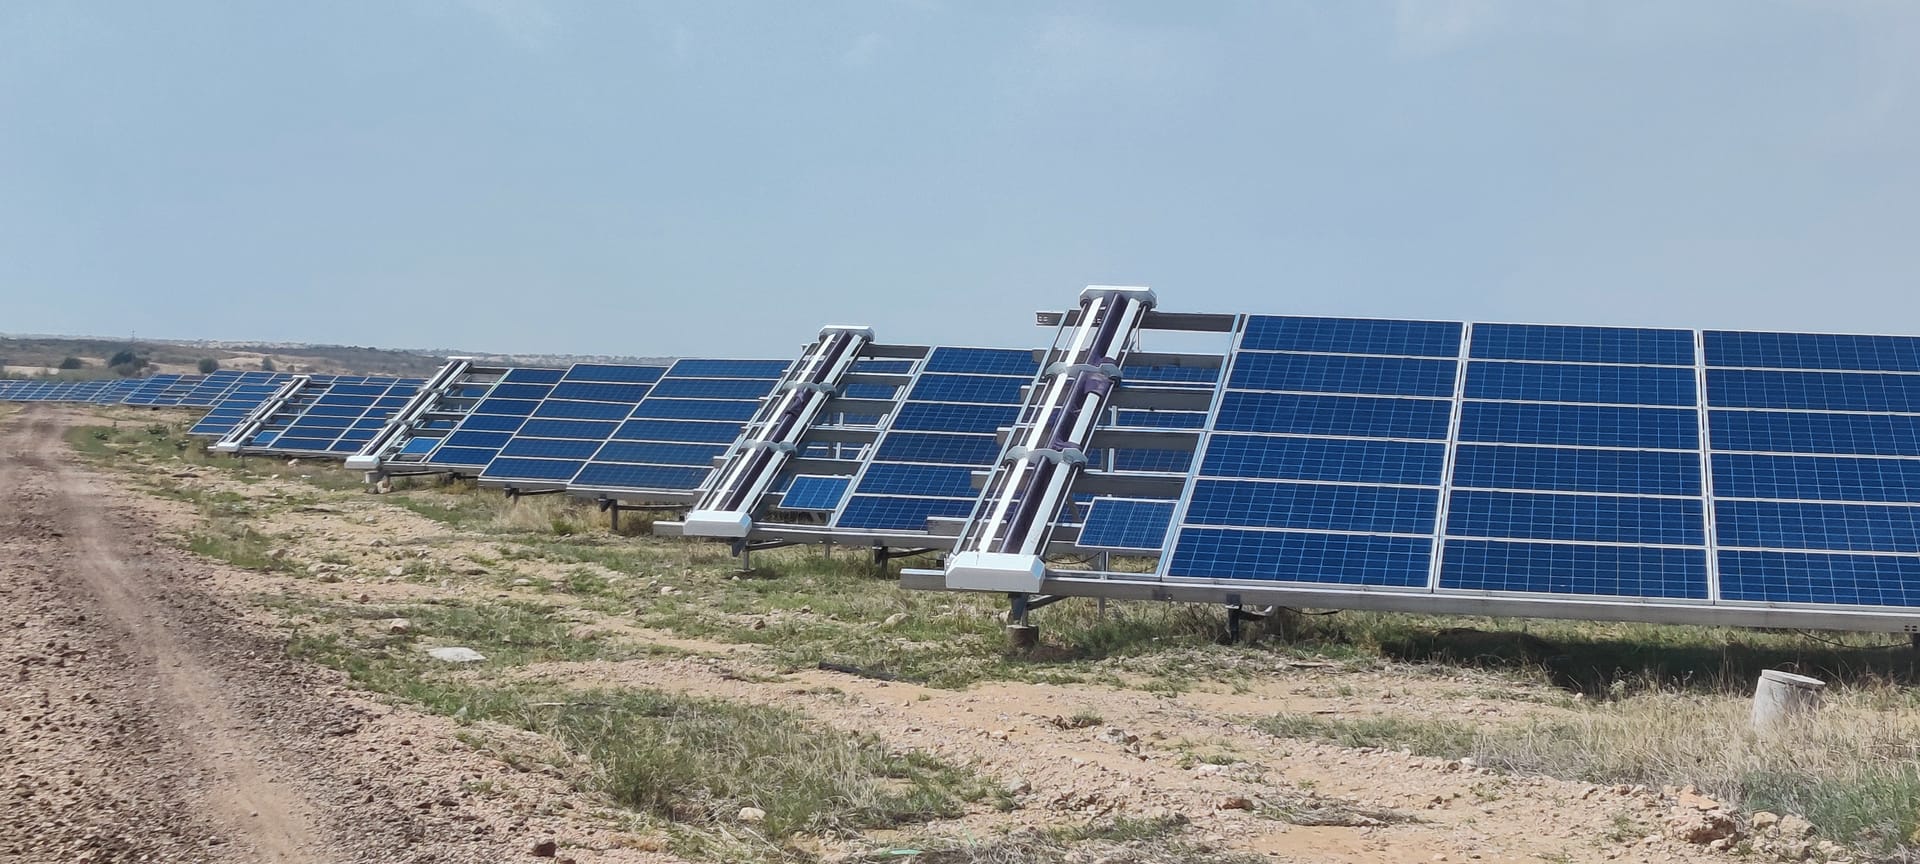
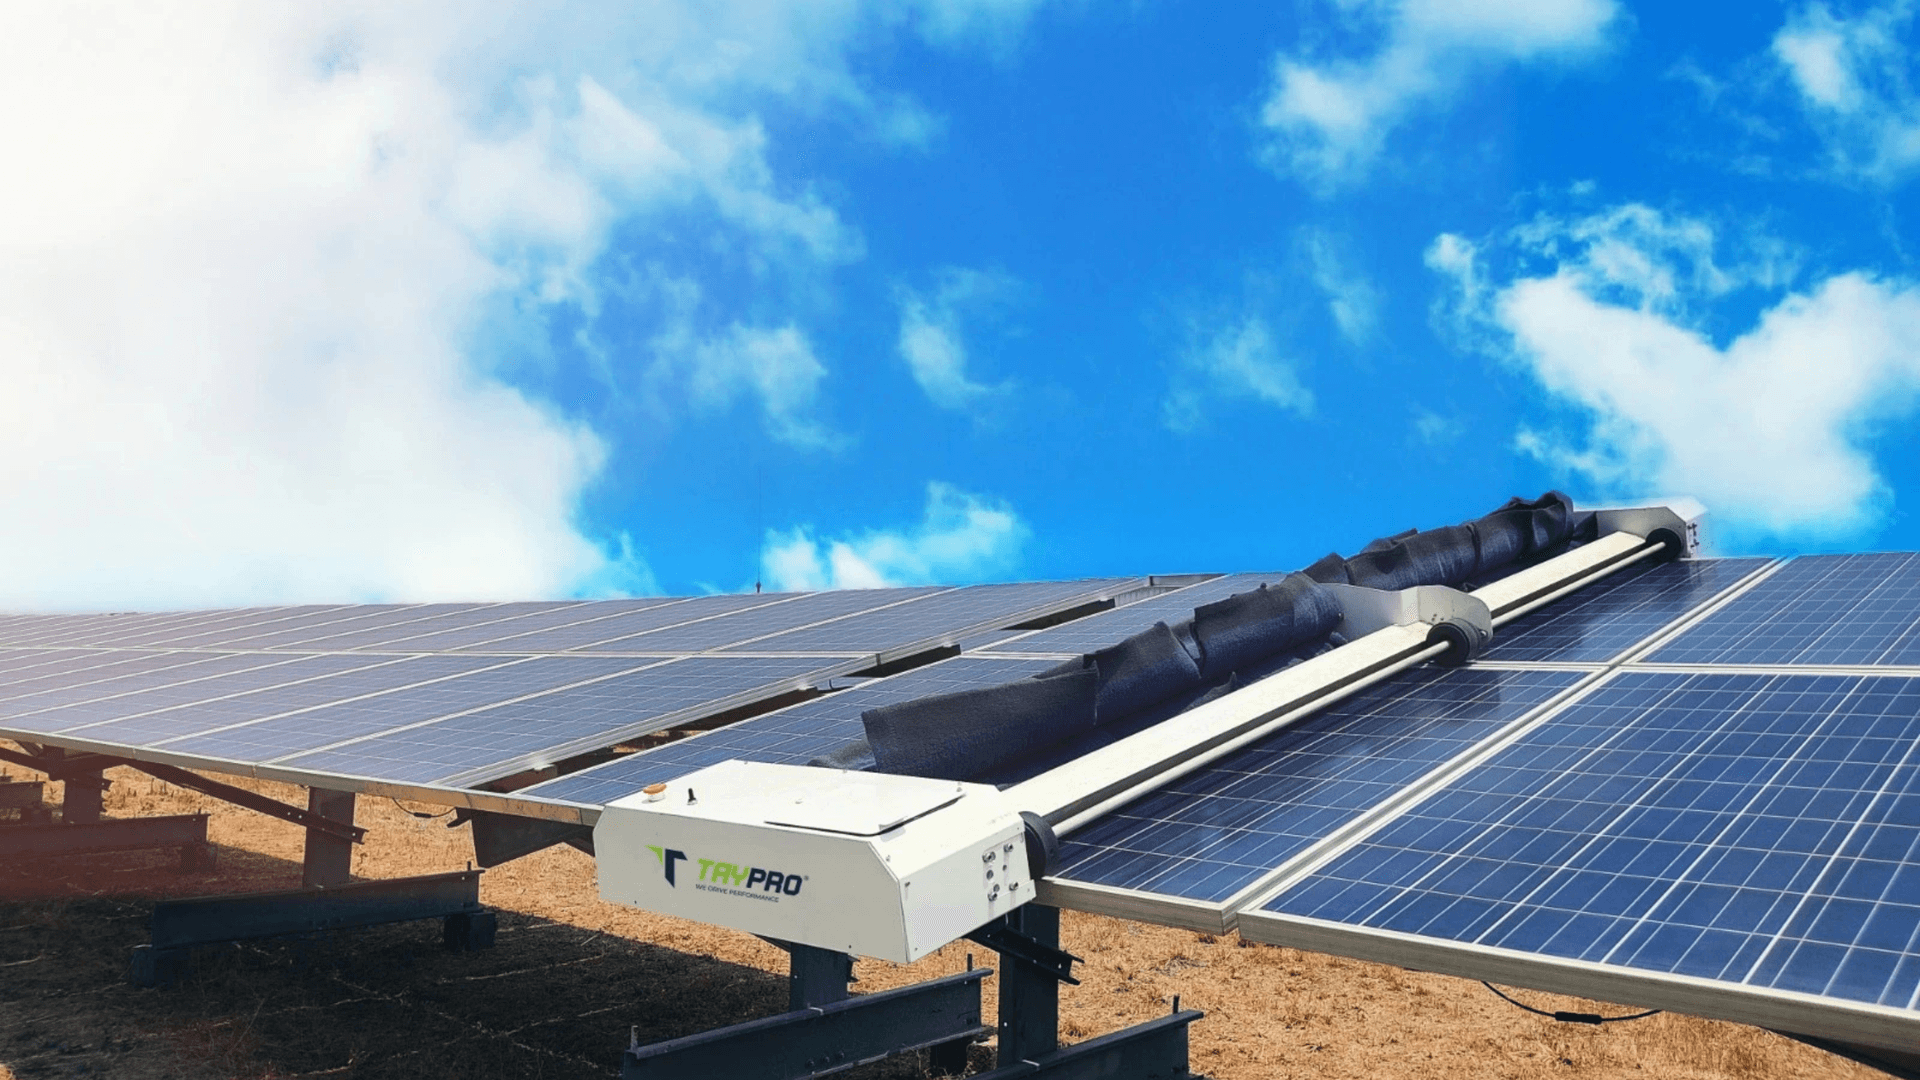
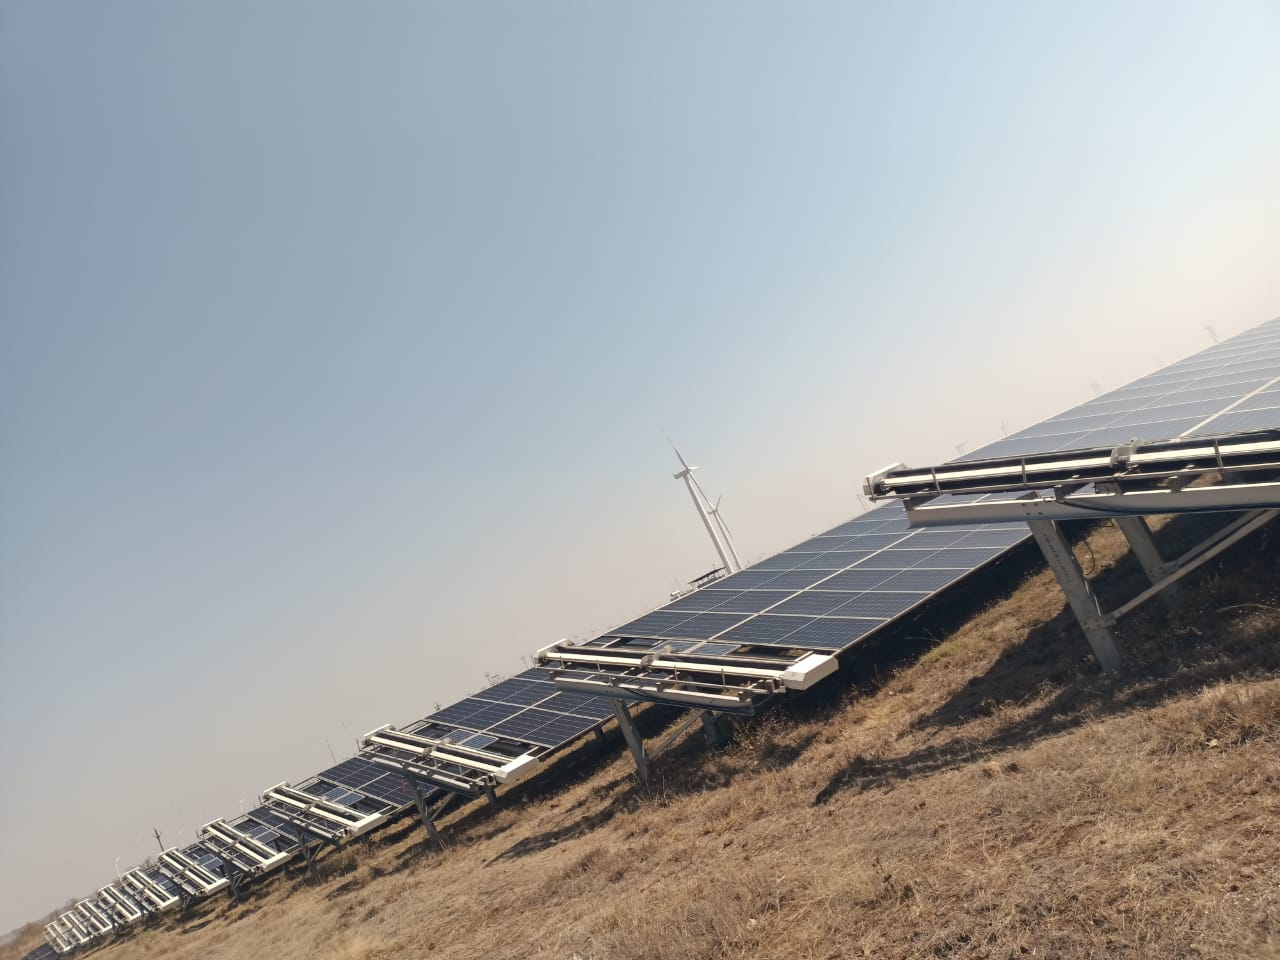
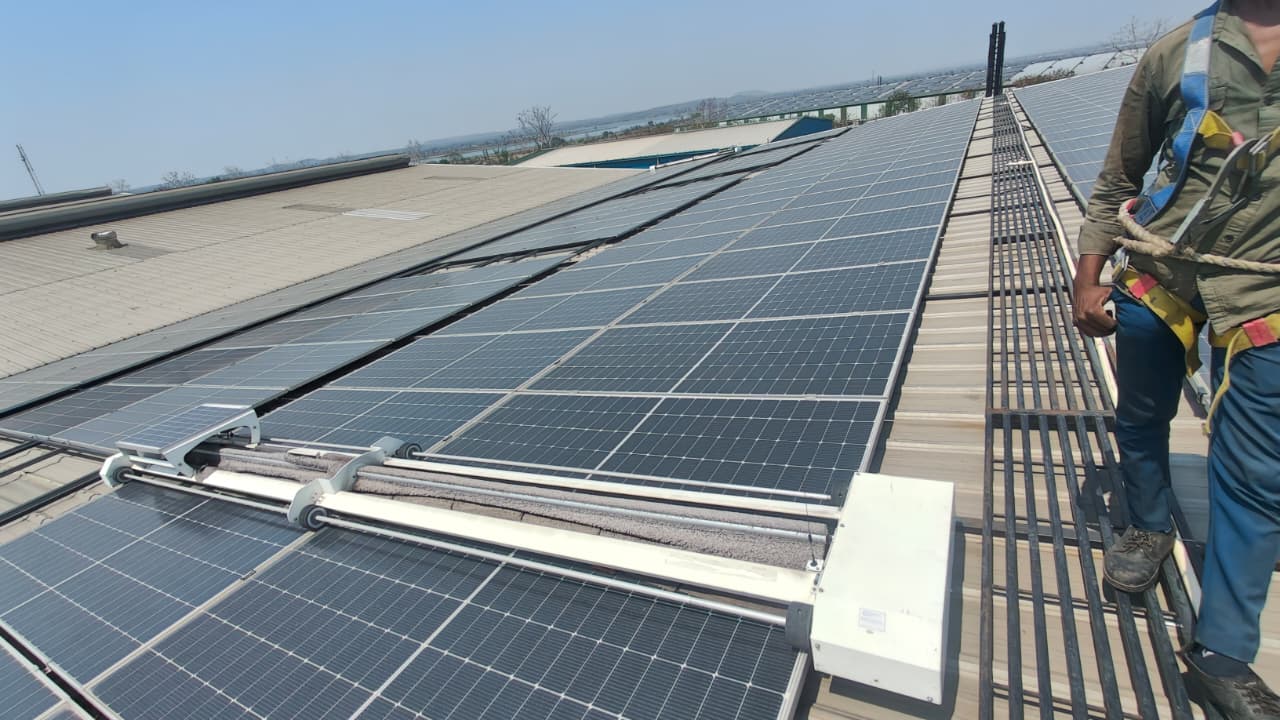
Robot economics combine fleet capex or lease, operators, batteries, brush wear, mesh maintenance, and vendor AMC. Benefit depends on pass frequency and uptime: a parked fleet is pure cost. Vendors may quote 3–6 day effective full-plant coverage at high uptime on compatible fixed-tilt or tracker rows.
Compare architecture in how cleaning robots work and what robots are.
Side-by-side ROI inputs (25 MW illustrative)
Input | Manual wet | Waterless robots |
|---|---|---|
PPA tariff | ₹3.20/kWh | ₹3.20/kWh |
Annual soiling loss if neglected | 4–6% MWh | 4–6% MWh |
PR recovery when executed well | 2–4 points | 3–5 points if uptime high |
5-year loaded cleaning cost | ₹2.2–3.8 crore | ₹3.0–5.0 crore |
Annual water cost | ₹12–25 lakh | <₹2 lakh routine |
Storm cycle risk | High | Medium (uptime dependent) |
Illustrative only. Substitute your plant production and quotes.
Worked benefit calculation (simplified)
Assume 25 MW produces 45,000 MWh/year at clean baseline. Four percent soiling loss equals 1,800 MWh at risk annually. Recovering three points (1,350 MWh) at ₹3.20/kWh yields roughly ₹43 lakh/year gross benefit before cleaning cost. Over five years, that is ₹2.15 crore if PR holds. Manual TCO near ₹3 crore may barely clear hurdle; robot TCO near ₹4 crore needs higher recovery or faster cycles to win.
Small changes in recovery points swing ROI sharply. That is why pilot data matters.
Sensitivity table: robot uptime vs manual delay
Scenario | Manual outcome | Robot outcome |
|---|---|---|
Base | 10-day cycle; 3 pt recovery | 85% uptime; 4 pt recovery |
Stress | 15-day cycle after storm | 70% uptime; spare delays |
Upside | 7-day cycle; water cheap | 95% uptime; nightly passes |
Present all three to finance committees. See cost-benefit framework for parallel methodology.
Water and ESG value in ROI
On water-stressed sites, manual wet methods may consume 2–4 million litres per full pass on 25 MW depending on method and vendor discipline. Tankers add ₹/litre logistics. Waterless robots reduce routine withdrawal dramatically, which helps ESG questionnaires and some lender green covenants even when rupee value is modest.
Compare traditional vs waterless methods for operational detail.
Pilot protocol to lock ROI assumptions
Select two dirty blocks with working reference measurement.
Record 14-day pre-clean PR trend.
Execute manual on block A, robot on block B (or alternate vendors).
Log hours, water, coverage, and aborts.
Measure 7-day post-clean PR; roll up annualized benefit.
Align with best practices and frequency guidance for India.
Contract structures that protect ROI
Manual AMC with undefined surge pricing destroys modeled ROI after the first bad storm. Robot leases without uptime SLA shift downtime risk to the owner. Negotiate pass coverage minimums, mobilization hours, and exit clauses if PR targets miss for two quarters.
Vendor selection context: choosing cleaning services at 50 MW.
Common ROI mistakes
Using vendor global recovery percentages without site PR data.
Ignoring 5–10 day manual mobilization after dust events.
Counting robot capex but not spares or operator training.
Mixing inverter outage into cleaning benefit.
Comparing one-year AMC to five-year robot TCO.
Review costly mistakes guide before board submission.
Does manual or robot win on a 40 MW Gujarat tracker plant?
If manual crews cannot safely complete priority rows within 72–96 hours after typical storms and water exceeds ₹20 lakh annually, robots with documented tracker stow compatibility usually enter ROI contention above 85% uptime. If manual already hits priority blocks in 48 hours at stable AMC, robot premium may not clear hurdle until water costs rise or labour mobilization slips. Run the pilot; Gujarat dust is not Rajasthan dust.
Discount rate and hurdle rate alignment
Finance teams often evaluate cleaning ROI at the project WACC or a simple payback threshold. Manual methods with lower capex may show faster payback but higher opex volatility. Robots front-load cost and smooth annual spend. Present NPV at the same discount rate used for module repower decisions so committees compare like with like.
If PPA tariff is fixed with no escalation, MWh recovery value is flat in nominal terms while labour and water inflate. Robot leases with fixed annual payments can become relatively more attractive in outer years when manual opex rises 6–8% annually.
Reporting ROI to investors and lenders
Quarterly investor packs should separate soiling-related PR loss from inverter outages. Cleaning ROI narratives fail when PR dips are blamed on cleaning without irradiance normalization. Use the same reference methodology your lender approved at financial close.
Document pilot methodology in board minutes when switching from manual to robot or changing vendors mid-life. Mid-contract ROI disputes are common when new asset managers inherit old assumptions without measurement trail.
Hybrid programs and split ROI attribution
Many Indian plants run robots on compatible fixed-tilt blocks and manual crews on tight tracker rows. ROI models should allocate cost and MWh recovery by block, not plant average. A hybrid can beat pure manual on NPV while avoiding full robot capex on geometry that rejects automation.
Attribute water savings to wet blocks only; do not spread robot water benefits across manual zones in investor slides.
Key takeaways
ROI is MWh value minus five-year TCO, stress-tested for storms.
Manual wins when cycles are fast and water is cheap; robots win on throughput and arid sites.
Pilot on reference blocks before fleet or long AMC commitments.
Include water, surge pricing, and uptime in every model.
Present sensitivity tables finance can audit, not single-point guesses.
Manual versus robot ROI debates end when two methods run on the same dirty block with the same PR meter. Everything else is spreadsheet fiction until that pilot exists.
Related resources
Frequently asked questions
Model five-year fully loaded cost for each method (labour, water, fuel, AMC, robot capex or lease, spares, supervision) against incremental MWh recovered using irradiance-normalized PR before and after cleaning. Multiply recovered MWh by your PPA tariff and subtract total cost. ROI improves when soiling losses are large and robot uptime keeps cycles short.
Manual programs on Indian utility sites often recover 2–5 percentage points of PR when executed on schedule after dust events, but recovery erodes if full-plant cycles exceed seven to ten days. Use your site reference strings, not national averages, because row length and dust type dominate results.
Robots tend to win when water is expensive or scarce, dust frequency is high, manual mobilization is slow after storms, and row geometry supports nightly passes with uptime above roughly 85%. Robots lose ROI when geometry blocks automation and crews already finish within the economic soiling window at low water cost.
Yes on arid sites where tanker logistics add cost beyond metered water, and where ESG covenants value withdrawal reductions. Quantify litres per MW per year for manual wet methods and near-zero routine use for waterless robots. Include discharge compliance costs if wet runoff affects environmental permits.
Twelve months of PR and soiling data if available, PPA tariff, cleaning quotes with surge pricing, module OEM approvals, and pilot results on at least two blocks. Finance will stress-test uptime and labour inflation; provide sensitivity tables for robot downtime at 70%, 85%, and 95%.