Summary for plant managers
Delayed cleaning is more than an O&M mistake. It directly lowers your plant's internal rate of return (IRR) through cumulative power losses. For utility-scale assets in India, you need a data-backed cleaning strategy. This prevents permanent soiling damage and stops revenue leakage.
- Daily soiling loss in dry Indian regions is usually 0.3% to 1.0% per day.
- Annual energy yield losses range from 5% to 30% depending on your site.
- The best cleaning trigger is based on site-specific Performance Ratio (PR) thresholds. These usually fall 2% to 3% below your baseline levels.
- Use dynamic, soiling-based cleaning instead of fixed calendars. This optimizes water use and reduces downtime.
Monitor PR trends and weather patterns to stay ahead. You can move from reactive maintenance to a proactive workflow. This ensures you clean exactly when the cost of lost power exceeds the cleaning cost. This protects your revenue and maximizes asset value, as discussed in our guide to solar cleaning OPEX pricing models. Using site data reduces labor needs and aligns spending with output. This is vital for large portfolios, as described in our report on managing long-term soiling and maintenance costs.
The technical link between delayed cleaning and operational downtime

Delayed cleaning impacts more than just power generation. It also hurts module health and system availability. Dust and organic dirt can build up for weeks. This creates localized hotspots and chemical crusts like bird droppings or industrial pollutants. These substances can permanently etch the glass surface. This damage makes future cleaning less effective. It also speeds up the loss of your plant performance ratio (PR).
For managers with 50 MW or larger portfolios, timing is everything. You should clean when the cost of resources is lower than the value of lost energy. For example, a plant in Rajasthan might have a 0.5% daily soiling rate. A 10-day delay causes a 5% drop in potential output. This erosion hits your PPA-guaranteed generation. It forces you to report 'soft' losses in annual energy yield reports. As our analysis of solar cleaning OPEX pricing models shows, you must find the threshold where loss exceeds intervention costs.
There are other technical risks too. Long-term dirt buildup increases the risk of micro-cracks. It can also cause cell damage during aggressive manual cleaning. Regular, controlled cleaning prevents this damage, as discussed in our review of managing long-term maintenance costs. Align cleaning with real-time PR monitoring. This avoids reactive maintenance pitfalls. It keeps surfaces clear and inverters running optimally to minimize downtime costs.
How to calculate the downtime cost of delayed cleaning on utility plants
Calculating the financial impact of soiling requires a clear method. You must link real-time environmental data to your plant's generation curves. For utility assets, the downtime cost is the gap between expected P50 yield and actual output. This gap occurs when modules are uncleaned.
To find your site-specific cost of delay, follow these three steps:
- Baseline Comparison: Use your SCADA system to find your baseline Performance Ratio (PR). Measure this right after a deep clean. This is your reference point for perfect system health.
- Soiling Rate Mapping: Track the daily PR decline in different plant zones. In regions like Rajasthan or Gujarat, benchmarks show a 0.3% to 1.0% daily drop.
- Revenue Impact Analysis: Multiply the daily percentage loss by your PPA tariff and total capacity. For a 50 MW plant with a 0.5% daily loss, you lose 0.25 MW every 24 hours. At a tariff of INR 2.50 per unit, a 10-day delay creates a large revenue gap. This gap often costs more than a full cleaning cycle.
Turn percentage losses into real currency. This helps managers find the exact point where cleaning becomes profitable. This data-driven approach removes guesswork from O&M budgets. It also prevents long-term soiling debt and module staining. Accurate calculations ensure your schedule matches grid performance. This is key to maximizing returns, as noted in our report on managing long-term soiling and maintenance costs.
Advertisement
How often should you clean solar panels on a 50 MW plant?
Finding the best cleaning frequency requires a balance. You must weigh O&M labor costs against lost revenue. A fixed calendar schedule is rarely efficient for a 50 MW plant in India. Local weather changes unpredictably. Instead, use a threshold-based strategy. Trigger cleaning based on a specific drop in Performance Ratio (PR) rather than a calendar date.
In dry climates like Rajasthan, soiling can exceed 0.5% daily. You might need to clean every 15 to 20 days during the dry season. During the monsoon, wind and rain provide natural cleaning. You can safely wait 45 days or longer. Operators should find the 'break-even' PR point. Once daily loss exceeds the cleaning cost, you must clean to protect profits.
- Threshold Triggers: Clean when the plant-wide PR drops 3% to 5% below your post-clean baseline.
- Seasonal Scaling: Clean more often in summer and less during monsoon. This optimizes water and labor.
- Zone-Based Prioritization: Focus on rows near unpaved roads. These areas often get dirty twice as fast as other rows.
A trigger-based model stops wasteful cleaning. You won't waste resources on clean rows. This focus protects your bottom line. It also extends the life of your module coatings.
Implementing a trigger-based cleaning schedule: A step-by-step process
Moving to a trigger-based schedule requires a structured approach. You must integrate field data with performance monitoring. Use real-time data from SCADA and weather stations. This ensures you only clean when the loss exceeds the cost. This is vital for managing 50 MW+ portfolios manually.
- Baseline Establishment: Perform a thorough clean during good weather. Record the peak PR to use as your 'clean-state' reference.
- Set Trigger Thresholds: Set clear alerts based on your PPA tariff and costs. For most Indian sites, a 3% to 5% PR drop is a good trigger.
- Automate Monitoring via NECTYR: Use automated tools to compare real-time generation against expected output. The system should flag blocks for cleaning when PR drops.
- Weather-Indexed Postponement: Use local weather forecasts. If rain is coming within 24 hours, delay cleaning. Use natural rain to save water and energy.
- Feedback Loop Analysis: Evaluate the PR recovery after every clean. This helps you refine your threshold settings. This ensures your schedule adapts to seasonal patterns, like Rajasthan's dust or Southern India's humidity.
Automating this workflow helps avoid delays. It reduces downtime costs from human error. This framework is discussed in our guide on robot integration for utility PV. It allows for precise resource use. It ensures you focus O&M on modules with the highest losses.
Managing cleaning logistics under India's water and labor constraints
Utility plants in India face two main problems: water scarcity and labor turnover. In Rajasthan and Gujarat, water-based cleaning is difficult. Strict permits and high tanker costs make it hard. At 50 MW+ sites, water needs can exceed 10,000 litres per cycle. This creates a bottleneck and risks delayed cleaning.
- Logistical Burden of Wet Cleaning: Manual cleaning requires large teams and water tankers. If bad weather blocks roads, crews cannot reach the rows. This leads to downtime and lost revenue.
- Waterless Scalability: Dry-cleaning technology removes the need for tankers. It reduces water use by up to 90%. See our analysis on robotic water savings on MW plants.
- Labor Standardization: Manual cleaning quality varies between shifts. Autonomous systems provide uniform pressure and coverage. This prevents uneven performance from inexperienced staff.
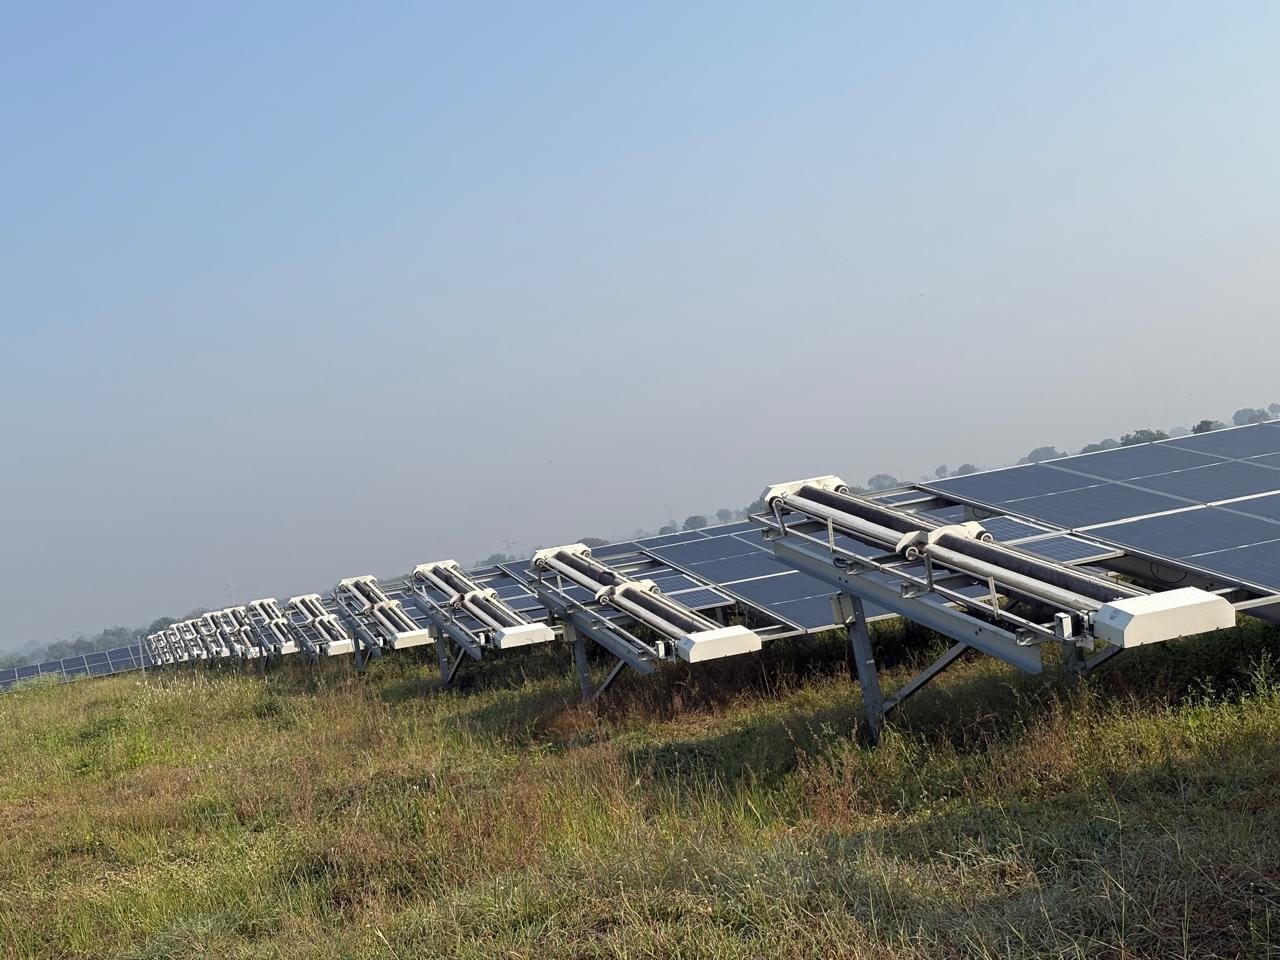
- Infrastructure Buffers: Use autonomous row-transfer systems like the CRADYL for scattered layouts. This helps maintain cycles without a robot for every row.
Switching to an automated, waterless model helps. It decouples maintenance from labor and water stress. This keeps your PR predictable all year. For more on balancing these needs, see our guide on robot integration for utility PV.
Technical comparison: Manual vs. Automated cleaning workflows
For plant managers, the choice is about process control. Manual cleaning often lacks consistency. Different workers use different techniques. This leads to uneven cleanliness and soiling streaks. These streaks can cause hotspots on module strings.
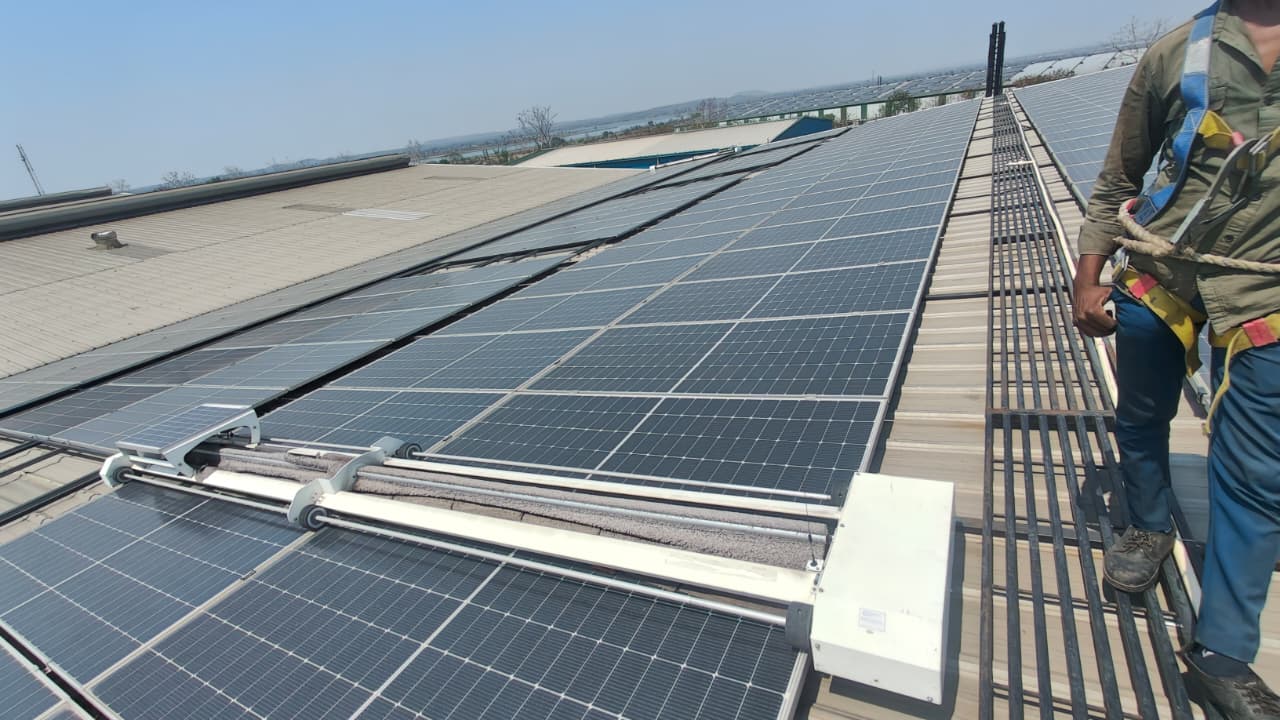
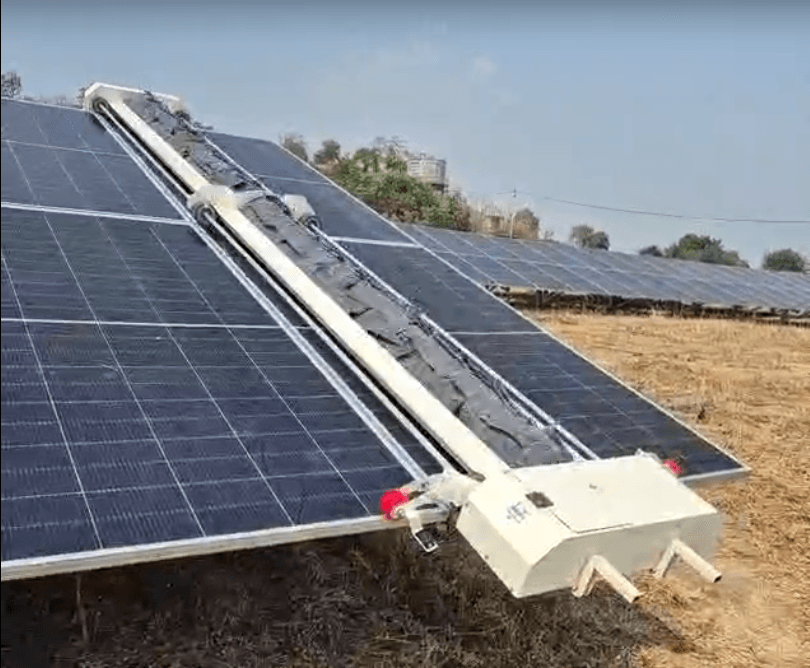
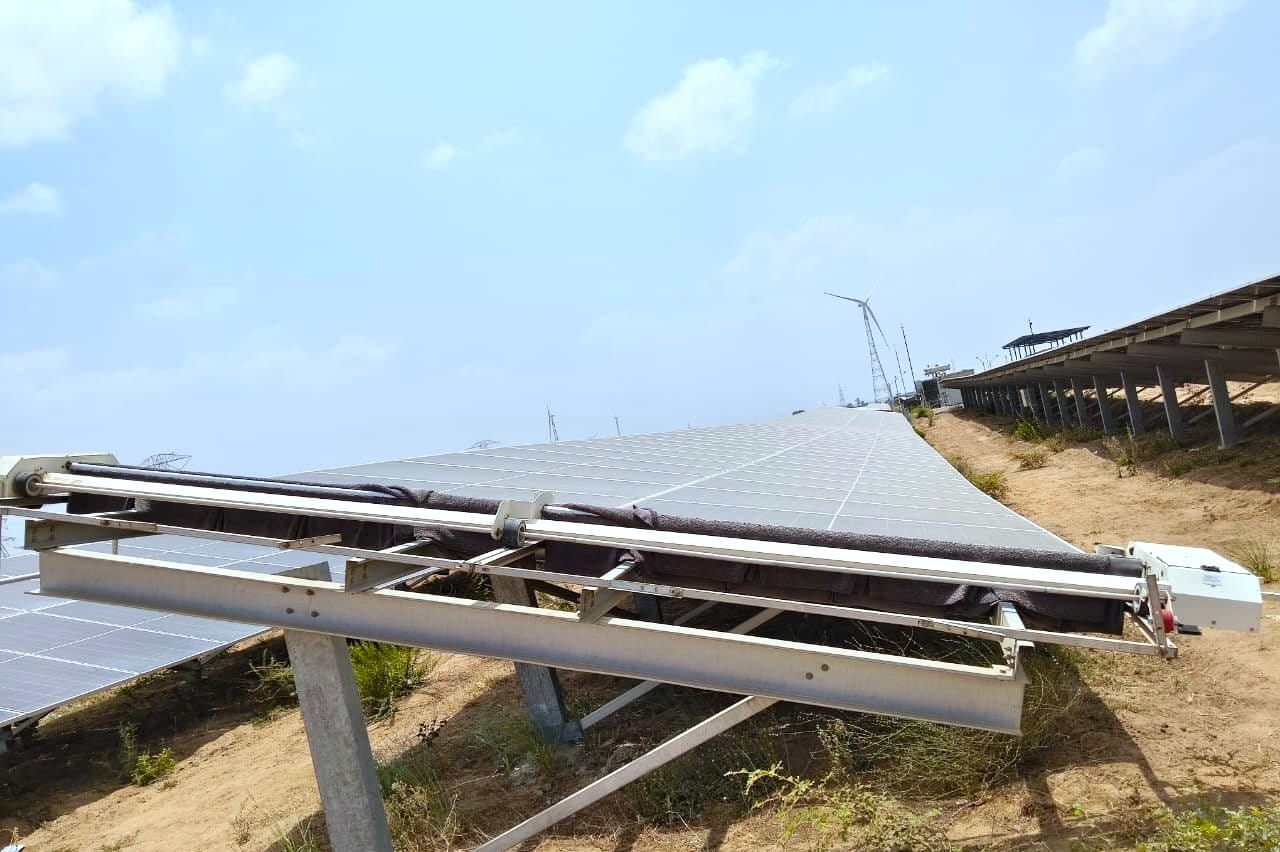
Automated robotic systems are different. They provide a standardized cleaning cycle. They use uniform pressure and speed. This ensures consistent PR recovery across all blocks. The table below compares these two approaches for utility sites.
| Feature | Manual Brush Cleaning | Automated Robotic Cleaning |
|---|---|---|
| Consistency | Variable; depends on technique | High; standardized pressure |
| Water Usage | High; 10,000+ litres/cycle | Near zero; dry technology |
| Safety Risk | High; high-voltage exposure | Low; autonomous operation |
| Scheduling | Difficult; labor constraints | Predictable; AI-driven |
| Data Integration | Manual; limited tracking | Real-time; NECTYR logs |
Manual crews struggle with access. This is common in high-density tracker layouts. Automated systems like GLYDE-X or NYUMA-X navigate these areas easily. They use flexible designs and transfer mechanisms like the CRADYL. You can clean during high-generation hours or at night. This precision reduces downtime costs by ensuring timely recovery.
What plant managers should do next
To move to a high-availability model, integrate data with your schedule. Start by auditing your soiling loss data. Establish a trigger-based frequency instead of a calendar. Once you know your daily PR drop, assess upgrading your tech.
- Baseline your current soiling impact: Use 90 days of PR data to find your actual revenue loss. Identify 'soiling debt' in dusty regions like Rajasthan or Gujarat.
- Perform a CAPEX vs. OPEX study: Use a cleaning ROI calculator. See if autonomous systems lower your total cost of ownership.
- Audit your cleaning technology fit: Check if your layout needs the HELYX robot for scattered blocks. Or, check if you need full row automation like GLYDE or NYUMA for 50 MW+ scales.
- Standardize monitoring protocols: Connect cleaning logs to a portal like NECTYR. This ensures every event is tracked and mapped to performance.
- Phase your deployment: Start with a pilot on one block. This validates efficiency and water savings before a site-wide rollout.
These shifts help minimize downtime. They protect module coatings and long-term yields. This ensures your energy output meets PPA guarantees.
Sources and further reading
Frequently asked questions
Delayed cleaning is more than an O&M mistake. It directly lowers your plant's internal rate of return (IRR) through cumulative power losses.
In arid regions of India, solar plants typically experience daily energy losses ranging from 0.3% to 1.0% due to dust and particulate accumulation.
Rather than relying on a fixed calendar schedule, the best approach is to trigger cleaning based on site-specific Performance Ratio (PR) thresholds. Interventions should typically occur when the PR drops 2% to 3% below the expected baseline.
Water scarcity necessitates a shift from rigid, calendar-based schedules to dynamic, soiling-based cleaning interventions. By using data to clean only when the cost of lost generation exceeds the cost of a cleaning cycle, managers optimize both water consumption and operational downtime.