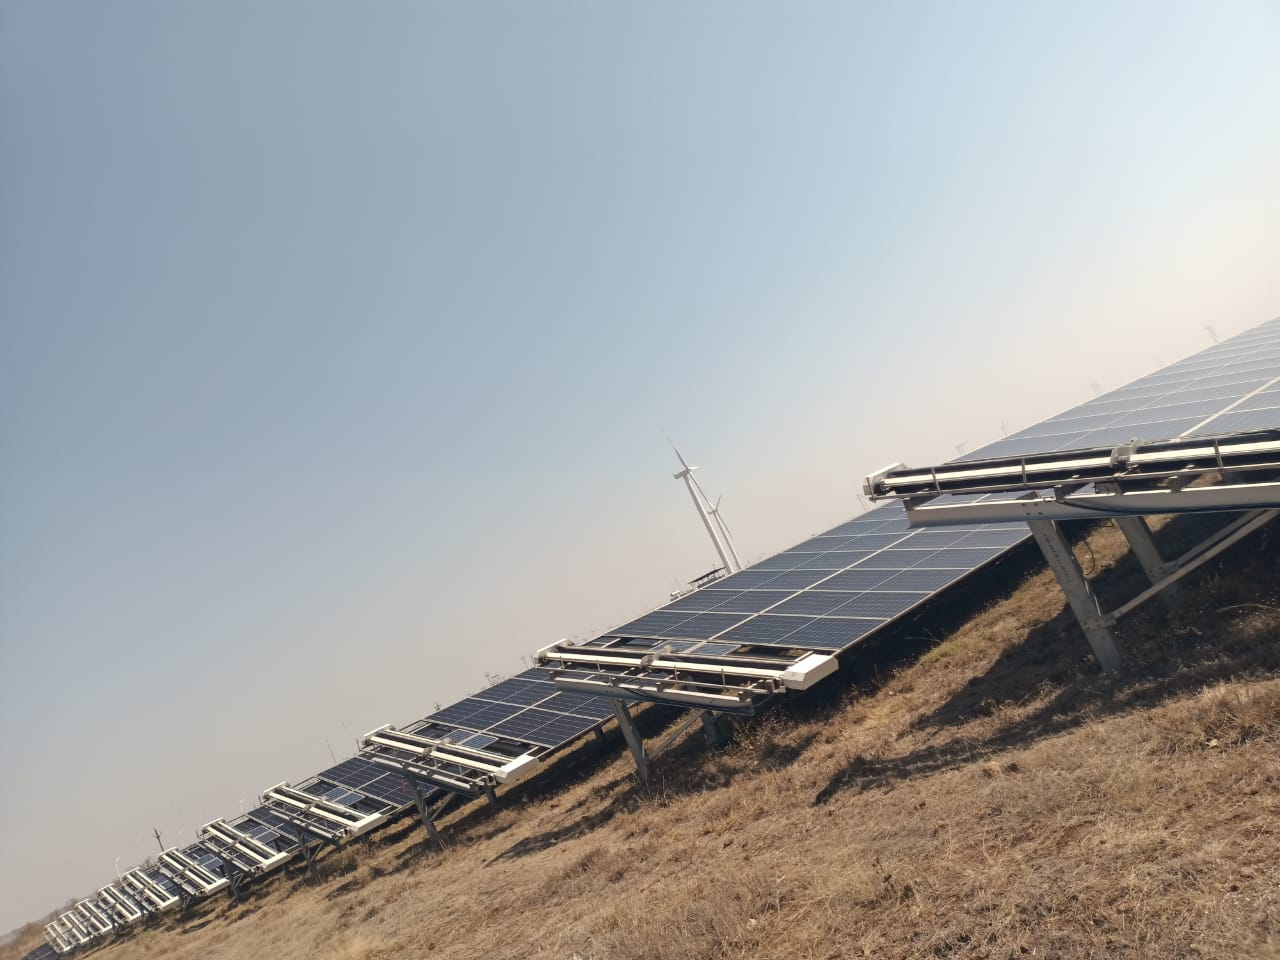
Quick answer: ROI and cleaning economics
For utility-scale solar plants in India, a professional solar panel cleaning service acts as a primary lever to recover lost revenue from soiling. By optimizing your cleaning intervals and method, you can effectively bridge the performance gap between manual, inconsistent washing and high-frequency automated cycles.
- Soiling in Indian arid regions causes energy losses between 15% and 30% without consistent intervention.
- Typical O&M budgets for utility-scale PV are 1% to 2% of total CAPEX; cleaning costs often form the largest variable component.
- Automated or specialized cleaning services can reduce water consumption by up to 90% compared to manual wet washing.
- Optimized cleaning cycles in dusty climates typically yield a payback period of under 18-24 months for automated investments.
Deciding between an outsourced cleaning service and an in-house automated strategy depends on your plant size and labor availability. While initial CAPEX for robotics may be higher, the long-term reduction in variable OPEX makes it the standard choice for 50MW+ portfolios looking to stabilize Performance Ratio (PR) metrics. For detailed insights on how these costs shift over time, you can review our fleet sizing guide for utility plants.
How does a professional solar panel cleaning service impact your bottom line?
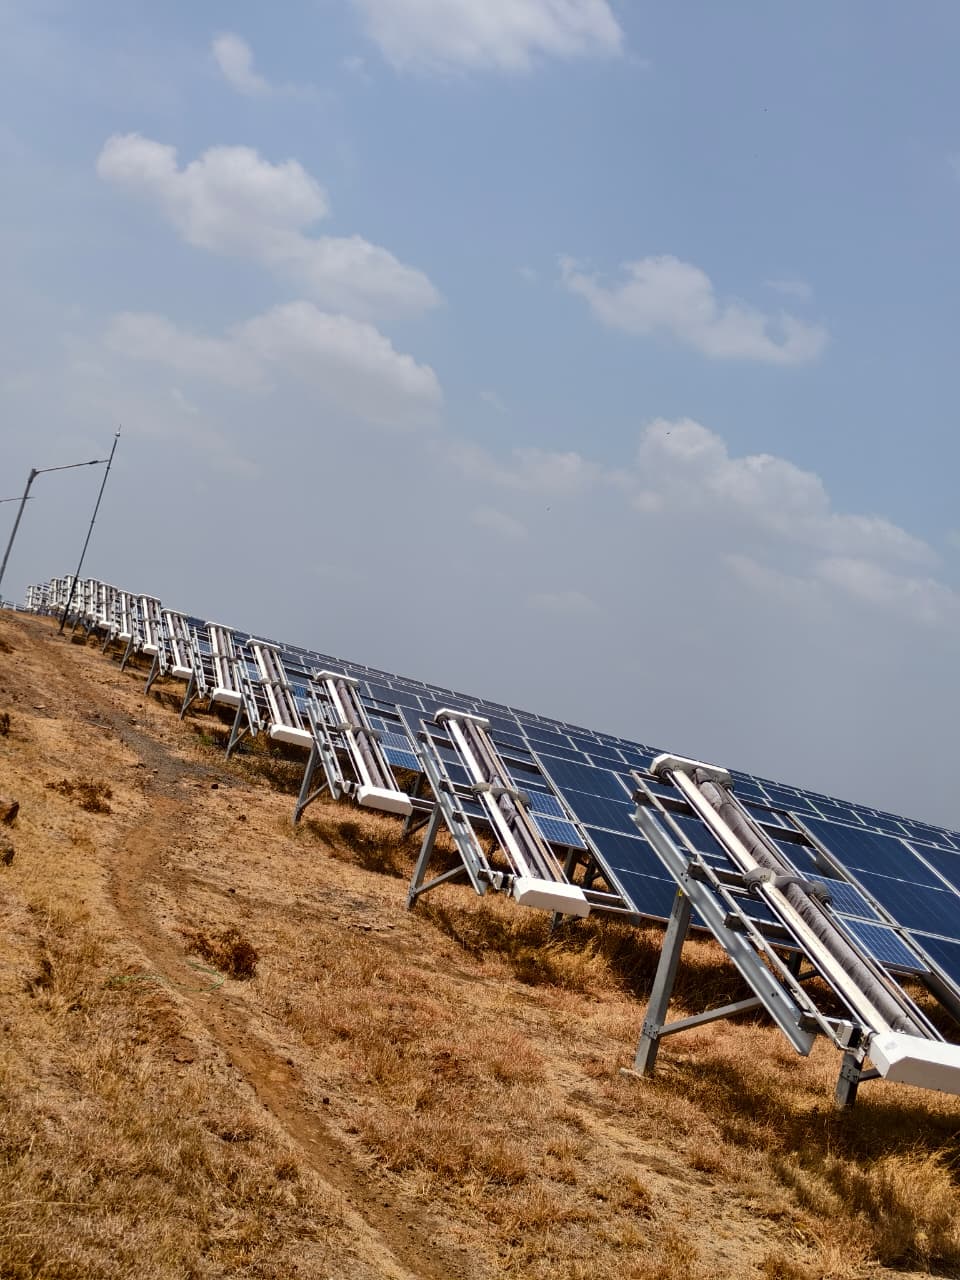
A professional solar panel cleaning service serves as an operational insurance policy for your assets. By maintaining a consistent Performance Ratio (PR), you mitigate the revenue volatility caused by heavy soiling, which remains a primary contributor to underperformance in Indian utility-scale plants.
The financial impact is measured through the lens of incremental yield recovery. When soiling losses are reduced from a typical 15–30% in arid regions to a consistent sub-5% baseline, the increase in annual energy output directly offsets the variable cost of the cleaning service. For a 50MW plant, even a 2% improvement in generation translates to a significant revenue lift that often dwarfs the cost of manual or robotic cleaning labor.
Furthermore, consistent cleaning prevents the long-term risk of 'soiling-induced shading,' where uneven dust deposition creates hot spots. These localized temperature increases can trigger premature degradation of module cells, effectively shortening the economic life of your balance-of-system components. Relying on professional services, whether through an outsourced cleaning firm or a deployed robotic fleet, shifts your O&M focus from emergency reactive washing to a data-driven, predictive maintenance schedule. This shift ensures that your cleaning spend is allocated only when meteorological triggers, such as low AQI scores or specific dust-accumulation thresholds, indicate that the cost of cleaning will be fully covered by the resulting energy generation gain. You can review how this data-driven approach compares to manual labor in our manual vs. robotic cleaning comparison guide.
Operational Expenditure (OPEX) planning for 50MW+ projects
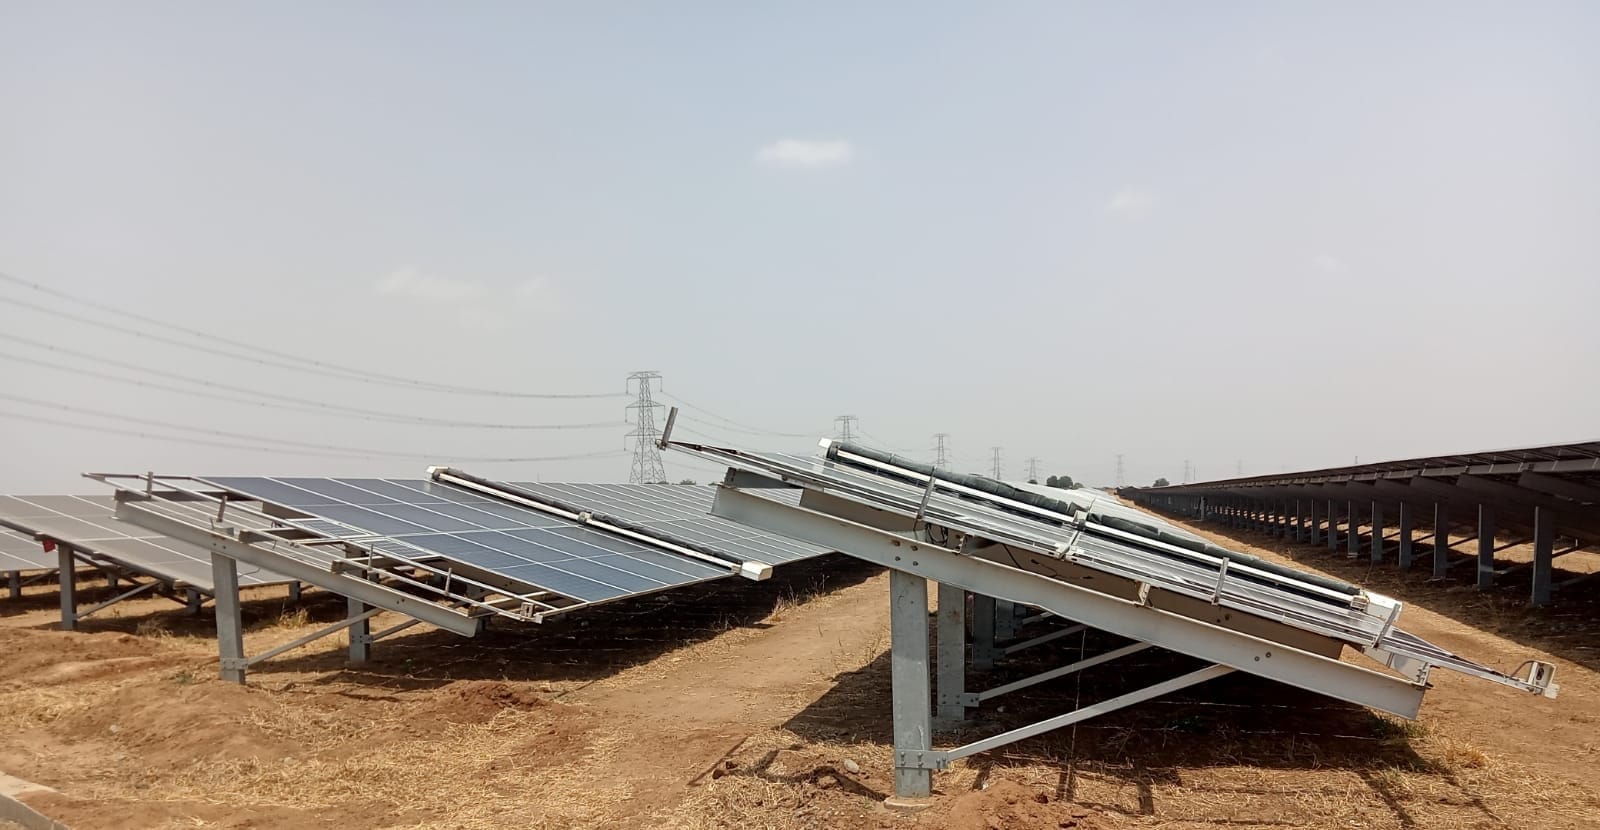
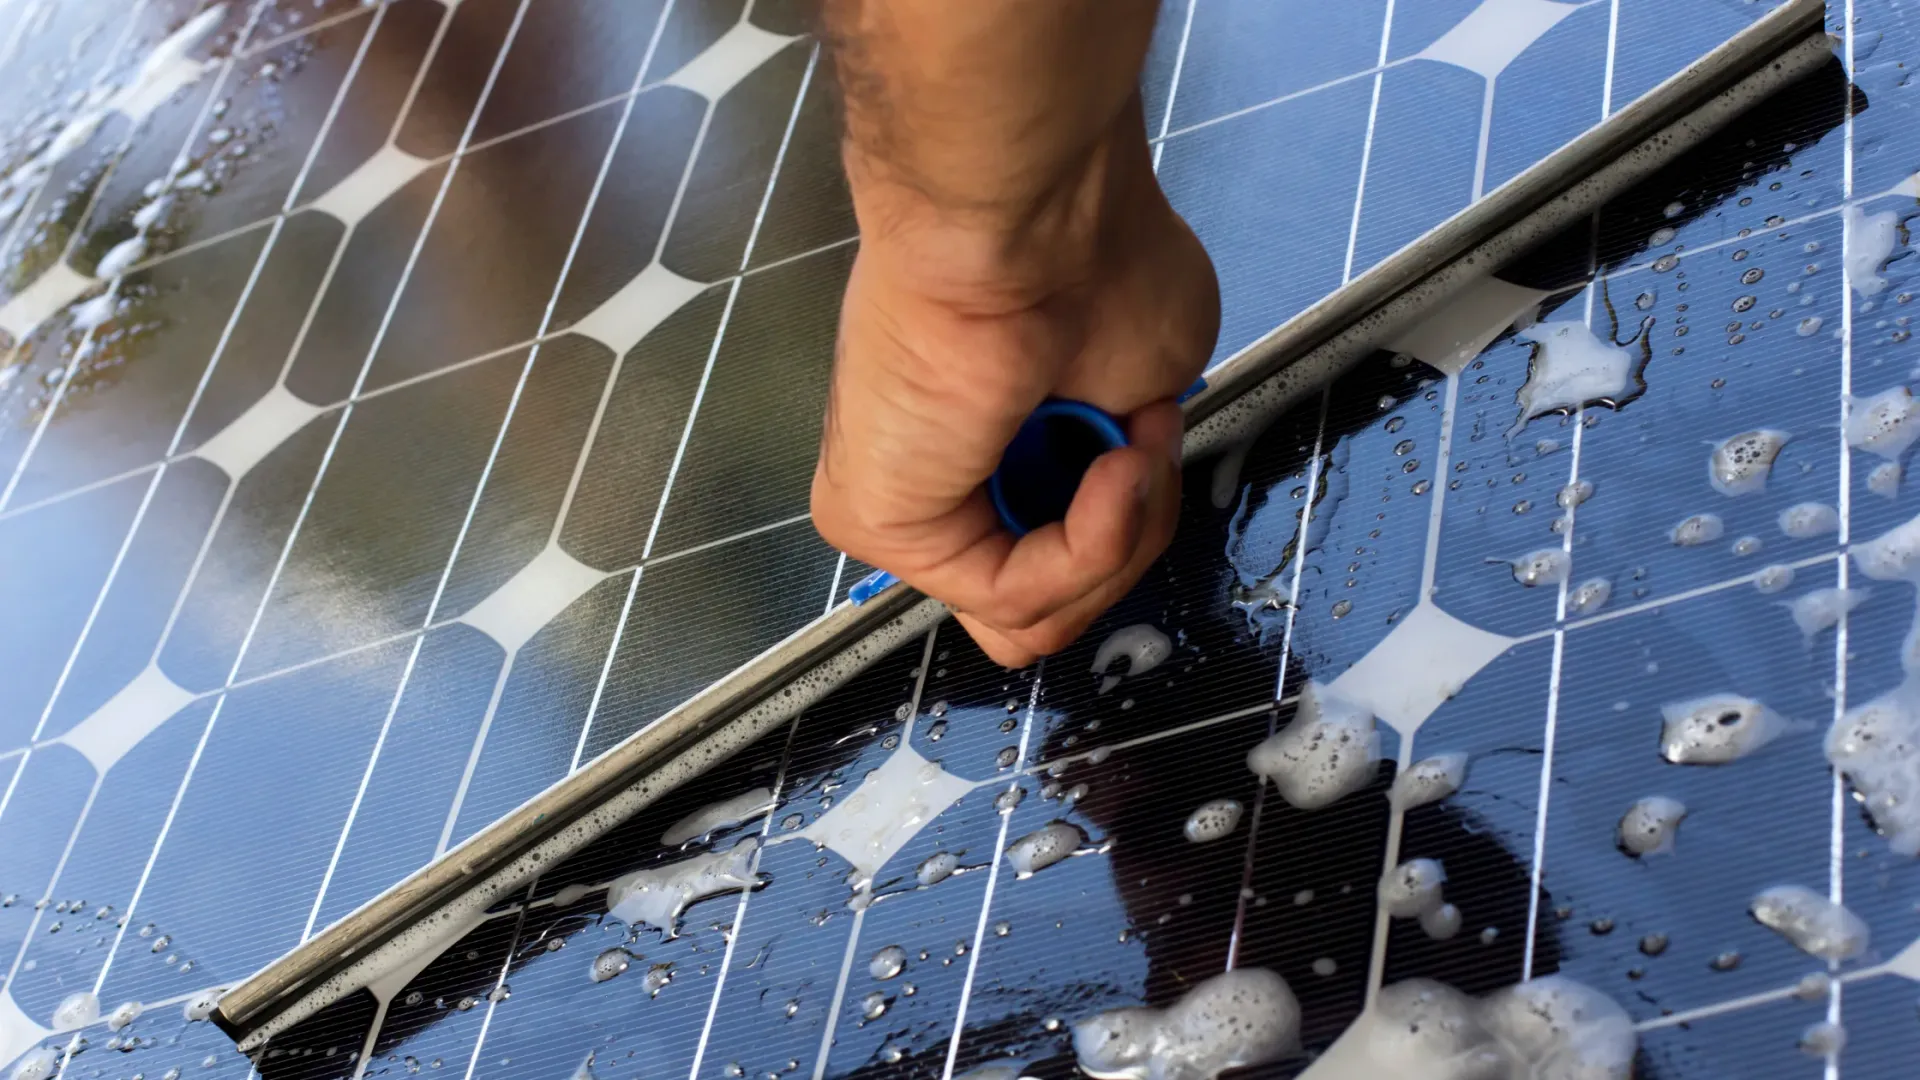
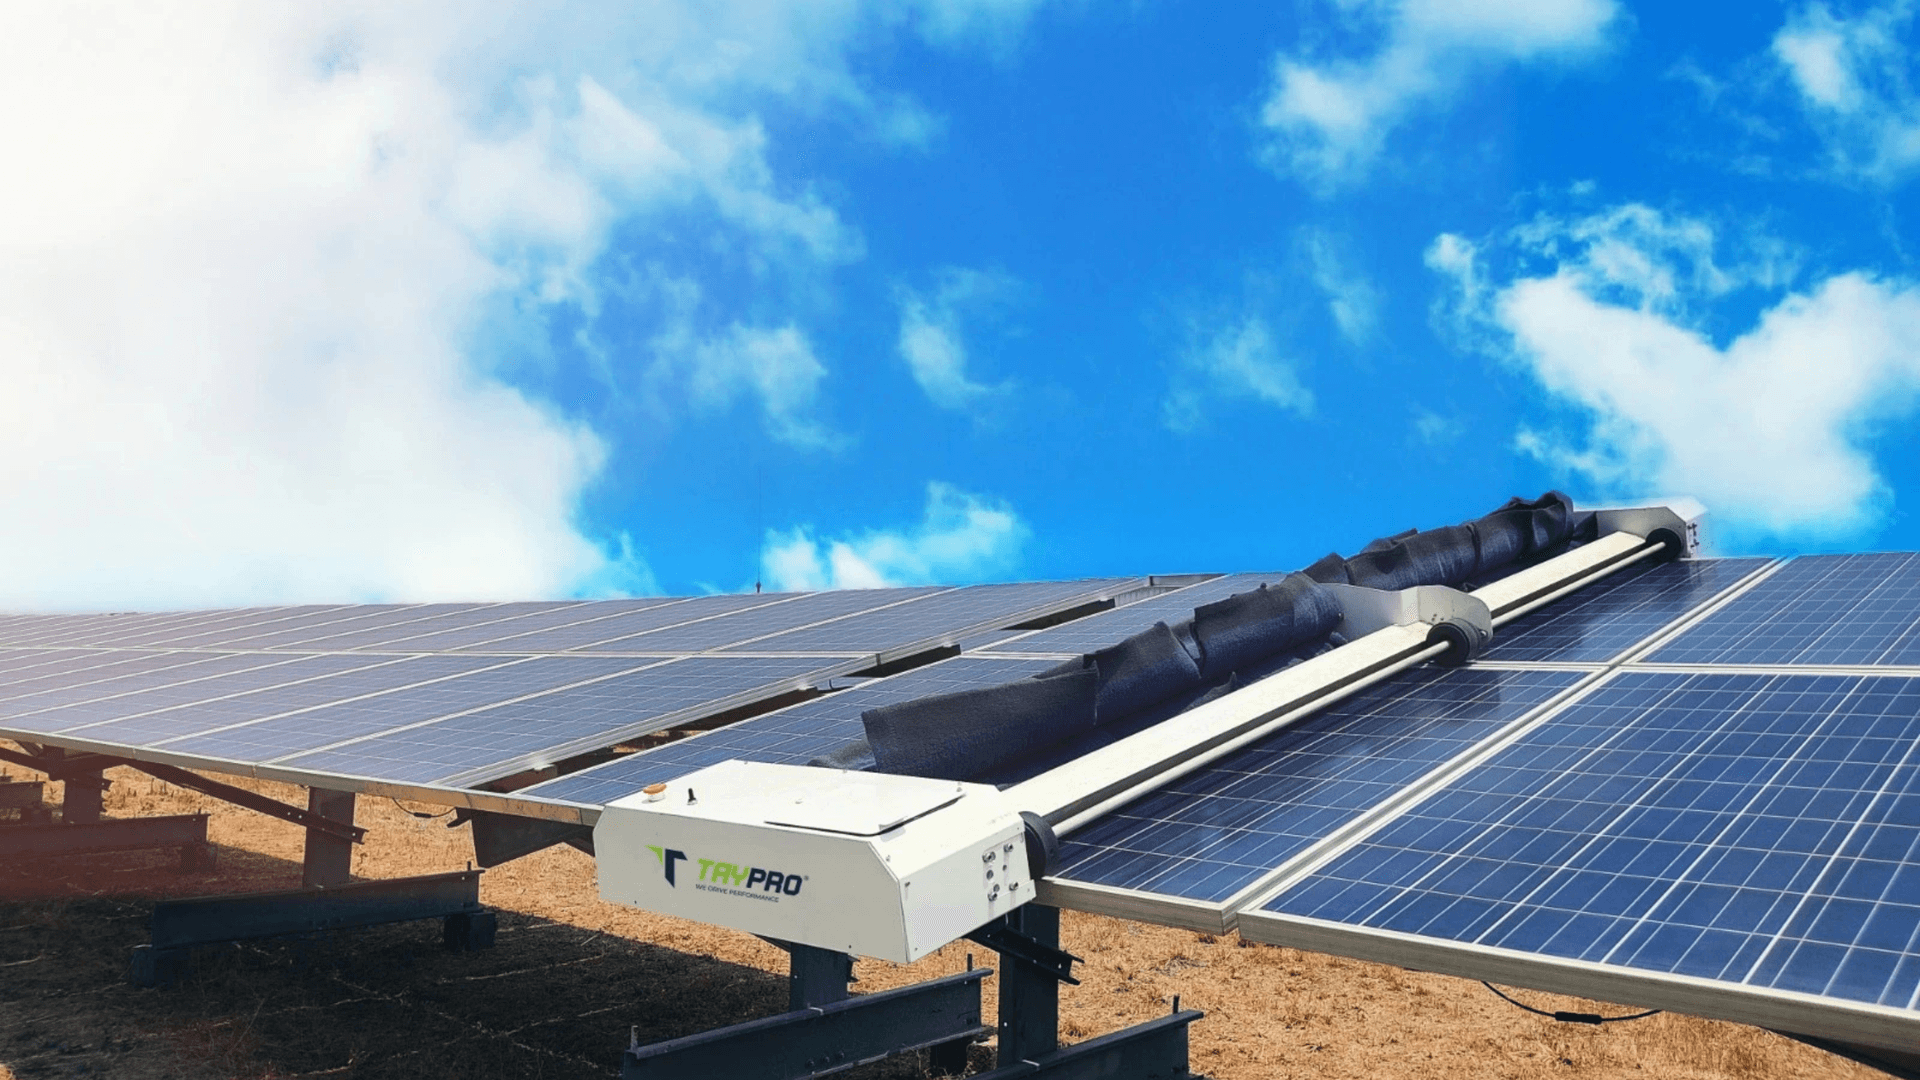
For utility-scale projects exceeding 50MW, OPEX planning must account for the high variability of manual cleaning cycles. While manual wet cleaning is often perceived as low-CAPEX, the recurring labor cost, water procurement, and truck mobilization for sites in Rajasthan or Gujarat typically push annual O&M spending to the 1.5% to 2% range of total project costs. By contrast, deploying a fleet of autonomous, waterless cleaning robots shifts the budget structure from variable labor-intensive costs to a more predictable, long-term capital maintenance profile.
When planning your annual budget, treat professional cleaning services as a two-tiered investment. First, the fixed component covers robotic hardware depreciation and annual maintenance contracts (AMC). Second, the variable component covers data-driven cleaning triggers managed through platforms like NECTYR. By replacing periodic calendar-based washing with trigger-based autonomous cleaning, plants in high-dust regions can often reduce the number of required cleaning events by 40% annually while maintaining higher average PR figures. This efficiency gain is essential for protecting the 25-year levelized cost of energy (LCOE) targets.
Asset managers should note that manual washing often leads to inconsistent cleaning quality across the site, especially in large 100MW+ blocks where supervisor oversight is challenging. Professional robotic cleaning services provide standardized pressure and coverage, which preserves module coatings and prevents micro-cracking often associated with improper manual scrubbing techniques. For planning, allocating a dedicated line item for 'Robotic Fleet Maintenance' rather than 'General Labor' allows for better tracking of the soiling loss recovery and ROI, providing clear performance metrics for reporting to stakeholders or ESG audit bodies.
Is a recurring cleaning service worth the investment on tracker-based plants?
For horizontal single-axis tracker (HSAT) plants, the ROI of a recurring cleaning service is significantly higher than on fixed-tilt installations due to the mechanics of bifacial energy capture. Because bifacial modules generate substantial power from the rear side, even light dust accumulation on the back surface acts as a performance ceiling. In arid zones like Rajasthan, tracking tables often trap dust along the torque tube, creating a recurring pattern of shading that degrades PR by 5–8% if left untreated for more than two weeks.
The investment in a professional cleaning service for trackers pays back through the mitigation of these specific mechanical shading losses. While manual cleaning on trackers is notoriously risky, often resulting in torque tube damage or micro-cracking from uncalibrated pressure washers, robotic solutions like the GLYDE-X or NYUMA-X provide consistent, torque-safe coverage. For a 50 MW tracker site, the cost of an annual O&M cleaning contract is usually recovered within 12–18 months through the combined benefits of consistent rear-side cleaning and reduced module degradation rates.
| Metric | Manual Wet Cleaning | Robotic Waterless Service |
|---|---|---|
| Water Usage | High (15,000+ liters/MW) | Near-Zero |
| Tracker Safety | Risk of structural damage | Engineered for tracker tables |
| Cleaning Frequency | Calendar-based (reactive) | Data-triggered (optimized) |
| Cost Profile | Variable Labor/Water cost | Fixed/Amortized Opex |
Managers should view tracker cleaning as a requirement for bifacial yield optimization rather than a simple hygiene task. By utilizing automated triggers through platforms like NECTYR, you can ensure that cleaning only occurs when the cost of accumulated soiling exceeds the cost of a cleaning run. This precision reduces the unnecessary expenditure of human labor while ensuring that the high-capex tracker infrastructure remains protected from the wear associated with manual cleaning crews.
Analyzing cleaning service models: CAPEX vs. OPEX
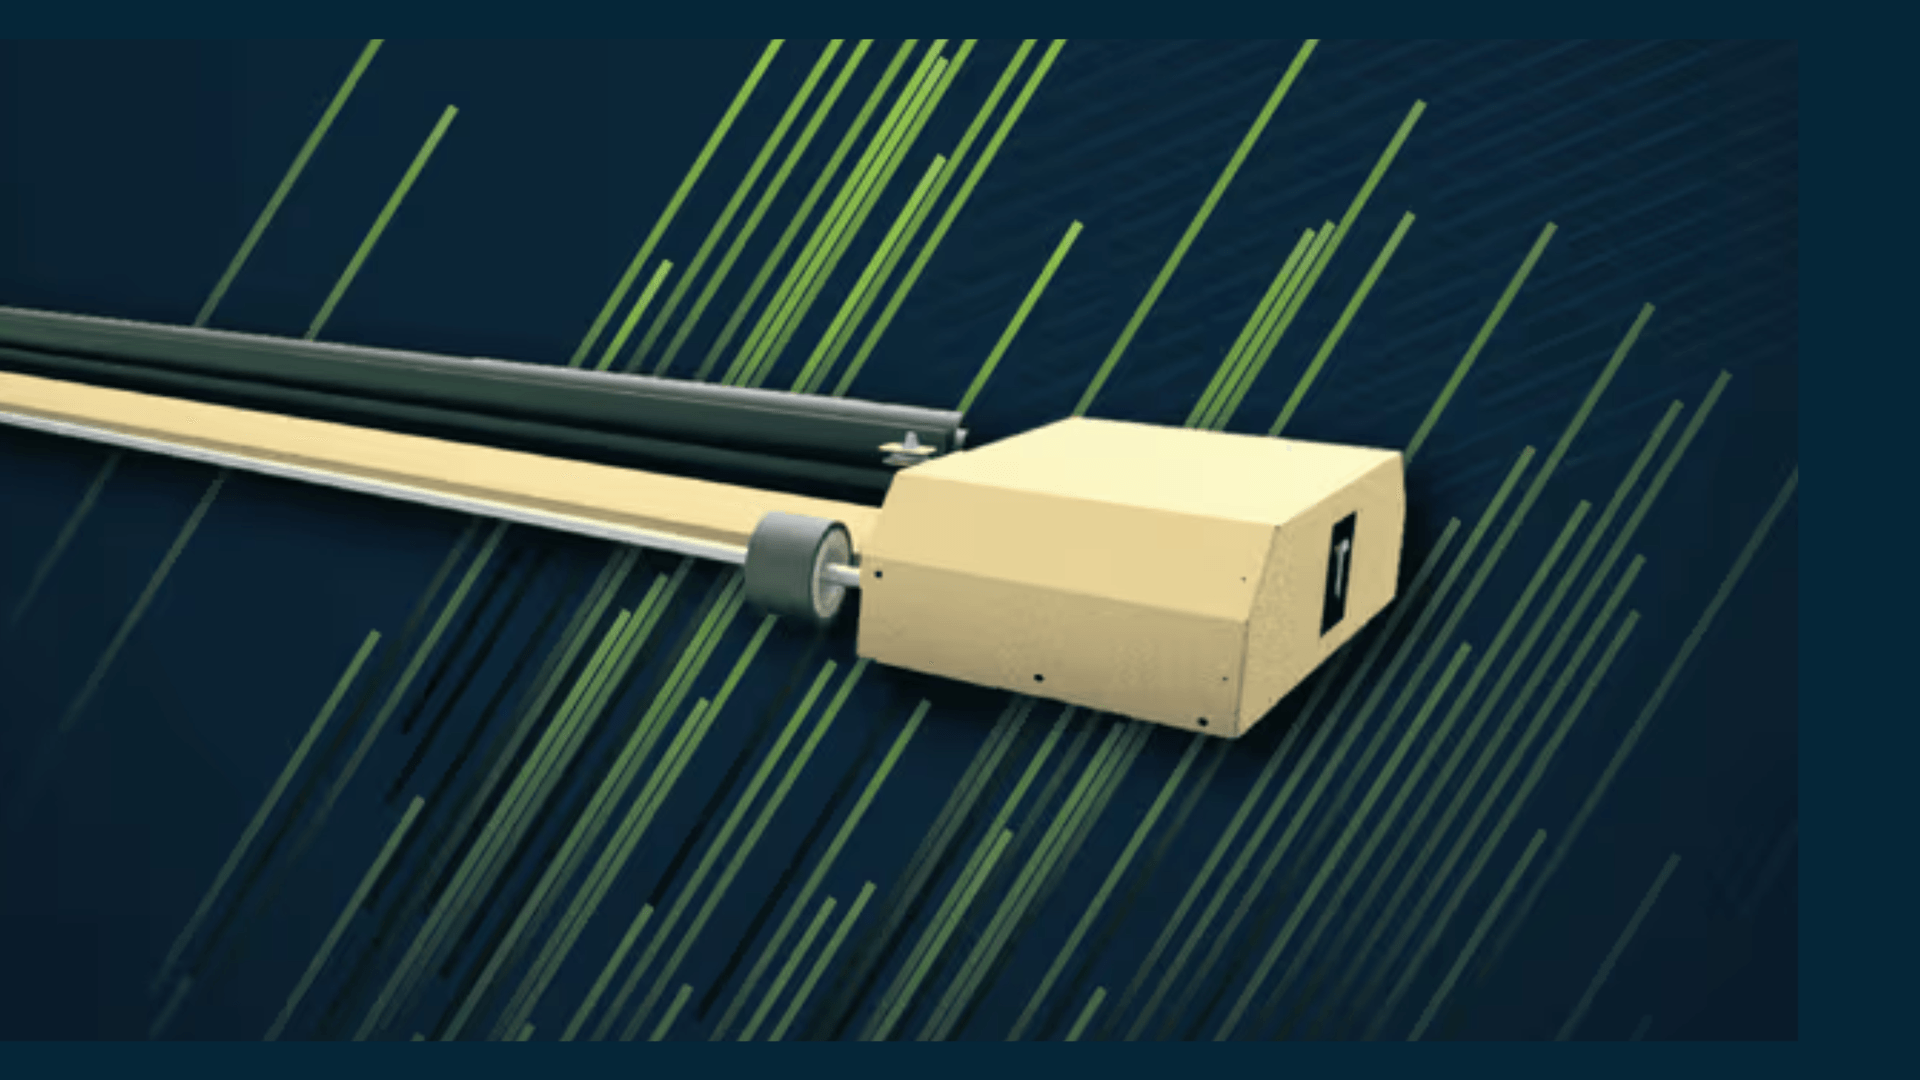
For large-scale utility plants in India, the decision between CAPEX-heavy robot procurement and OPEX-based cleaning services depends on your specific balance sheet and O&M staffing capabilities. A CAPEX model involves an upfront investment in robotics hardware, such as the GLYDE or NYUMA series, which shifts cleaning responsibility to your internal O&M team. This is often preferred by IPPs with an existing, well-trained workforce and long-term asset ownership goals, as it eliminates recurring service contractor premiums and allows for complete control over cleaning schedules using the NECTYR fleet portal.
Conversely, the OPEX model or 'Cleaning-as-a-Service' approach bundles the robot, maintenance, and expert personnel into a single, predictable line item. This structure is highly effective for developers looking to offload the technical risks of module damage, robotic uptime, and staffing turnover. By outsourcing to a service partner, you gain access to proven SLA-backed cleaning performance without tying up capital in hardware. This model is particularly attractive for plants where internal staff lacks specialized robotics training or for portfolio managers who require centralized reporting on soiling recovery without managing individual site logistics.
When planning for 50MW+ scale, a hybrid approach is often the most cost-efficient. Many operators invest in the robotic infrastructure as a CAPEX asset to reduce long-term depreciation, while maintaining an OPEX service contract for high-level monitoring, robot firmware management, and expert intervention. Regardless of the model, you should target an annual cleaning expenditure that does not exceed 1.5% to 2% of the plant CAPEX, ensuring that the cost of your solar panel cleaning service remains within the threshold of achievable revenue gains from performance restoration.
Decision checklist for selecting a cleaning partner
Choosing a solar panel cleaning service for a utility-scale project requires more than a simple cost comparison. You must vet partners against site-specific requirements to avoid operational risk and premature hardware failure. Use this checklist as your primary procurement guide to ensure technical and commercial alignment with your asset management goals.
- Service-Level Agreements (SLAs): Does the provider offer concrete performance guarantees linked to your plant's Performance Ratio (PR)? Ensure that contractual language covers penalties for cleaning-induced micro-cracks or damage to AR-coated modules.
- Fleet Monitoring Integration: Can the service provider integrate their operations with your existing NECTYR monitoring platform? Real-time data exchange is essential to verify that cleaning runs only trigger when soiling losses exceed your economic threshold.
- India-Specific Support: Verify the local footprint of your partner. A reliable service provider should have local warehouse centers and dedicated engineering teams within the same state as your site, ensuring spare part availability and quick turnaround for field repairs.
- Technology Versatility: Does the partner have experience with both fixed-tilt and tracker-based module configurations? For sites using horizontal single-axis trackers, confirm their robots can safely handle specific module tilt ranges (typically -52 to +52 degrees) without damaging the tracker drive or the panel frame.
- Safety and Compliance: Demand proof of compliance with MNRE and grid-operator safety standards. Your vendor must provide evidence of trained personnel, adequate insurance for robotic hardware, and strict adherence to electrical safety protocols during active cleaning cycles.
- Reference Sites: Ask for at least three references from operational 50MW+ sites in regions with similar dust profiles to your project. Specifically request data on water-consumption metrics and module degradation rates measured before and after the introduction of their professional cleaning service.
Key takeaways for plant managers
- Target annual cleaning expenditure between 1% and 2% of total plant CAPEX to maintain optimal cost-efficiency.
- Prioritize robotic waterless solutions for arid regions in Rajasthan and Gujarat, where manual water washing can consume 15,000+ liters per MW per cycle.
- Shift from reactive, calendar-based cleaning to data-triggered schedules to prevent over-cleaning and reduce unnecessary wear on module surfaces.
- Choose a cleaning partner that offers a hybrid model, allowing you to combine CAPEX investment in hardware with OPEX-based technical monitoring and maintenance support.
Sources and further reading
Frequently asked questions
For utility-scale solar plants in India, a professional solar panel cleaning service acts as a primary lever to recover lost revenue from soiling. By optimizing your cleaning intervals and method, you can effectively bridge the performance gap between manual, inconsistent washing and high-frequency automated cycles.
Typical O&M budgets for utility-scale PV plants range from 1% to 2% of total CAPEX. Cleaning costs often form the largest variable component of this budget, as consistent cleaning is required to keep soiling-related energy losses below 5%.
For 50MW plus portfolios, the choice depends on labor availability and desired Performance Ratio stability. Automated robotic systems are increasingly favored as they reduce long-term variable OPEX and can cut water consumption by up to 90% compared to manual wet washing.
Automated systems stabilize Performance Ratio metrics by preventing soiling-induced shading and hot spots, which can lead to premature module cell degradation. By reducing reliance on manual labor, these systems lower long-term variable OPEX while ensuring consistent module performance.