Quick answer: Sizing your robot fleet for utility-scale plants
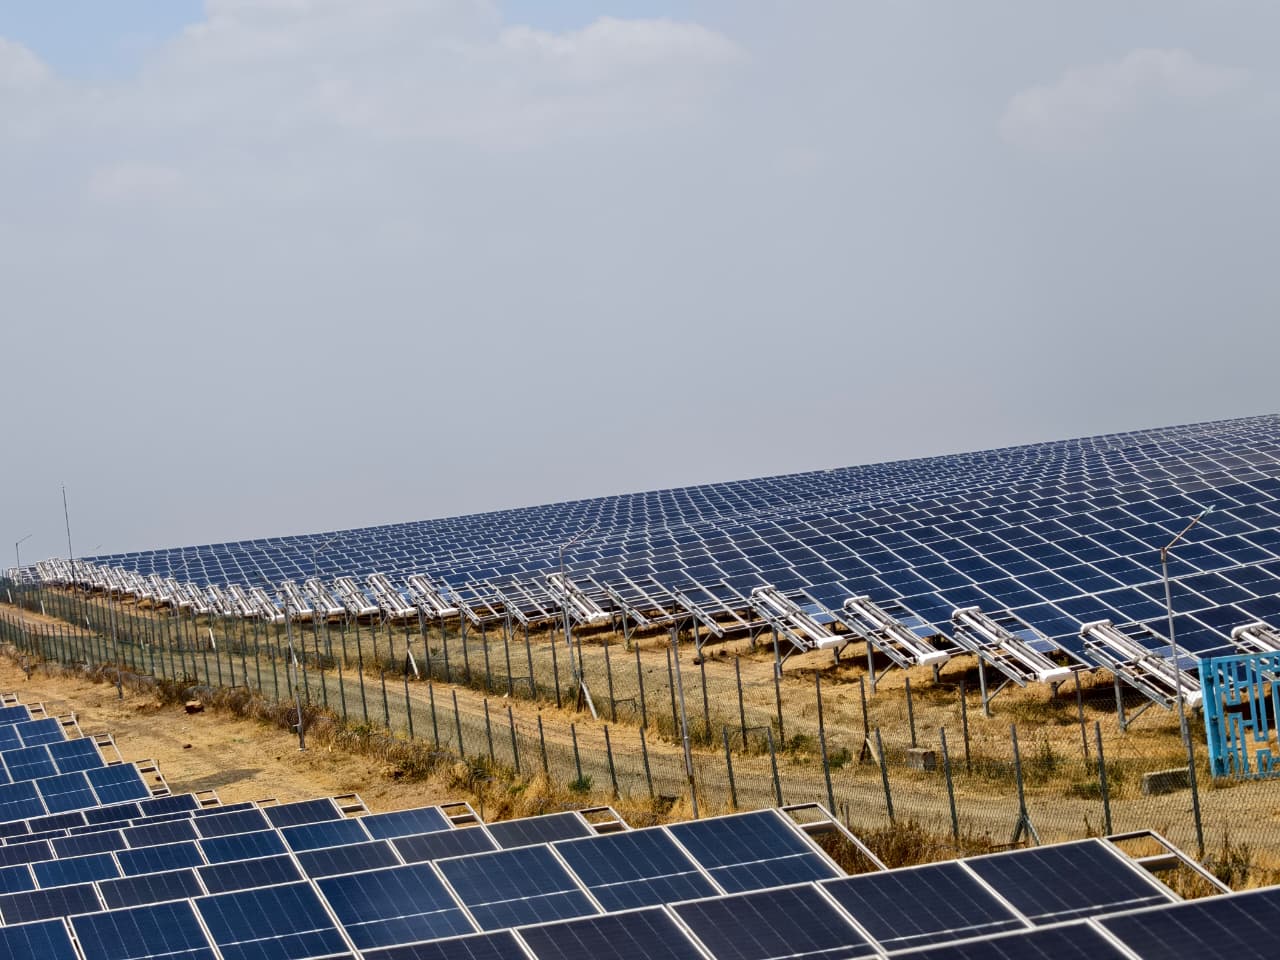
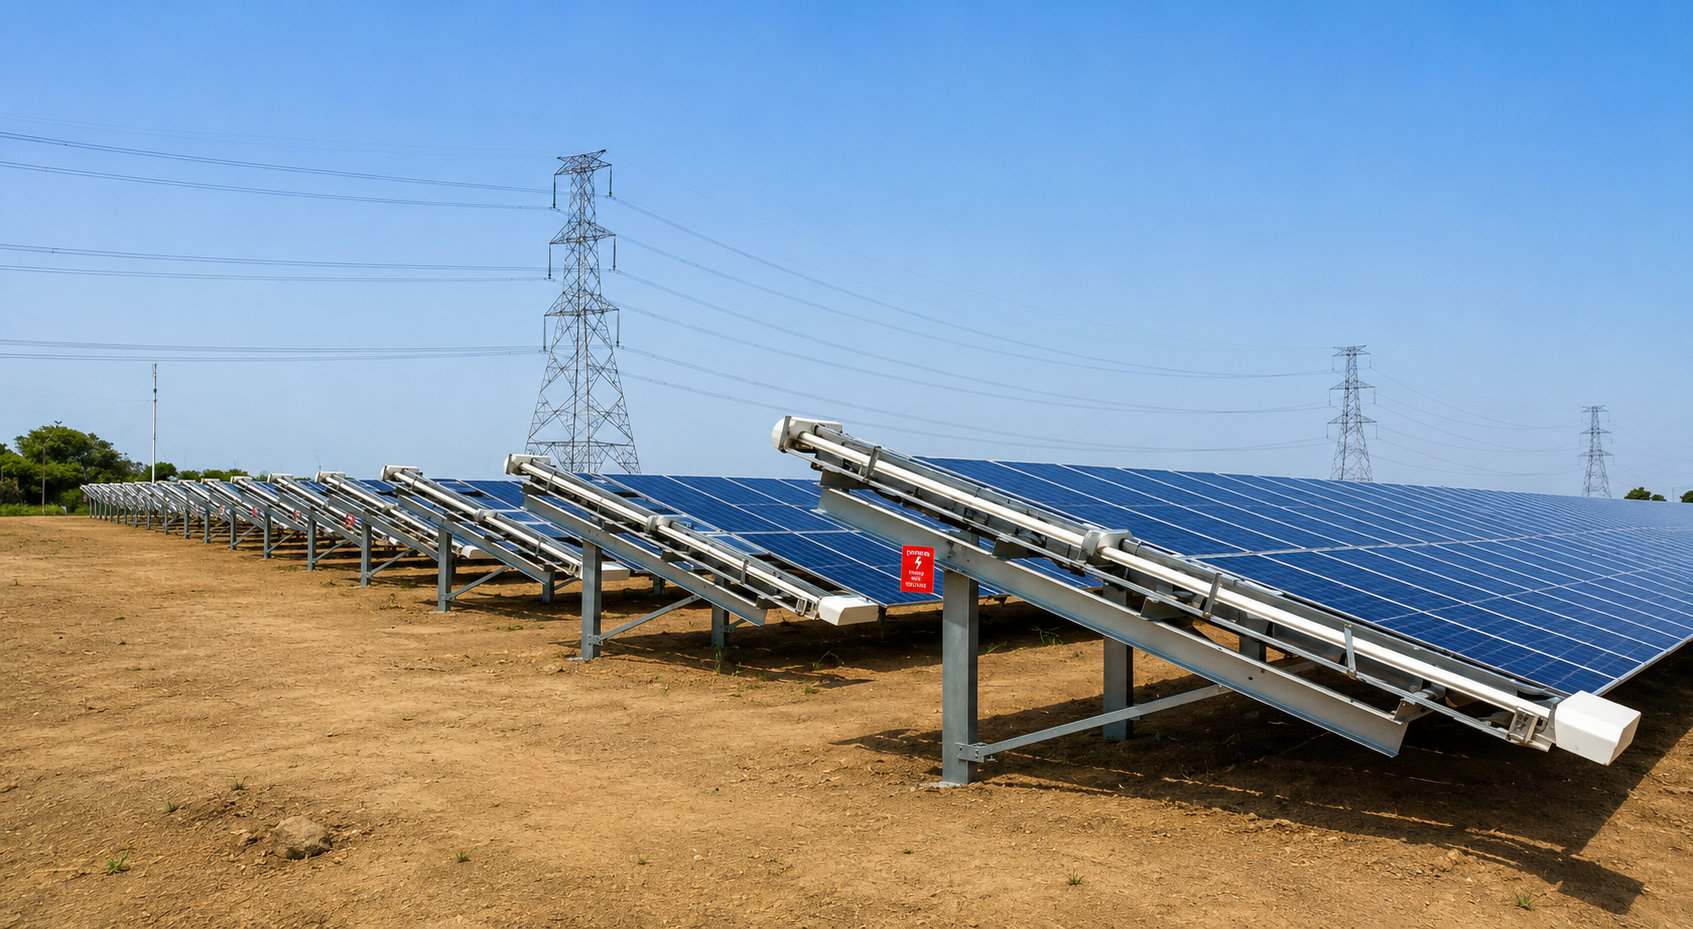
Determining the optimal robot fleet size requires balancing site-specific soiling rates, table geometry, and required Performance Ratio (PR) recovery. For a 100 MW utility-scale plant in India, typical deployments range from 50 to 120 robots, though this density depends heavily on the specific row length and local dust profiles. Plant managers must calculate the required cleaning frequency to bridge the gap between heavy soiling losses, which can range from 6% to 15% in arid regions, and the available charging infrastructure.
- Fleet Density: Average deployments range from 50 to 120 robots per 100 MW, varying by site topography and row length.
- Soiling Impact: Arid Indian regions experience 6% to 15% annual yield losses, necessitating high-frequency, autonomous maintenance cycles.
- Cleaning Cycle: Aim for a full-site cleaning frequency of 3 to 7 days, tailored to local PM2.5 levels and site-specific soiling accumulation rates.
- Water Conservation: Robotic systems reduce water dependency from 15,000 litres/MW per cycle to near-zero, providing massive operational savings in water-stressed regions.
- Budget Efficiency: While fleet CAPEX is significant, it is offset by stabilized PR and lower long-term per-cleaning OPEX compared to manual labor crews.
Proper sizing is not just about quantity but about matching the fleet to your site’s operational constraints, such as row length and inter-row terrain. Refer to our ROI price calculator to model how different fleet densities impact your specific project payback and O&M overhead. Integrating tools like site preparation planning ensures that your chosen robot density is supported by the physical reality of your tracker tables or fixed-tilt structures.
Factors influencing robot fleet sizing requirements
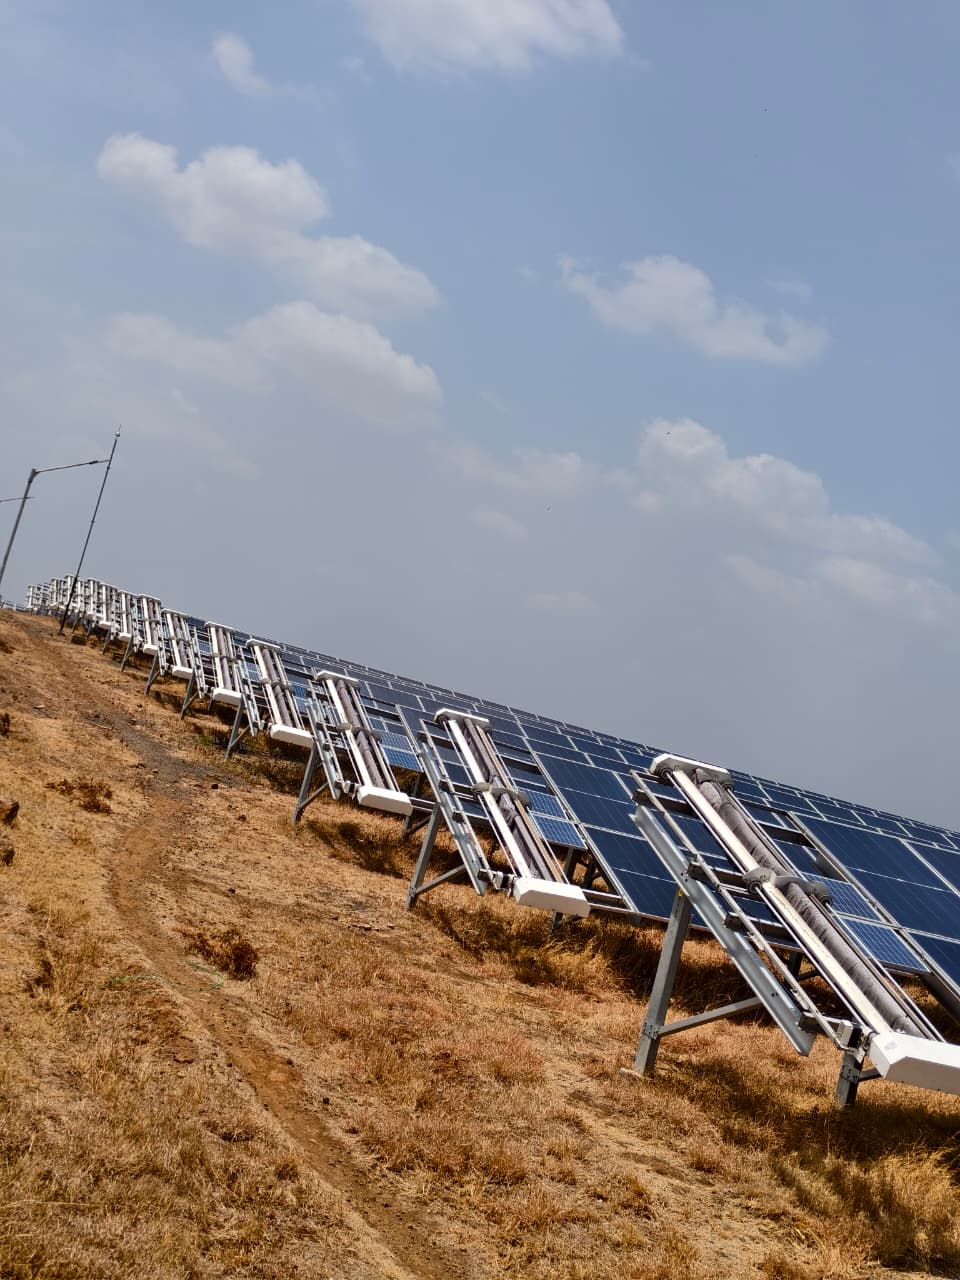
Fleet sizing for a utility-scale project is rarely a one-size-fits-all calculation. Beyond simple MW capacity, your deployment density depends on the physical layout and the specific regional constraints of your Indian site. The primary drivers are the soiling rate, row geometry, and the time windows available for autonomous operation without interfering with daily production.
Site topography and row length constraints
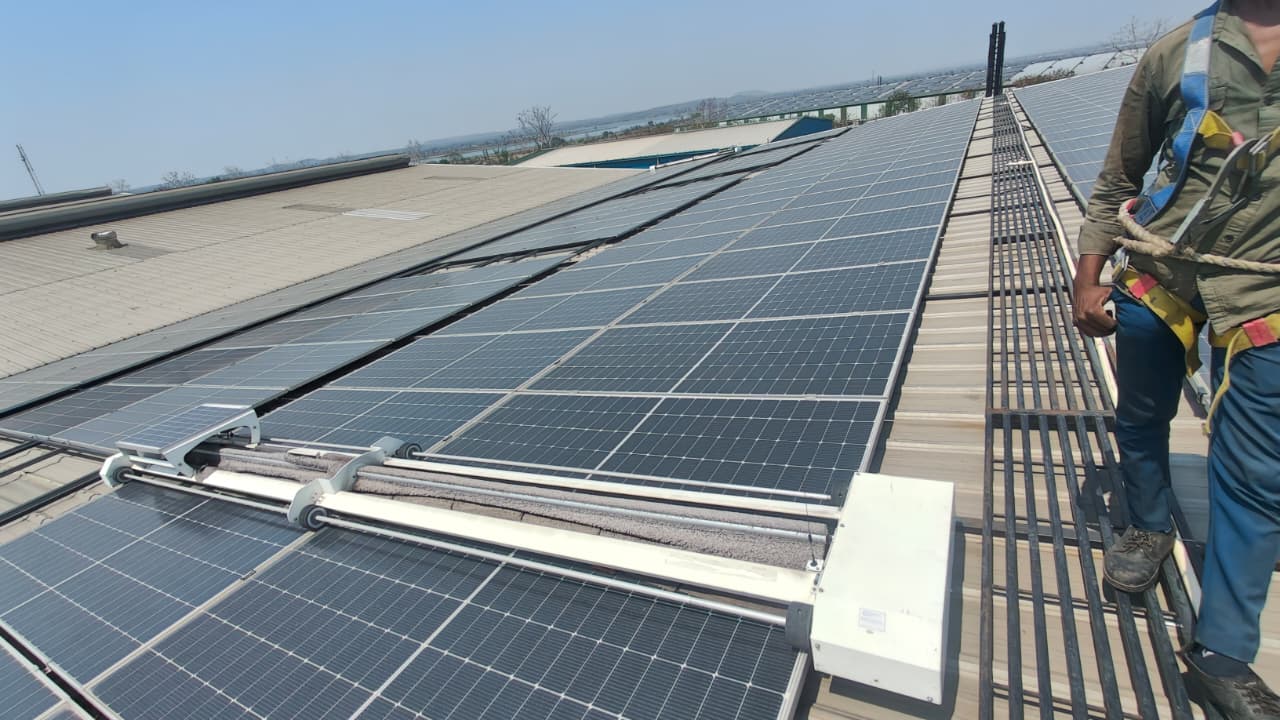
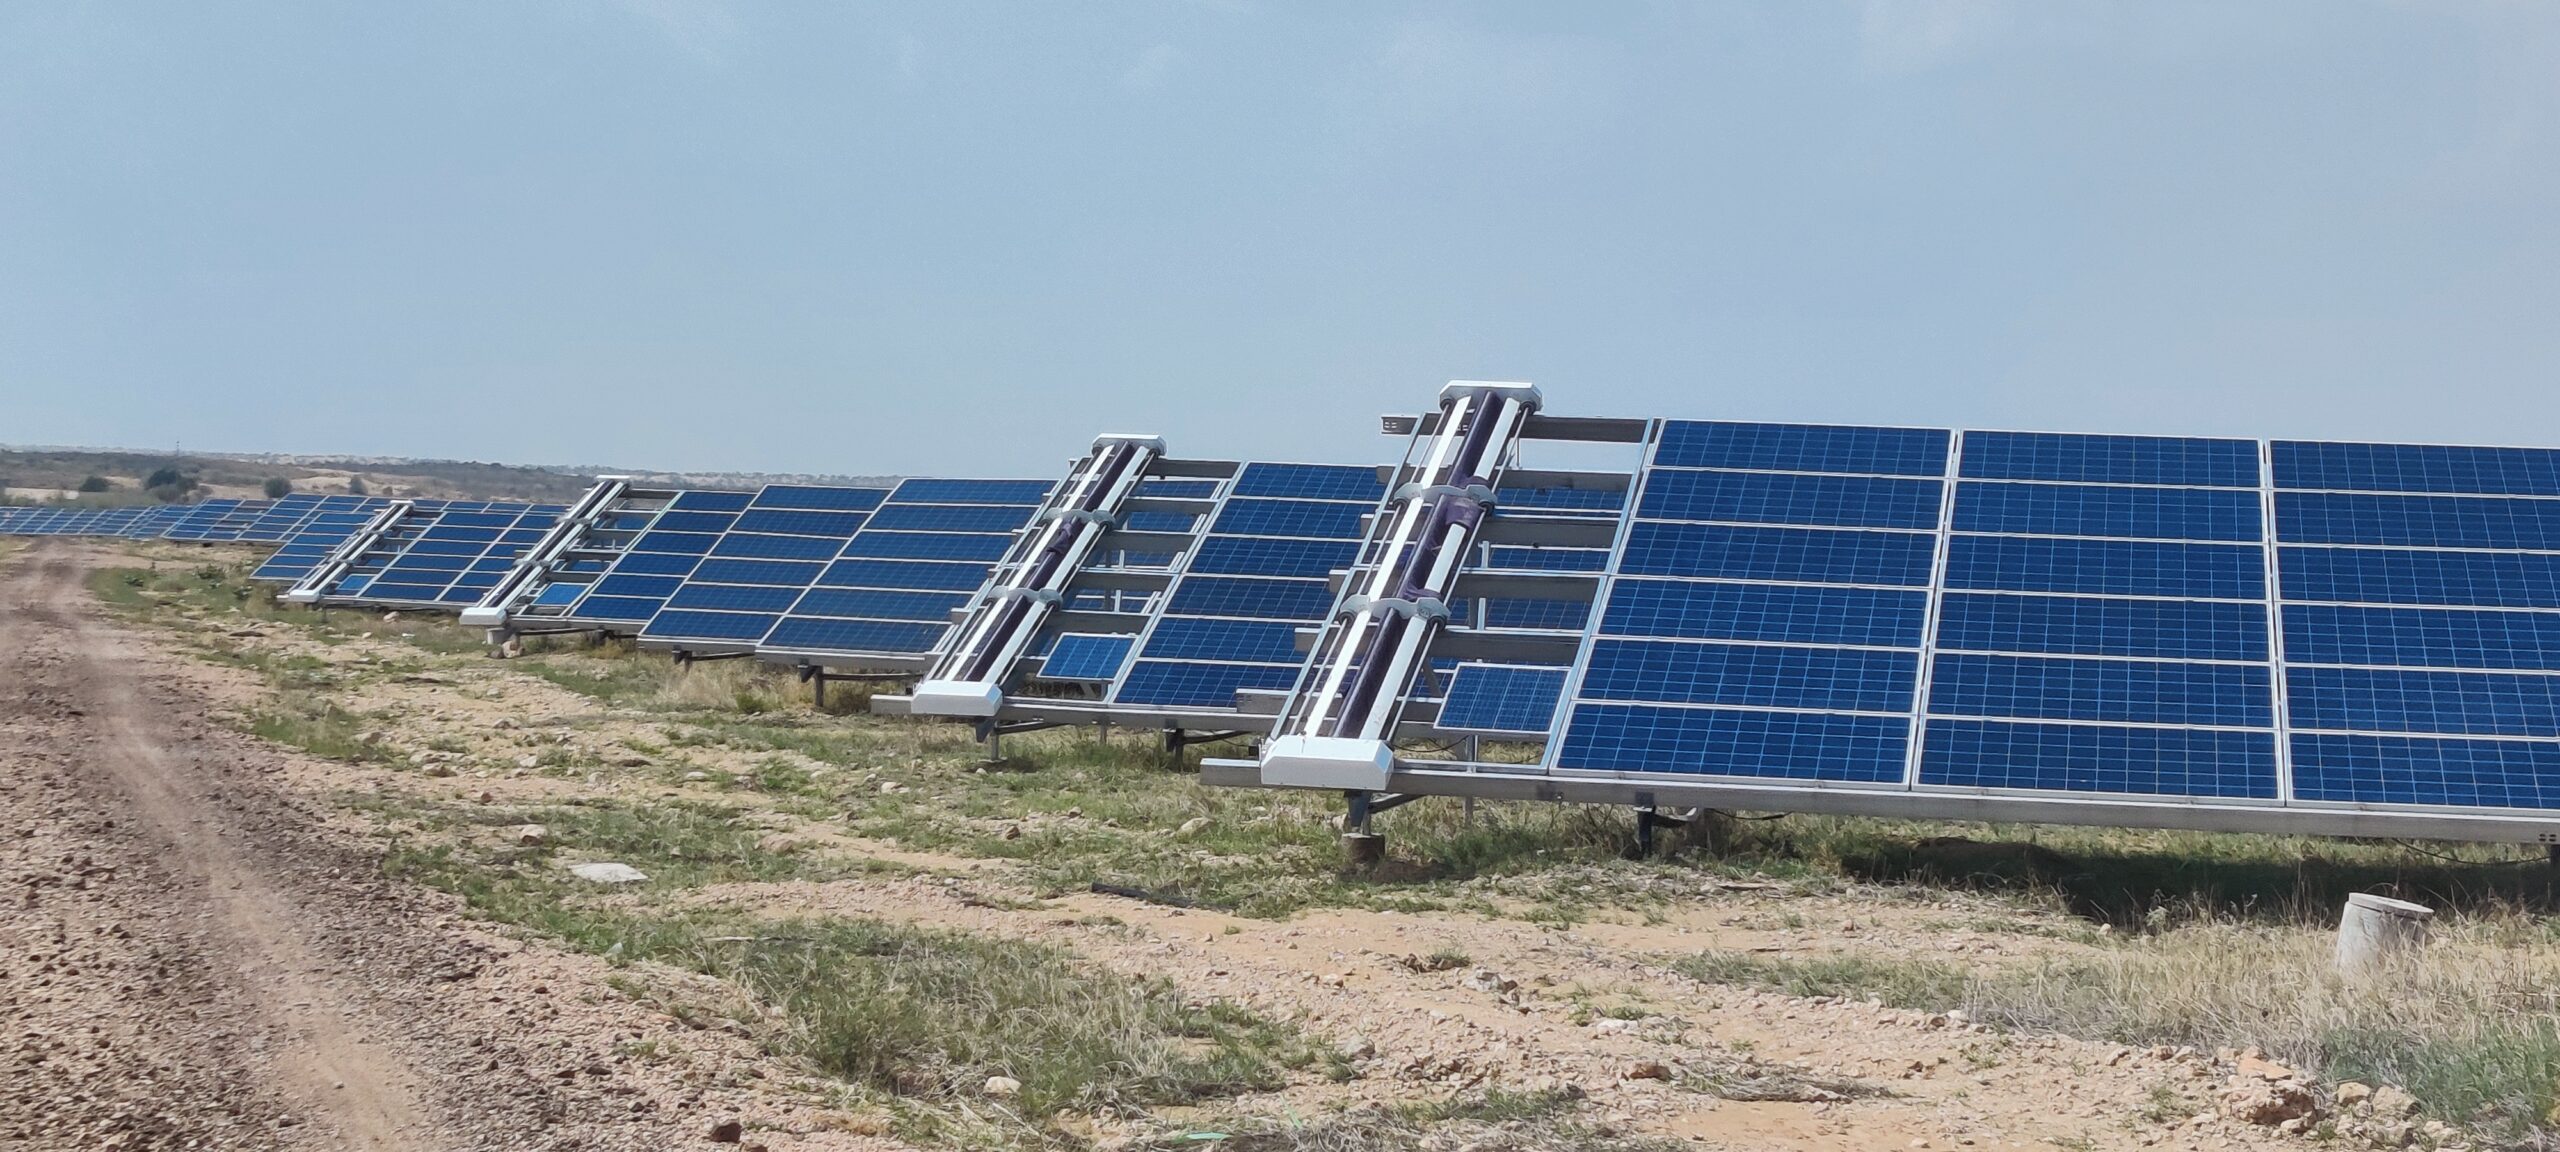
For horizontal single-axis tracker (HSAT) plants, the length of the tracker row directly determines the number of units required. On 100 MW installations, rows are often extended to maximize space, but this increases the cleaning duration per robot. If a row exceeds 100 meters, you must ensure your robot fleet is rated for the required travel distance per charge, as excessive return-to-base trips for battery management will decrease overall cleaning frequency.
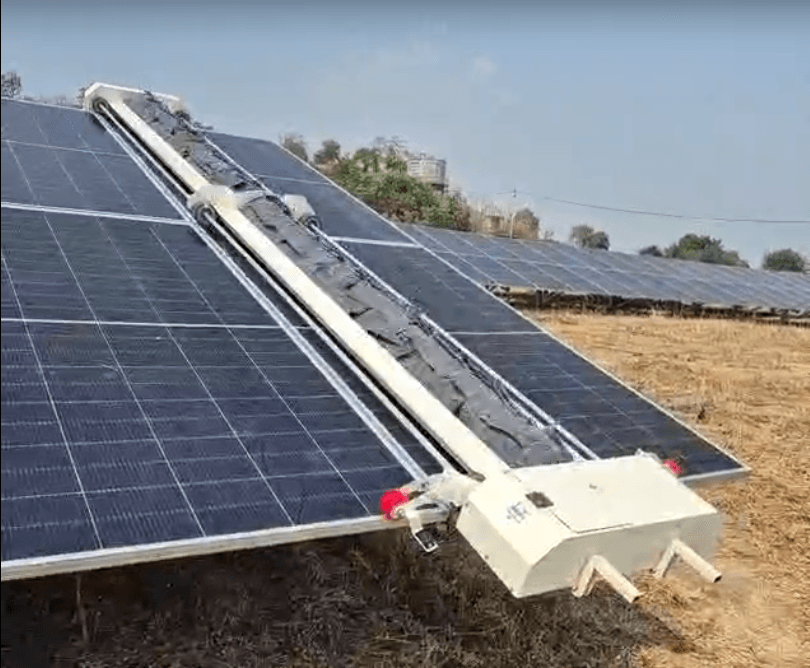
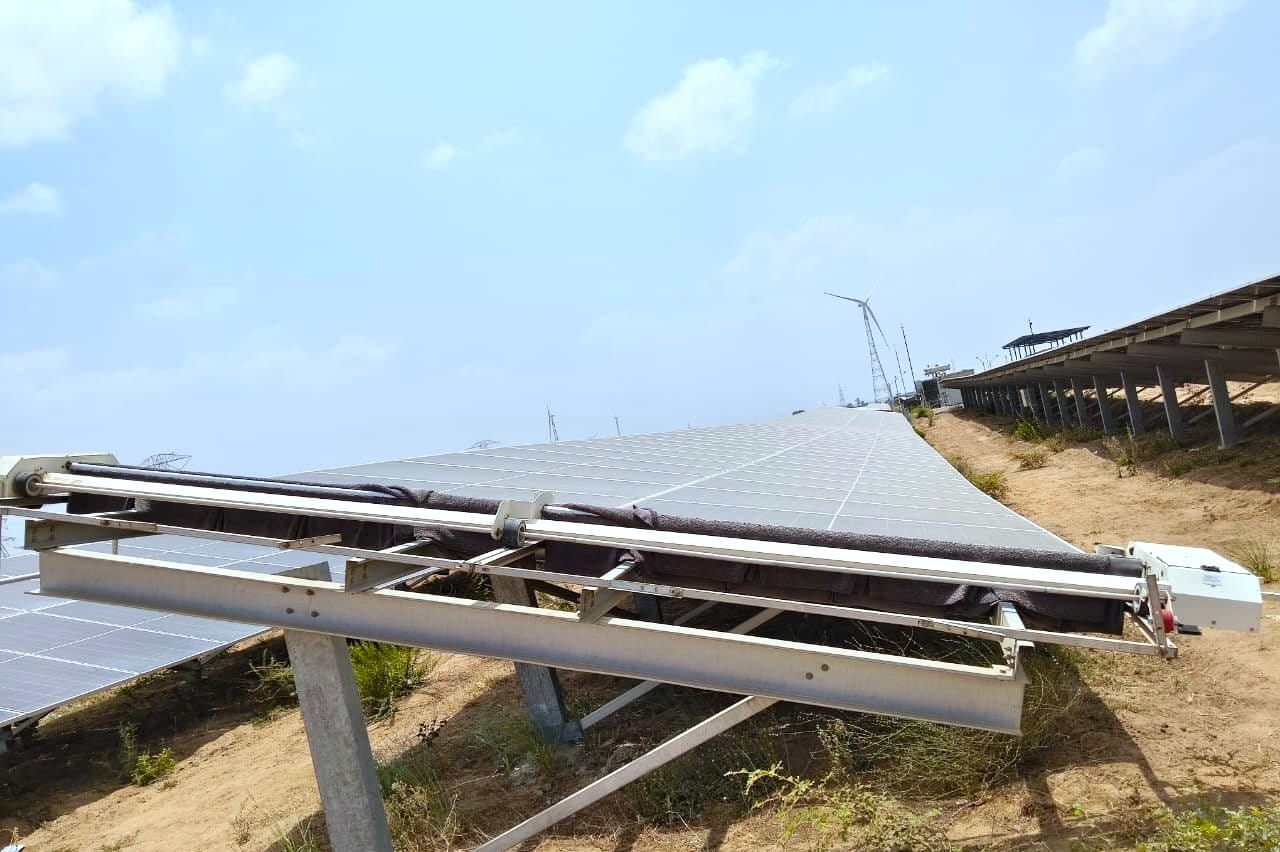
Fixed-tilt plants present a different challenge involving row-to-row transfer. If your site blocks are divided by internal roads, your fleet sizing must account for the logistical overhead of transferring robots between rows. Advanced solutions like CRADYL allow a single robot to service multiple scattered blocks, effectively reducing the total robot-per-MW ratio compared to manual-only or fixed-robot-per-row models. Refer to our guide on site preparation planning to ensure that row spacing and terrain are compatible with your chosen fleet density.
Climatic and soiling variability
In arid regions like Rajasthan, where annual yield losses can reach 15%, the fleet density must be higher to ensure the entire site is covered within a 3-to-5-day window. In contrast, coastal or humid regions might allow for a lower fleet density, as dew-based soiling consolidation may require a different, less frequent cleaning approach. Asset owners should prioritize fleet capacity based on their specific historical soiling data rather than industry-wide averages to avoid over-investing in hardware or under-investing in PR recovery.
Maintaining a balanced fleet allows for consistent performance without the degradation risks associated with aggressive manual brush cleaning on sensitive anti-reflective coatings. When you size your fleet correctly, you stabilize the PR curves, which is the most critical metric for long-term PPA generation compliance on India utility-scale plants.
How many robots per MW are actually needed for Indian arid zones?
In arid zones like Rajasthan and parts of Gujarat, where soiling rates often exceed 10% monthly, deploying 1 to 1.5 robots per MW is the industry-standard starting point for balancing PR recovery with equipment costs. If your plant utilizes long-row trackers, this ratio often tightens toward 1.2 robots per MW to ensure that every row receives a cleaning cycle at least once every three to five days.
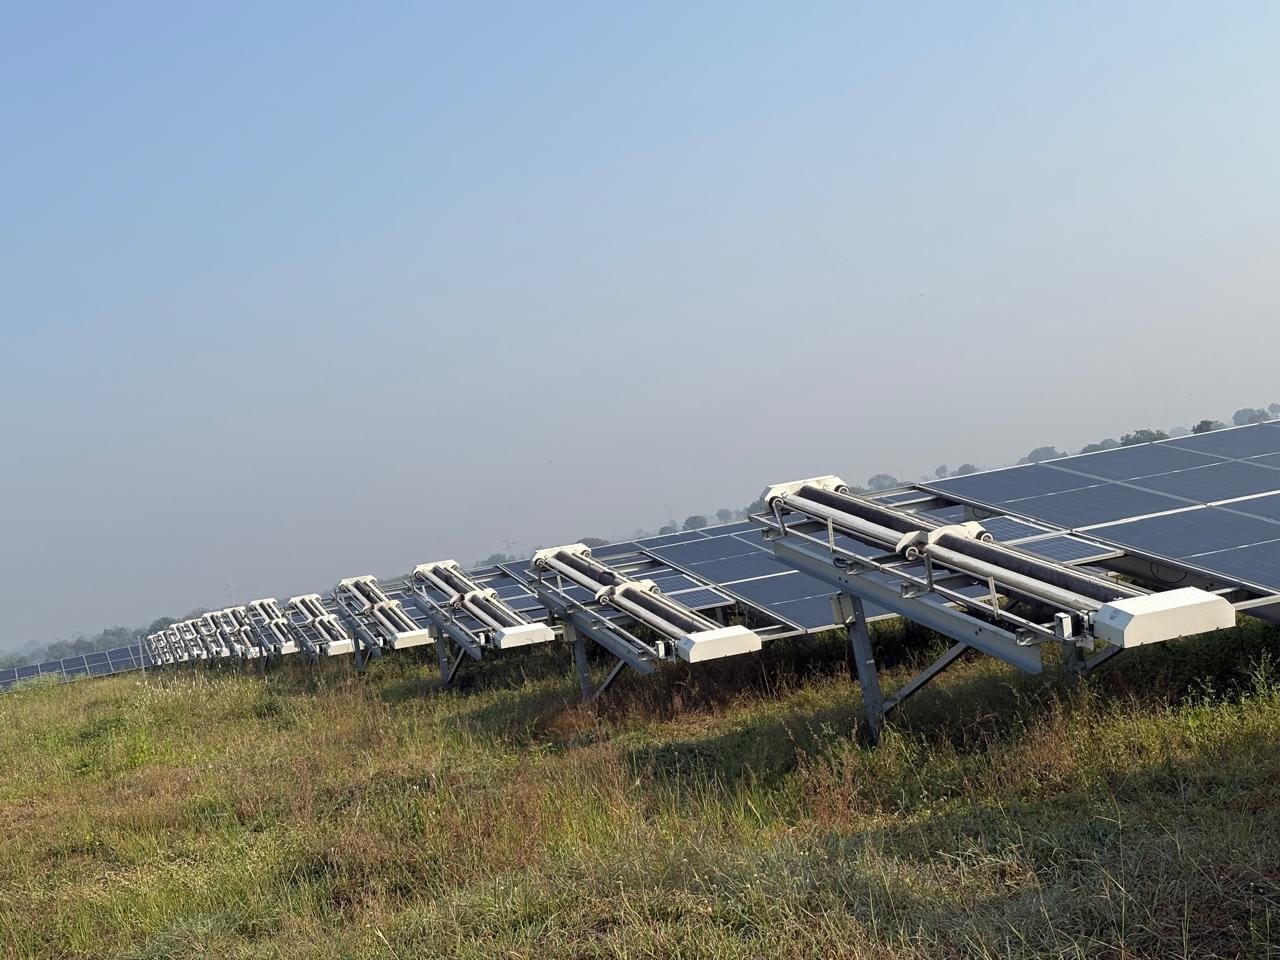
You must avoid over-provisioning your fleet by calculating the exact row-length coverage of your chosen unit. For instance, a system that cleans 2 km per charge can handle larger blocks of rows than one limited to 1 km. Utilizing advanced mobility tools such as CRADYL allows a single robot to transfer across multiple rows, effectively reducing the necessary robot-per-MW density while maintaining the same cleaning frequency. This approach is highly effective for utility-scale sites with scattered rows or varying inter-row distances.
Key fleet density thresholds for India utility plants:
- High Soiling (e.g. Rajasthan desert): 1.2 to 1.5 robots per MW to maintain a 3-day cleaning cycle.
- Moderate Soiling (e.g. Karnataka, Maharashtra): 0.8 to 1.0 robots per MW to sustain a 5-to-7-day cleaning cycle.
- Coastal/Humid regions: 0.5 to 0.7 robots per MW, as dew-based soiling consolidation often reduces the physical urgency of daily dry cleaning.
Asset owners should audit their specific historical soiling loss data to determine if a static fleet density is sufficient or if a seasonal adjustment strategy is required. If your project faces extreme dust storms between March and June, you may need a temporary increase in fleet availability or a higher robot-to-row ratio to prevent irreversible soiling accumulation. Refer to our analysis of seasonal soiling rates to refine your deployment model based on regional climatic shifts.
Investing in autonomous fleets for these regions is not just about avoiding water costs but about preventing permanent yield erosion caused by abrasive manual cleaning on sensitive anti-reflective modules. By calculating your fleet based on 5-day cycle PR recovery targets, you secure the generation consistency required to meet PPA guarantees throughout the year.
Step-by-step process for calculating your robotic deployment
Sizing a fleet for a utility-scale plant requires a shift from manual headcount planning to data-driven operational scheduling. Follow this workflow to determine your equipment needs while maintaining site uptime and performance targets.
1. Define your cleaning frequency requirements
Begin by calculating your site-specific soiling loss percentage. Arid utility sites in India often require a cleaning interval of 3 to 5 days to prevent permanent yield erosion. Use your historical PR data or satellite-based soiling analytics to confirm the maximum acceptable days between cleanings.
2. Map your row geometry
Segment your site into logical blocks based on tracker rows or fixed-tilt tables. Identify rows that can be grouped for a single robot by checking mechanical constraints such as inter-row spacing and end-of-row rail availability. If you are using CRADYL for autonomous row transfer, you can group multiple scattered rows into a single unit of coverage, significantly reducing the total robot count per MW.
3. Audit mobile capacity versus cleaning throughput
Assess the daily cleaning capacity of your robot models. A typical robotic unit covers 1.6 km to 2.2 km per charge. For a 50 MW plant with 80-meter rows, your calculation must account for both the total distance of all rows and the time needed to move the robot between them. Remember to account for battery charging windows during peak daylight hours when generation is high, as this affects the net available hours for daily operation.
4. Run a pilot block assessment
Before full-fleet deployment, initiate a pilot cleaning program on a 5 MW representative block. This validates if your predicted robot-to-MW ratio holds up against local variables like topography or bird droppings. Monitor PR recovery on the pilot block for 30 days to refine your fleet size before committing to a site-wide CAPEX or OPEX procurement plan. For additional context on mapping your site layout, refer to our guide on tracker site prep for automatic cleaning.
5. Factor in redundancy and maintenance
Always maintain a 5% to 10% buffer of spare robots to account for units undergoing periodic maintenance or unexpected repairs. A properly scaled fleet, as detailed in our technical comparison of cleaning systems, ensures that your PR curves remain stable even when individual units are pulled for service or battery cycling.
Managing fleet battery and charging logistics for continuous cleaning
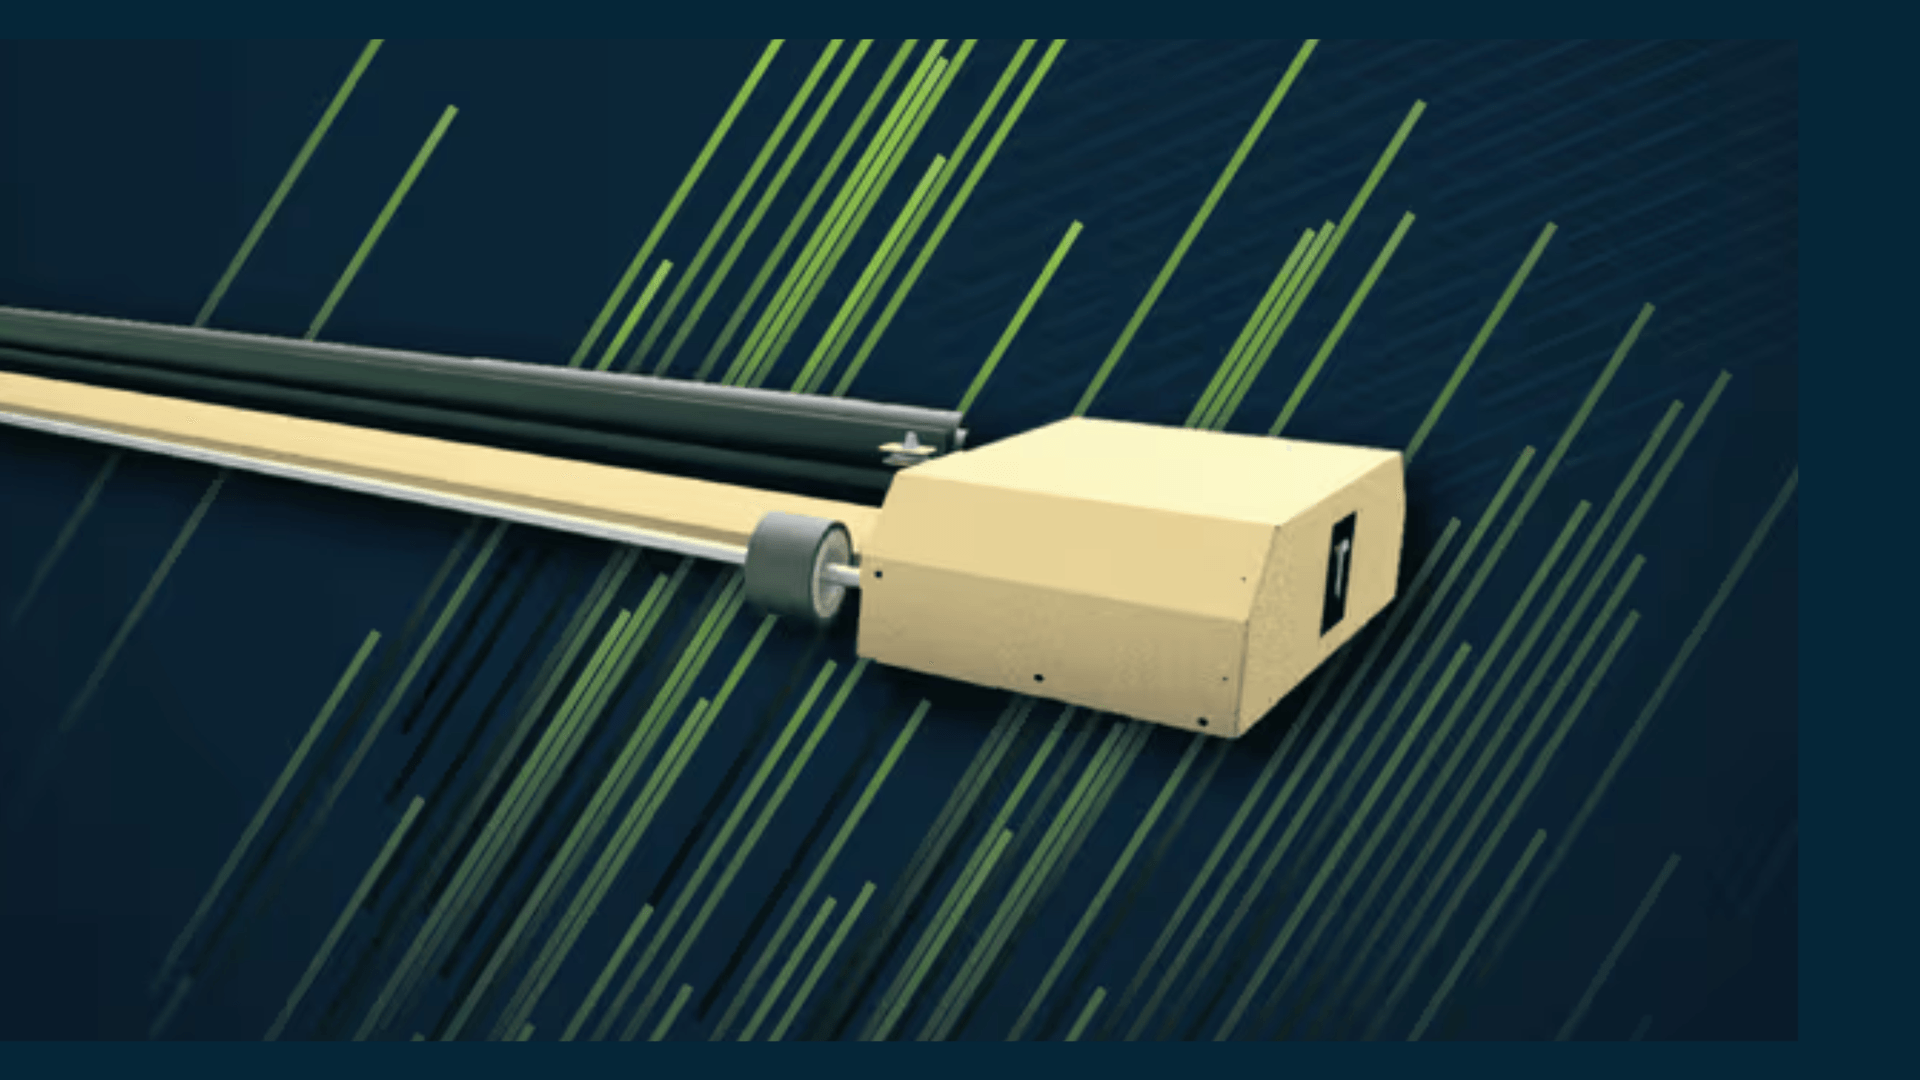
For a 50 MW to 100 MW site, battery management is the single most critical factor in achieving the target 3 to 5 day cleaning cycle. Utility-scale robots like the NYUMA or GLYDE series require roughly 4 to 6 hours of charging for every 1.6 km to 2.2 km of autonomous coverage. If your site management relies on manual plug-in charging, you will face significant downtime and labor bottlenecks. Instead, implement self-docking infrastructure where robots automatically return to integrated charging stations at the end of every row or designated block.
Fleet density must account for the specific discharge rates of your battery technology, particularly under high-heat conditions common in Rajasthan or Gujarat. High ambient temperatures can reduce effective discharge capacity by 10% to 15%. To offset this, divide your plant into autonomous sectors where a localized CRADYL row-transfer system manages the robot fleet across scattered rows. This ensures that a single robot can complete multiple row-passes without the need for manual transport, maximizing the utilization rate of each unit's daily energy budget.
Monitor your fleet health through real-time telemetry via the NECTYR operations portal to avoid deep-cycle depletion. Aim to keep robots within an 80% to 20% state-of-charge window to preserve battery longevity over a 5 to 7 year asset lifecycle. By scheduling your cleaning operations during off-peak irradiance hours, you reduce the load on the grid-tied docking infrastructure and ensure the robots are fully charged and ready for the next cleaning cycle. This data-driven approach, as discussed in our guide on optimizing fleet battery and charging logistics, is essential for maintaining PPA generation commitments in large-scale installations.
Comparing fleet scaling against manual labor scheduling
Manual labor scheduling for a 50 MW plant typically requires a crew of 20 to 30 workers to achieve a full cleaning cycle within 15 to 20 days. In contrast, an autonomous robotic fleet reduces this requirement to a handful of onsite technicians who manage NECTYR telemetry and perform mechanical maintenance. While manual crews face diminishing returns due to fatigue and inconsistent water pressure, a robotic fleet maintains a constant cleaning throughput across all blocks. When comparing these approaches, you must factor in the hidden costs of manual labor, including insurance, safety compliance, daily transport, and the inevitable drop in cleaning quality during the second half of each shift.
For a plant manager, the transition involves moving from a head-count-based budget to a machine-availability-based model. A robotic fleet does not take breaks, and it operates regardless of ambient heat that would otherwise limit manual labor safety. By automating the cleaning cycle, you gain predictable PR recovery curves that allow for tighter generation forecasting. To see how these operational differences translate to long-term costs, refer to our analysis on robotic vs manual cleaning performance. Planning for a fleet also removes the variable quality of brush-based manual cleaning, which can lead to micro-scratches on module anti-reflective coatings over several years of high-frequency cycles. Successful fleet scaling requires shifting your perspective from daily labor supervision to a model focused on fleet uptime and battery health management.
What plant managers should do next
- Conduct a site-wide soiling audit to determine your current PR loss baseline before sizing the fleet.
- Use our investment payback calculator to compare CAPEX versus OPEX fleet deployment models.
- Define your site layout constraints, including inter-row spacing and tracker tilt ranges, to select the correct robot models like GLYDE-X or NYUMA-X.
- Pilot a 5 MW block to validate your robot-to-MW ratio against local dust chemistry and topography before full-site procurement.
- Review the NECTYR fleet management requirements to ensure your site communications infrastructure supports real-time telemetry.
Sources and further reading
Frequently asked questions
Determining the optimal robot fleet size requires balancing site-specific soiling rates, table geometry, and required Performance Ratio (PR) recovery. For a 100 MW utility-scale plant in India, typical deployments range from 50 to 120 robots, though this density depends heavily on the specific row length and local dust profiles.
Arid regions in India often face 6% to 15% annual yield losses due to dust. This necessitates high-frequency maintenance cycles of 3 to 7 days, which requires a higher density of robots per MW to ensure consistent Performance Ratio recovery compared to sites with lower PM2.5 levels.
While increasing operational hours may provide some flexibility, the number of robots is primarily limited by the physical row geometry and the need to complete a full-site cleaning cycle within a specific window. Undersizing the fleet risks failing to meet the required cleaning frequency, which can lead to significant energy losses in high-soiling environments.
Undersizing the fleet leads to inadequate cleaning frequency, causing the Performance Ratio to drop due to prolonged exposure to dust and debris. This inefficiency forces a reliance on manual labor, which increases long-term per-cleaning OPEX and negates the benefits of transitioning to a near-zero water usage automated system.