A cost-benefit analysis that only lists cleaning invoices misses the point. The benefit side is megawatt-hours you would have lost to dust; the cost side is everything required to prevent that loss, including delayed crews after storms, tanker surcharges, robot abort nights, and management time arguing with AMC vendors about scope.
This guide builds a defensible cleaning business case for Indian utility plants from 10 MW to 100 MW: benefit estimation, cost lines, service vs in-house vs robot paths, and a worked 10 MW example finance teams can audit.
Quick answer
- Benefit = avoided soiling MWh multiplied by tariff (plus optional water savings).
- Cost = labour plus water plus mobilization plus robot O&M plus downtime over five years.
- Use site soiling and PR data, not brochure averages from vendors.
- Include storm surge scenarios; average months hide May losses.
- Worked structure: 10 MW robotic vs manual comparison.
Benefit side: estimating recovered MWh
Start from clean-baseline PR established after a verified campaign on reference modules. Compare against actual PR during soiled periods. Convert PR gap to MWh using measured irradiance and active capacity, not nameplate alone.
Example logic: if a 10 MW block loses 3 PR points for 30 days, lost energy might fall in a 80 to 150 MWh range depending on season and availability (illustrative). Multiply by PPA ₹/kWh for monthly benefit of cleaning that restores baseline.
PR methods: how to calculate performance ratio. Frequency context: how often to clean in India.
Cost side: fully loaded lines owners forget
| Cost line | Manual wet / AMC | Robot ownership |
|---|---|---|
| Direct labour or AMC fee | ₹/MW/year quote | Operator wages |
| Water and tankers | Often ₹8 to 25 lakh/year at 10 MW arid | Minimal for waterless |
| Mobilization after storms | Premium rates, idle days | Spare batteries, abort nights |
| Supervision and QA | Plant staff time | Fleet management software |
| Capex amortization | Low | Robot fleet over contract life |
| Insurance and damage risk | Vendor or self-insured | OEM and vendor SLAs |
| Generation downtime during day clean | Partial if daytime wash | Lower if night schedule |
Three delivery models compared
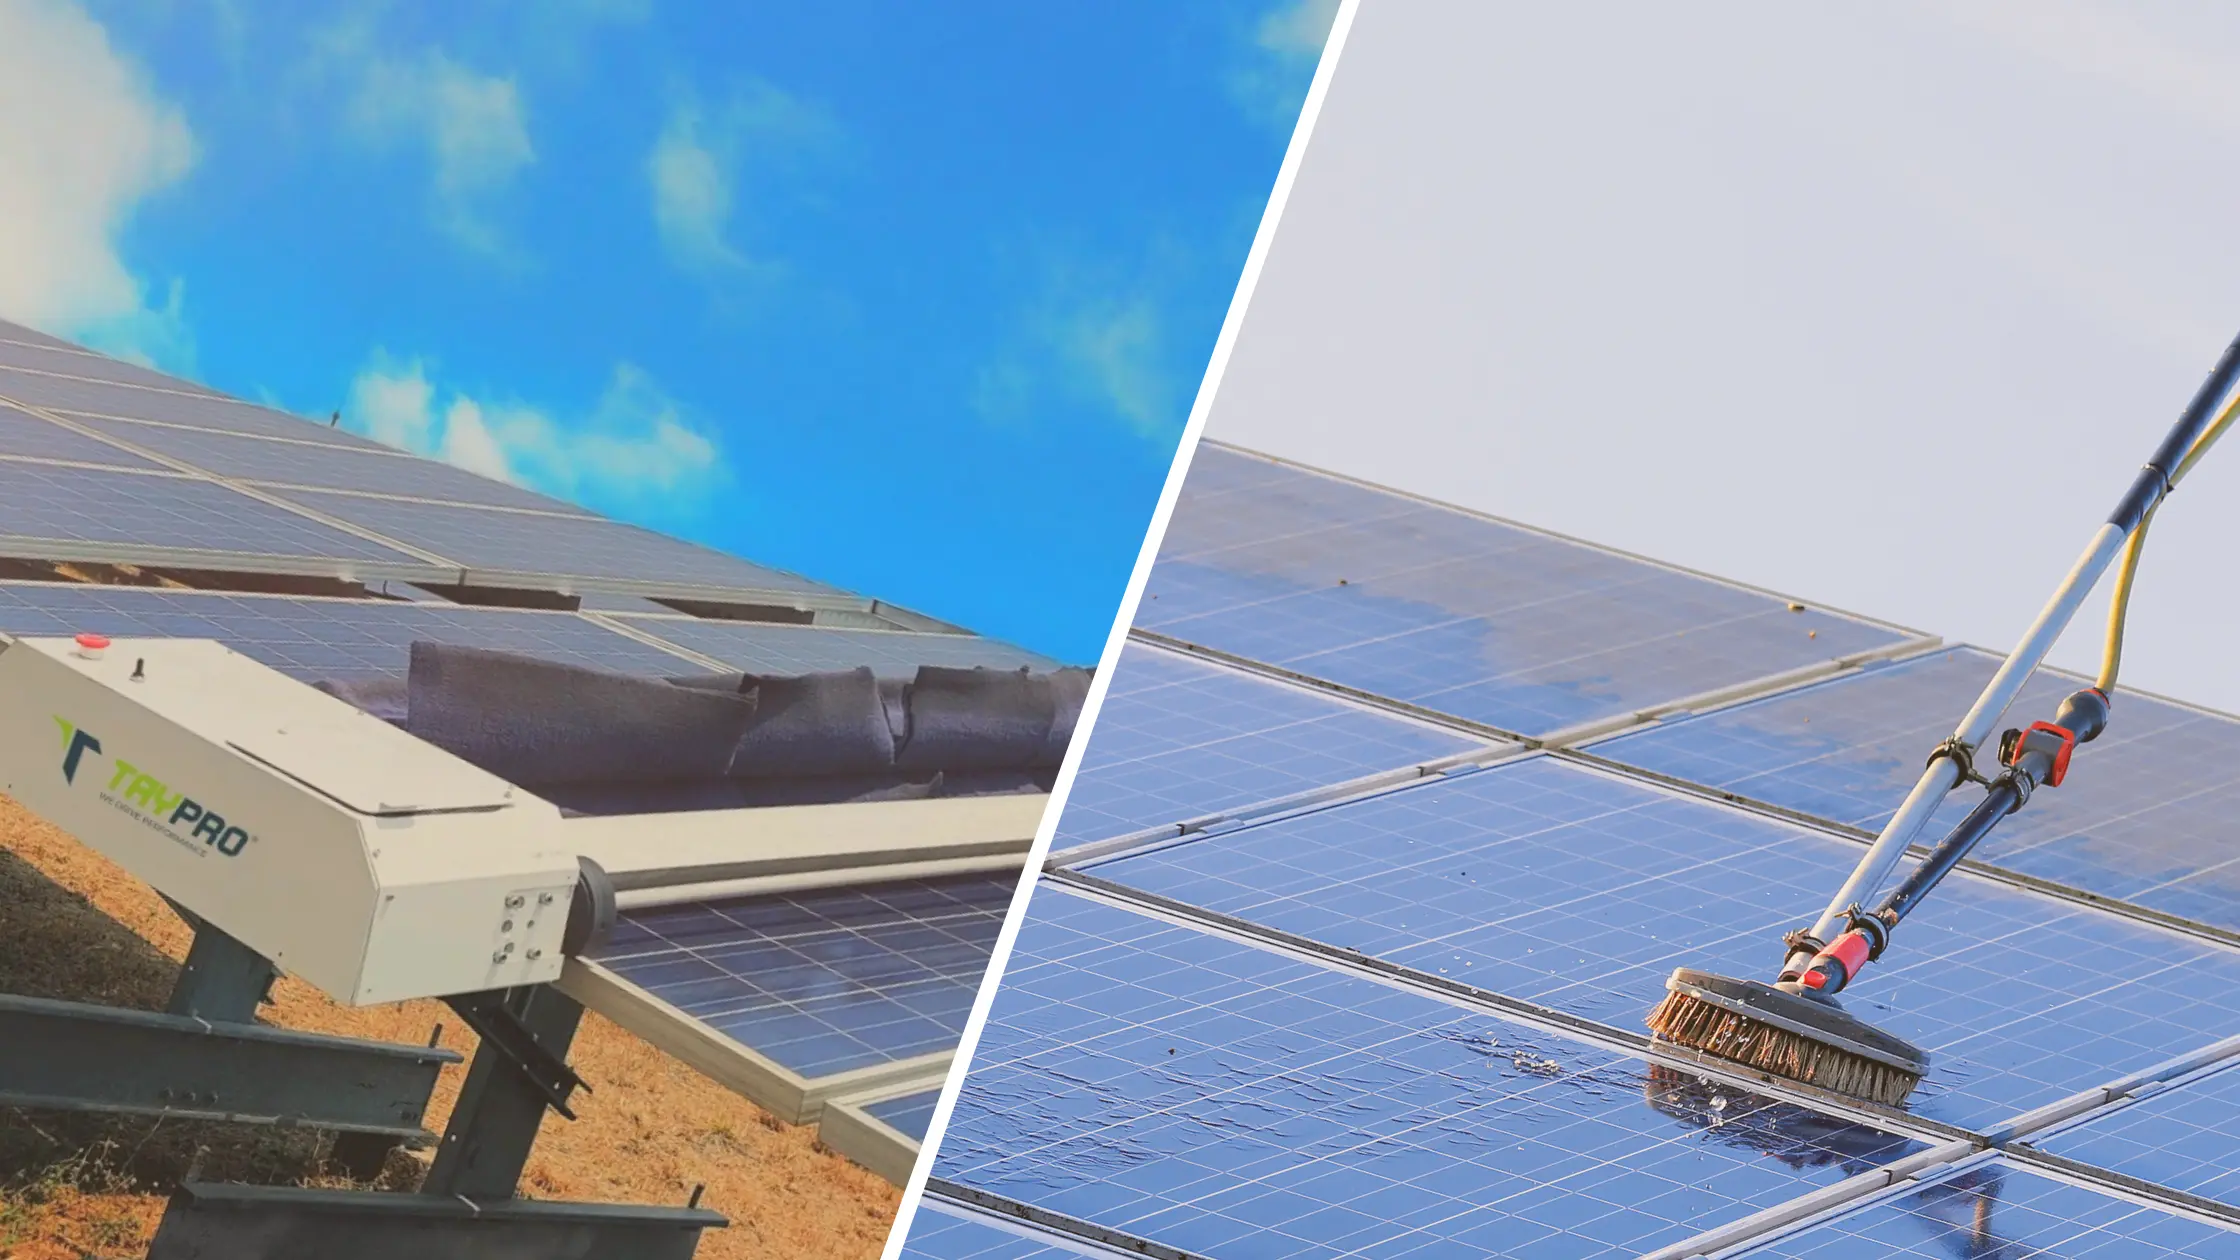
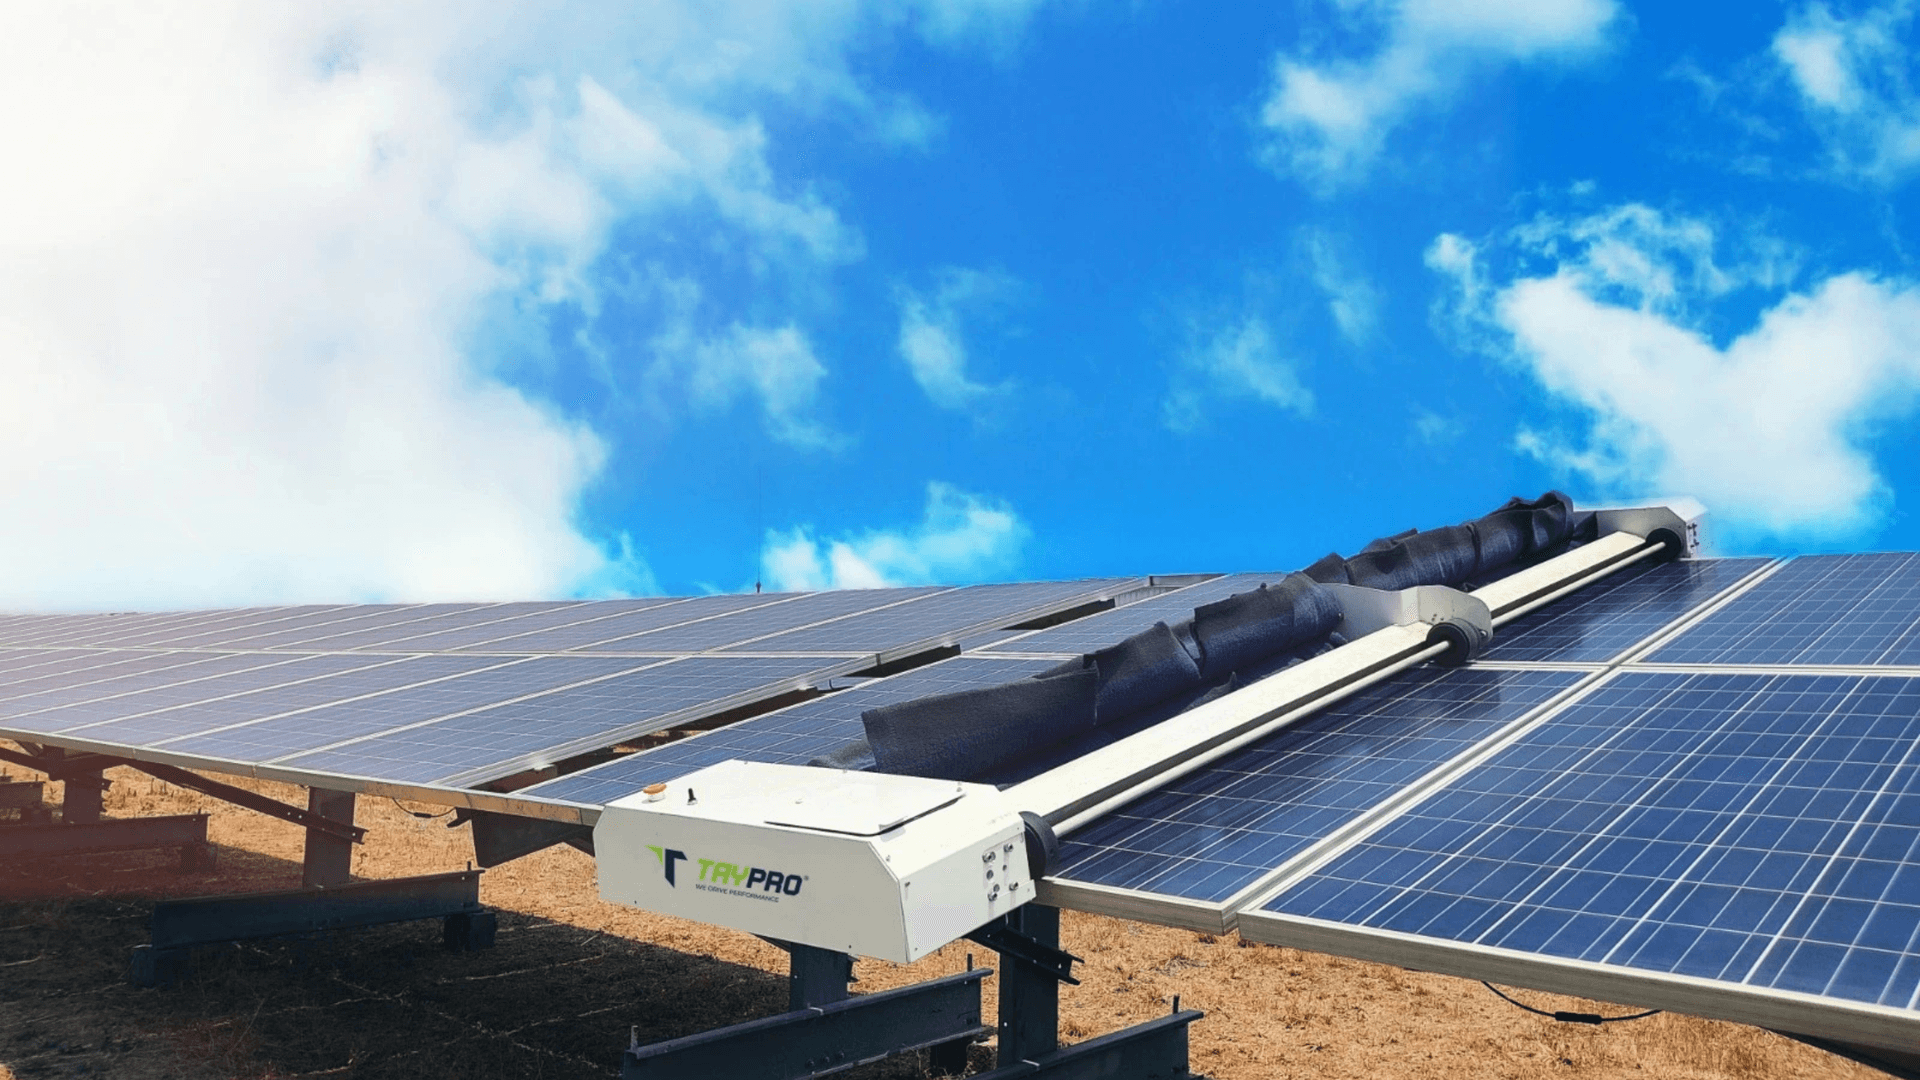
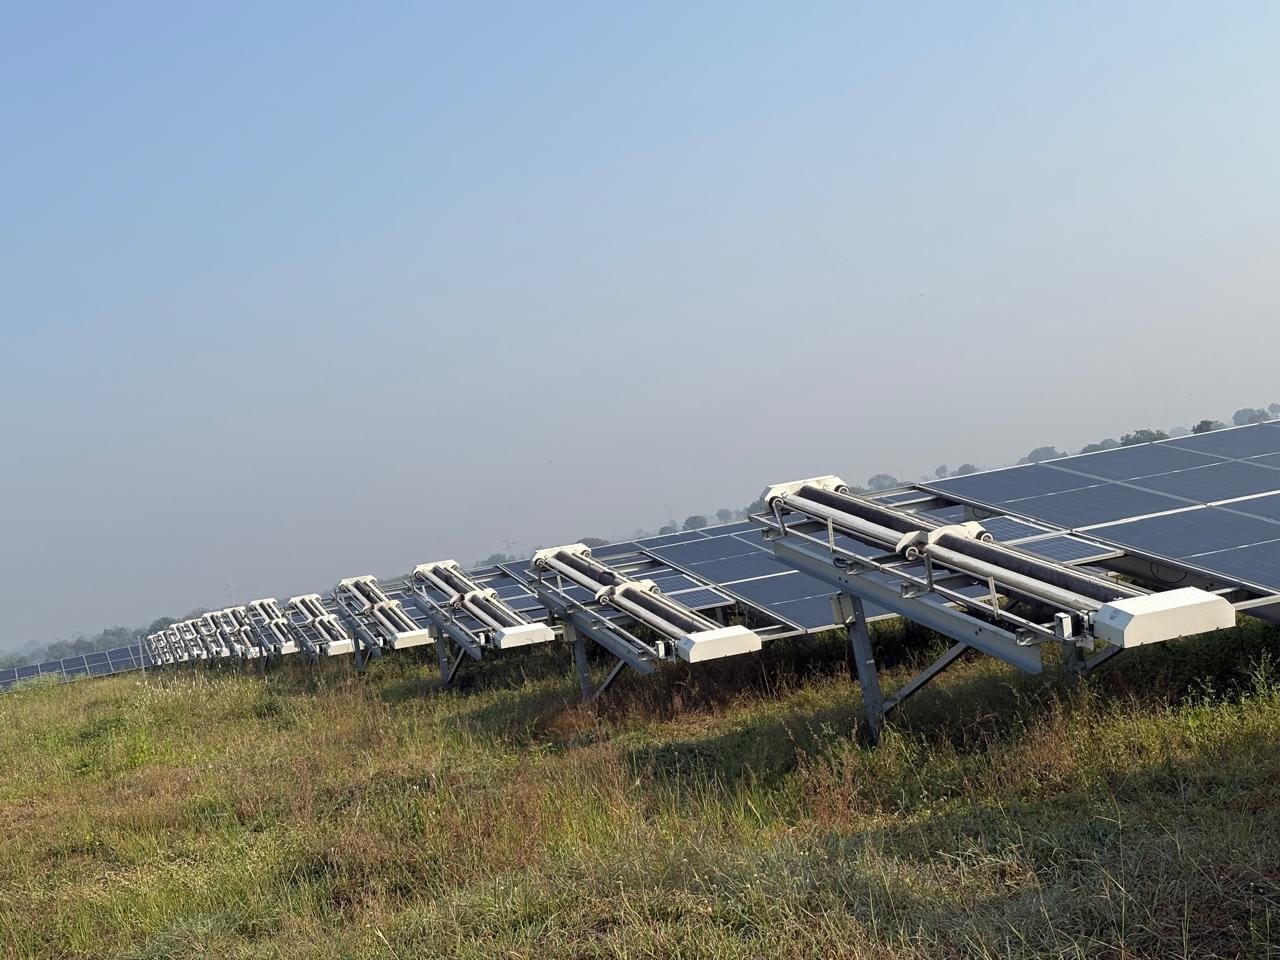
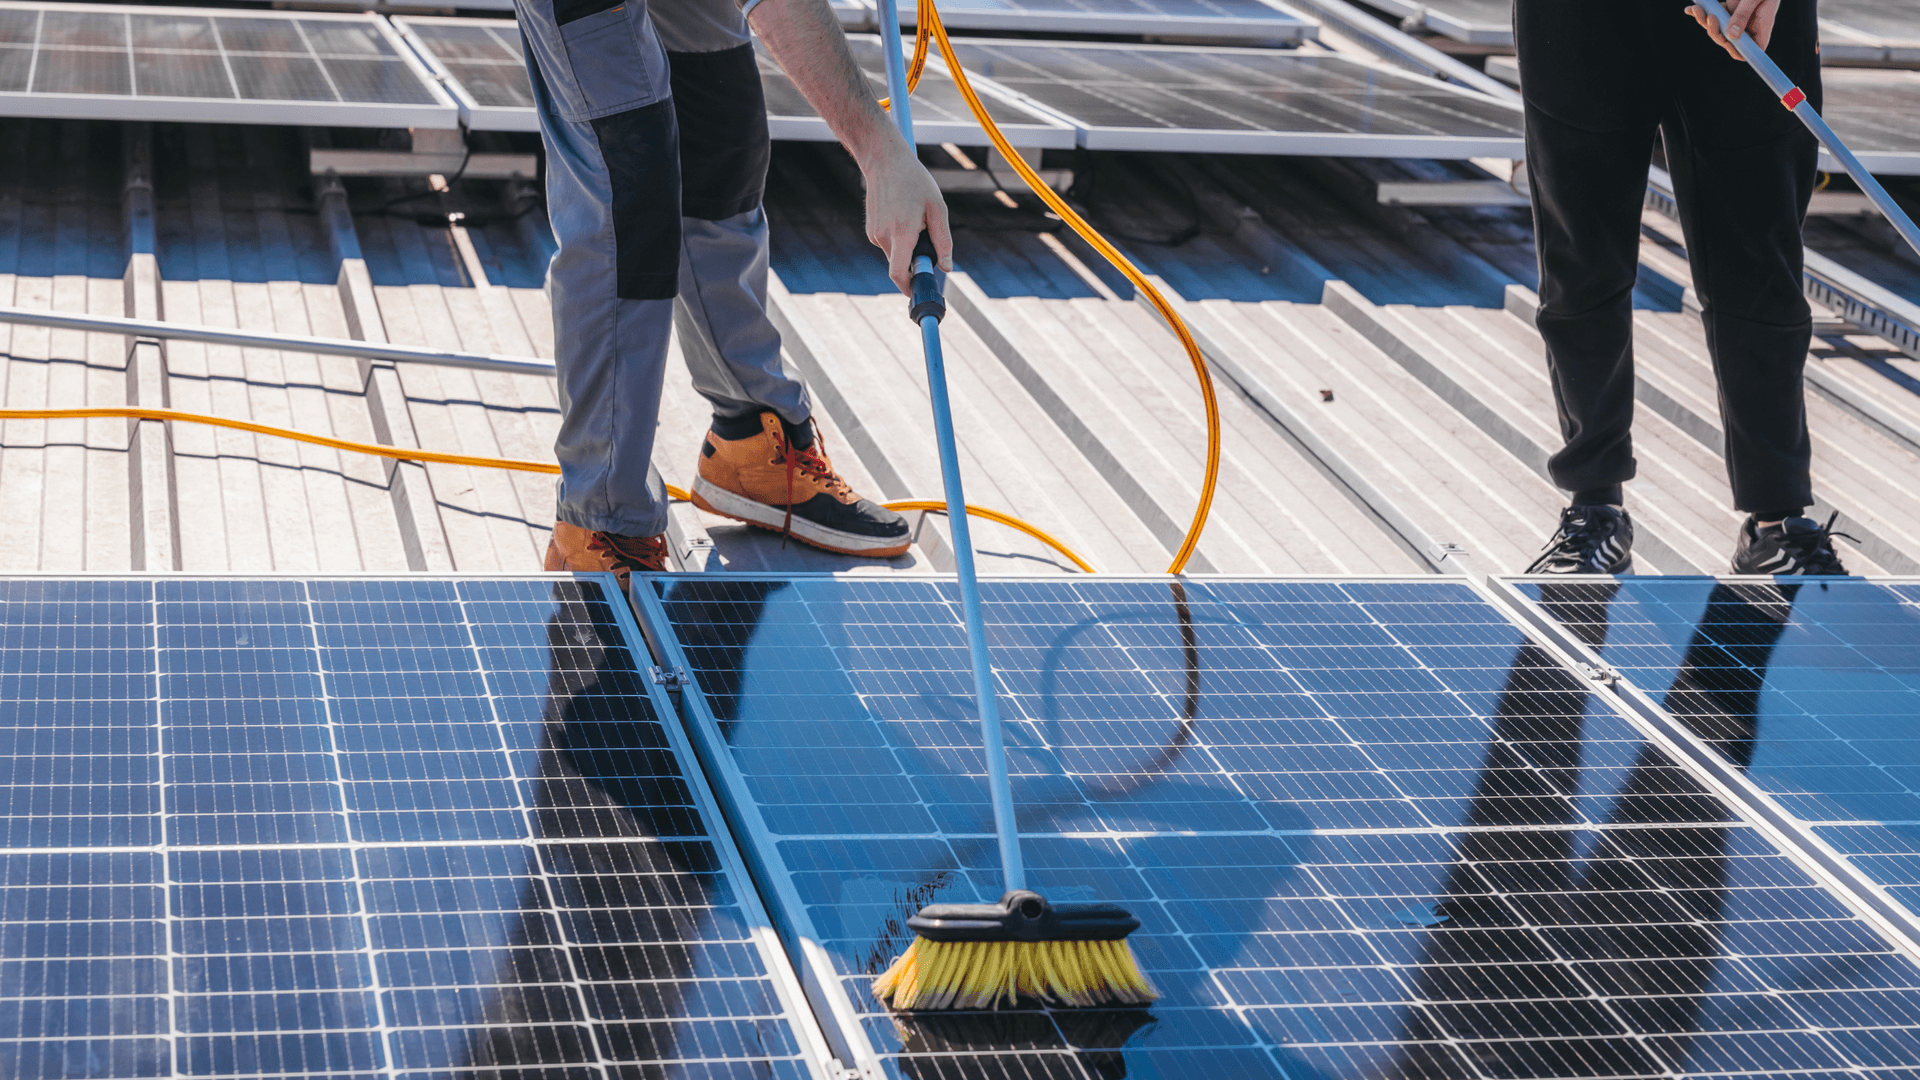
In-house manual crews offer control but scale poorly on 50 MW plus unless HR and HSE systems are mature. AMC cleaning services bundle surge capacity and equipment; normalize quotes to ₹/MWh recovered using PR logs, not ₹/MW alone. Robot ownership or robot-as-a-service shifts capex or subscription for throughput and water savings.
Service models: solar panel cleaning service overview. Robot economics: ROI calculator.
Worked 10 MW example (illustrative, five years)
Assumptions: 10 MW fixed-tilt Rajasthan, PPA ₹3.50/kWh, annual generation ~16 GWh at clean PR, dry-season soiling without adequate cleaning costs 2.5% annual MWh (~400 MWh/year), tariff value ~₹1.4 crore/year at risk if zero cleaning. Real plants partial-clean; use as upper bound stress case.
| Scenario (5-year illustrative) | Loaded cost | Energy at risk mitigated | Net benefit order |
|---|---|---|---|
| AMC manual wet, calendar monthly | ₹2.8 crore | 60 to 70% of risk | Positive if PR data supports |
| In-house manual, storm delays | ₹2.4 crore | 50 to 65% of risk | Thin margin; surge risk |
| Waterless robot fleet, 85% uptime | ₹2.2 crore | 75 to 85% of risk | Often strongest in arid dust |
Replace all cells with your measured soiling curve. Stress-test robot uptime at 70% to see downside.
Regional adjustments for India
Western arid states: high dust frequency, high water cost, robots often competitive on five-year math. Punjab/Haryana post-harvest: seasonal spikes favor AMC surge clauses. Coastal Tamil Nadu/Gujarat: salt schedules may add rinse cost to wet methods. Karnataka moderate dust: manual may remain optimal longer on smaller blocks.
Weather linkage: weather and cleaning triggers.
Building the spreadsheet finance will accept
- Monthly PR and MWh actuals vs clean baseline (minimum 12 months if available).
- Soiling loss MWh per month attributed to dust (exclude curtailment).
- Cleaning cost lines by vendor quote or internal ledger.
- Scenario toggles: storm delay days, robot uptime, water price inflation.
- NPV and simple payback; include sensitivity chart for PR recovery percentage.
Compare methods: traditional vs robotic, system selection guide.
Common CB analysis mistakes
- Counting cleaning invoices without MWh benefit side.
- Using vendor brochure soiling percent without site PR proof.
- Ignoring water and tanker inflation in arid states.
- Assuming AMC ₹/MW includes post-storm mobilization (often extra).
- Skipping downtime MWh when daytime manual wash stops generation.
When does cleaning spend fail a cost-benefit test?
If measured soiling loss over twelve months values below loaded cleaning cost even under optimistic recovery, reduce frequency or change method. Mild coastal or high-rain sites sometimes show less than 1% annual soiling loss between minimal maintenance, making aggressive wet programs hard to defend. Let PR data veto calendar habits.
Tax, GST, and contract structure effects
AMC cleaning contracts, robot leases, and capex purchases carry different GST and depreciation treatment in India. Finance should model after-tax cash flows, not just pre-tax opex comparison. Robot-as-a-service subscriptions may ease capex hurdles but require longer vendor lock-in sensitivity analysis.
Portfolio rollup: when one plant subsidizes another
IPPs with mixed dust regimes should not force identical cleaning spend per MW across portfolio. Mild Karnataka blocks may need minimal frequency while Rajasthan blocks carry robot fleets. Roll up CB analysis by site class, then aggregate for board reporting.
Break-even soiling threshold table (10 MW illustrative)
| Annual soiling loss value | Loaded clean cost | Decision |
|---|---|---|
| < ₹40 lakh | ₹50 lakh manual | Reduce frequency or change method |
| ₹80 to 120 lakh | ₹55 lakh robot | Robot often justified if uptime holds |
| > ₹150 lakh uncleaned risk | Any method under ₹100 lakh | Strong clean program required |
Values illustrative at ₹3.50/kWh. Replace with measured loss.
Sensitivity analysis finance teams expect
Present tornado chart or table varying soiling loss plus or minus 2%, robot uptime 70 to 95%, water price plus 20%, and PPA tariff minus 5%. Robust robot cases stay NPV positive across reasonable downside; fragile cases need smaller pilot scope first.
Linking CB analysis to cleaning frequency
Optimal frequency is where marginal cost of one more clean equals marginal MWh recovered. Over-cleaning past that point wastes opex; under-cleaning leaves rupees on table. PR monthly trends reveal marginal point better than annual averages.
Presenting the case to lenders and technical advisors
Advisors reject models that assume 2% soiling when block data shows 5% on uncleaned weeks. Include a one-page executive summary with the go/no-go recommendation explicit.
Key takeaways
- Finance wants MWh recovered, not visually clean modules.
- Include surge, water, and downtime in cost side.
- Normalize AMC quotes to ₹/MWh recovered using PR logs.
- Revisit analysis after first dry season with real data.
- Run robot, AMC, and in-house scenarios in parallel before lock-in.
Present cleaning business cases to finance with both sides of the ledger: avoided MWh and fully loaded O&M cost. Single-sided spreadsheets rarely survive IC review.
Related resources
Compare waterless robots, automatic and semi-automatic models, and managed OPEX on Taypro's solar panel cleaning system for utility plants.
Frequently asked questions
Estimate soiling loss MWh if cleaning frequency is reduced, multiply avoided loss by PPA tariff, subtract fully loaded cleaning cost including labour, water, mobilization, robot O&M, capex amortization, and downtime over the planning horizon. ROI is positive when recovered revenue exceeds loaded cost with acceptable risk margin.
Use site reference data from soiling stations or PR baselines. If none exists yet, industry-typical ranges of 3 to 8% dry-season energy loss between cleans in dusty western India are starting points only. Replace with measured data after first season.
When specialized AMC vendors bring surge capacity, equipment, insurance, and trained crews cheaper than hiring seasonal armies internally. Compare ₹/MW AMC quotes to fully loaded in-house wages, supervision, water, and mobilization after storms.
On frequent-clean regimes and water-scarce sites where service vendors hit the same throughput and water limits as in-house manual teams. Run five-year TCO models for AMC, in-house manual, and robot ownership side by side with uptime sensitivity.
Many asset owners model five years to match O&M contract cycles and lender reviews, at discount rates aligned with portfolio WACC or sponsor hurdle (often 10 to 14% nominal in illustrative models). Extend to ten years for robot capex decisions when debt tenor allows.