Indian utility owners rarely buy cleaning robots because the technology is new. They buy them because dust outran crews, water caps bit, and performance ratio started bleeding weeks before the next tanker arrived. Automated cleaning is a throughput decision dressed as a capex line item. These five signs show up on MW balance sheets long before operations teams schedule a vendor demo.
If you operate 10–100 MW in Rajasthan, Gujarat, or central India dust belts, treat this list as an early-warning system. Each signal ties to a metric you can pull from SCADA, O&M tickets, or reference modules today.
Quick answer
- Sign 1: PR sawtooth: sharp recovery post-clean, slow bleed until next crew.
- Sign 2: Water tanker queues cap wash frequency below economic need.
- Sign 3: 50 MW+ scale makes manual mobilization too slow after dust events.
- Sign 4: Tracker rows need night cleaning windows crews cannot hit.
- Sign 5: Dust events need 48-hour response SLAs that manual programs miss.
Sign 1: The PR sawtooth never flattens
Healthy cleaning programs show PR recovering toward a clean baseline after each campaign, then drifting slowly until the next pass. Unhealthy programs show a sawtooth: a spike after clean day, then a steep slide within 7–10 days in dry season. By day 14, PR may sit 3–5% below the post-clean peak while crews wait for mobilization approval.
On a 50 MW plant generating roughly 90 GWh annually at typical Indian yields, a sustained 4% PR gap versus clean baseline is about 3.6 GWh lost. At ₹3.50/kWh PPA, that is ₹1.26 crore in foregone revenue before you add labour or water. Automation earns its keep when it compresses the sawtooth by increasing pass frequency without proportional cost spikes.
Measure with monthly performance ratio discipline and reference modules. If your clean-day baseline is stale, the sawtooth looks smaller than reality.
Sign 2: Water is the bottleneck, not dust
Many arid sites were designed assuming borewell or canal water would always be available. Five years later, tanker queues, district caps, or ESG scrutiny limit wet wash frequency. When litres per MW per clean exceed permit comfort, operators stretch intervals from weekly intent to biweekly reality. Dust does not wait.
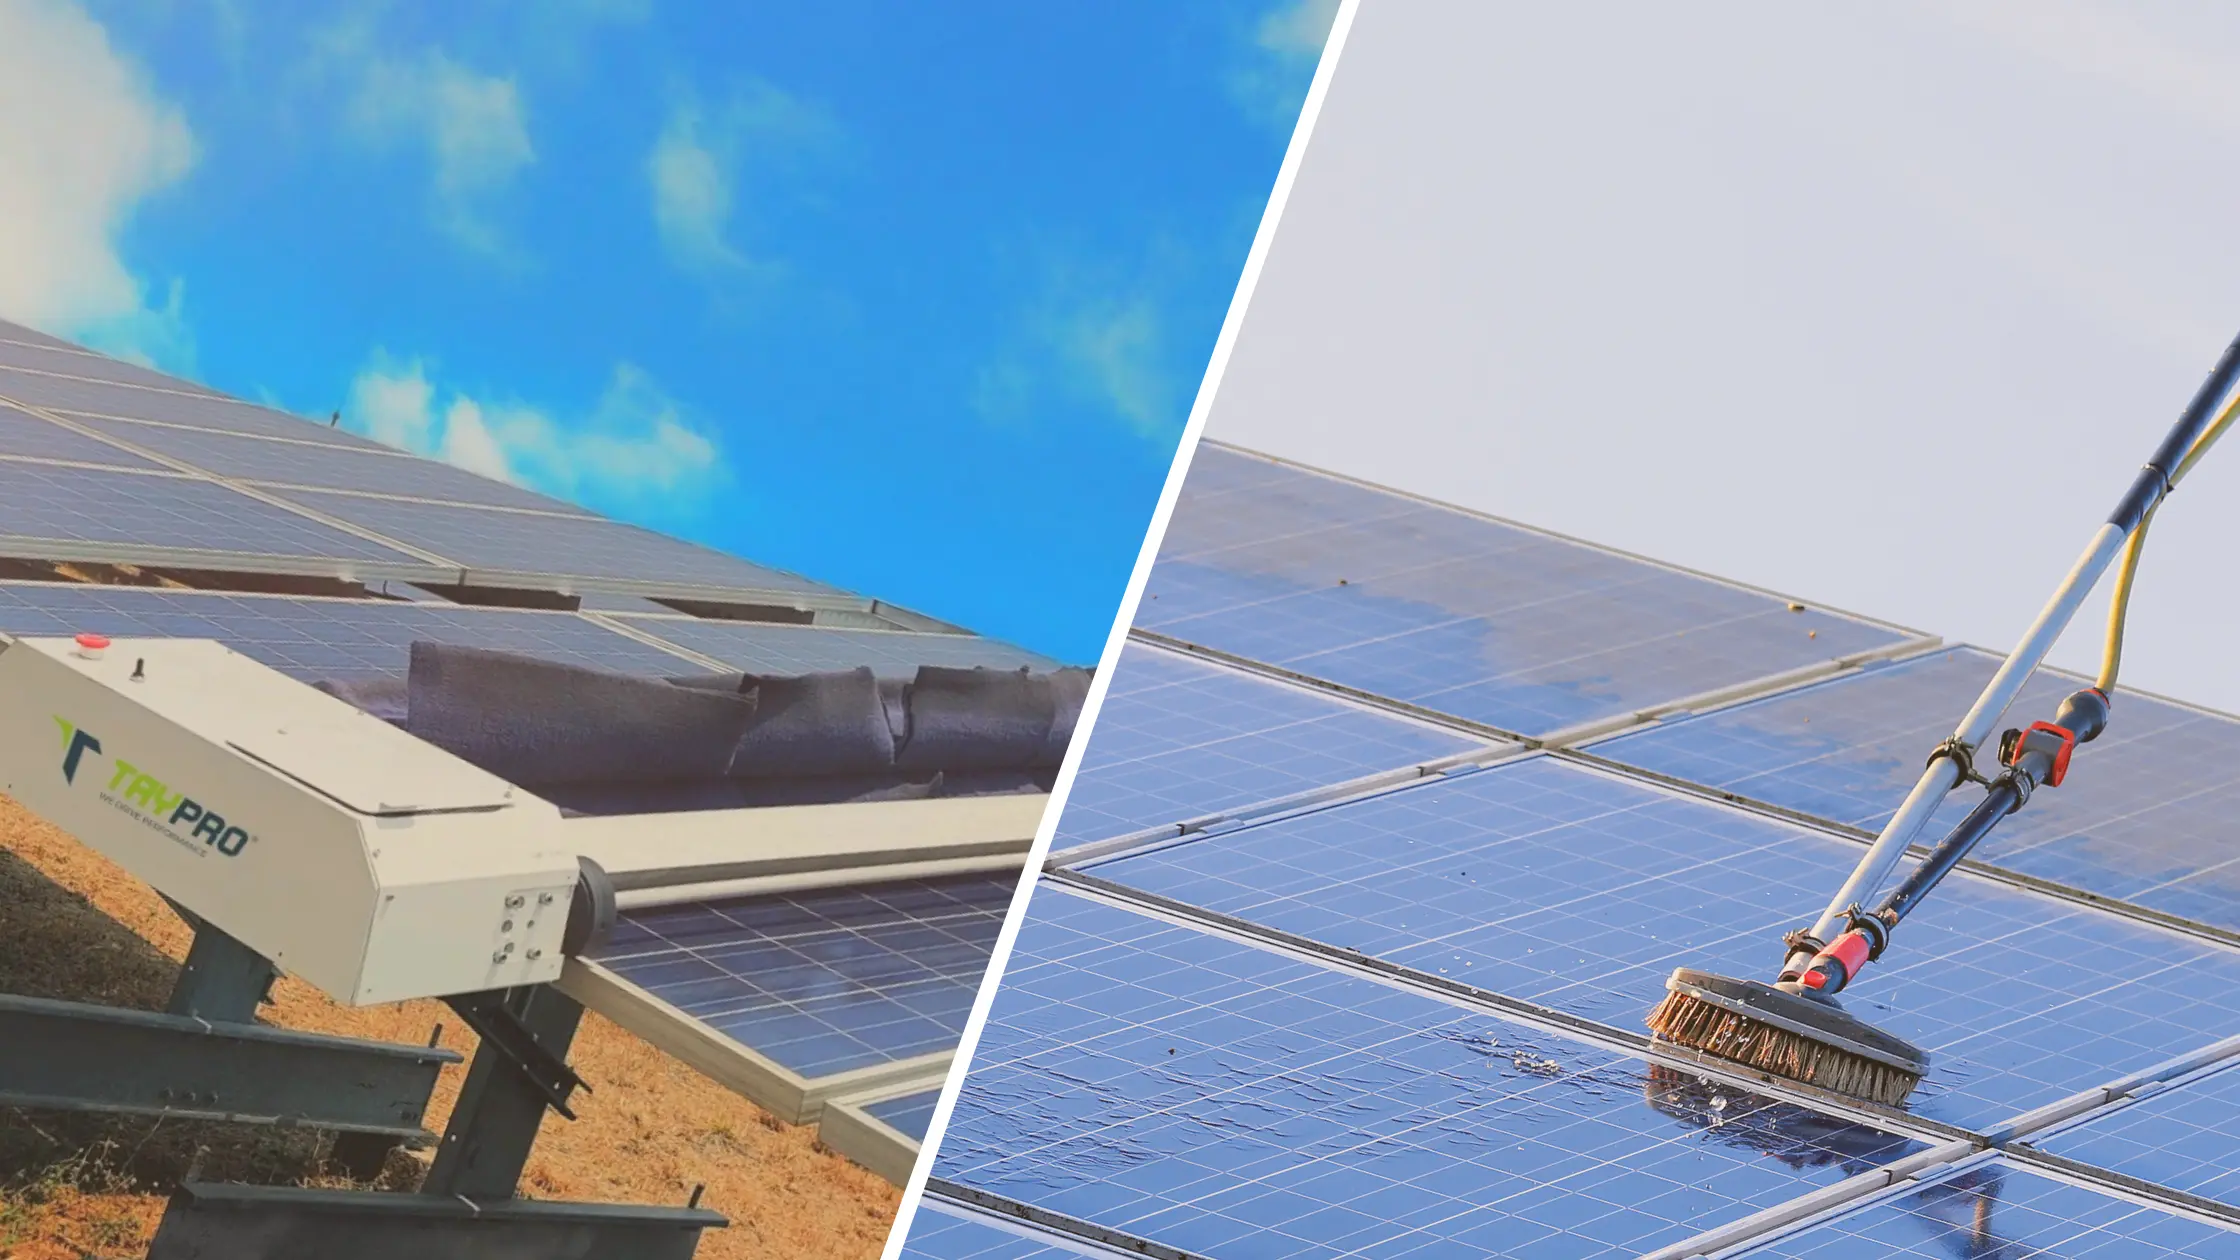
Waterless robotic fleets remove the tanker variable from marginal pass economics. Compare waterless vs water-based cleaning on your tariffs. A site spending ₹18–25 lakh annually on water and tankers for a 10 MW block may find robot O&M shifts the constraint from litres to fleet uptime.
Sign 3: Scale broke the crew calendar
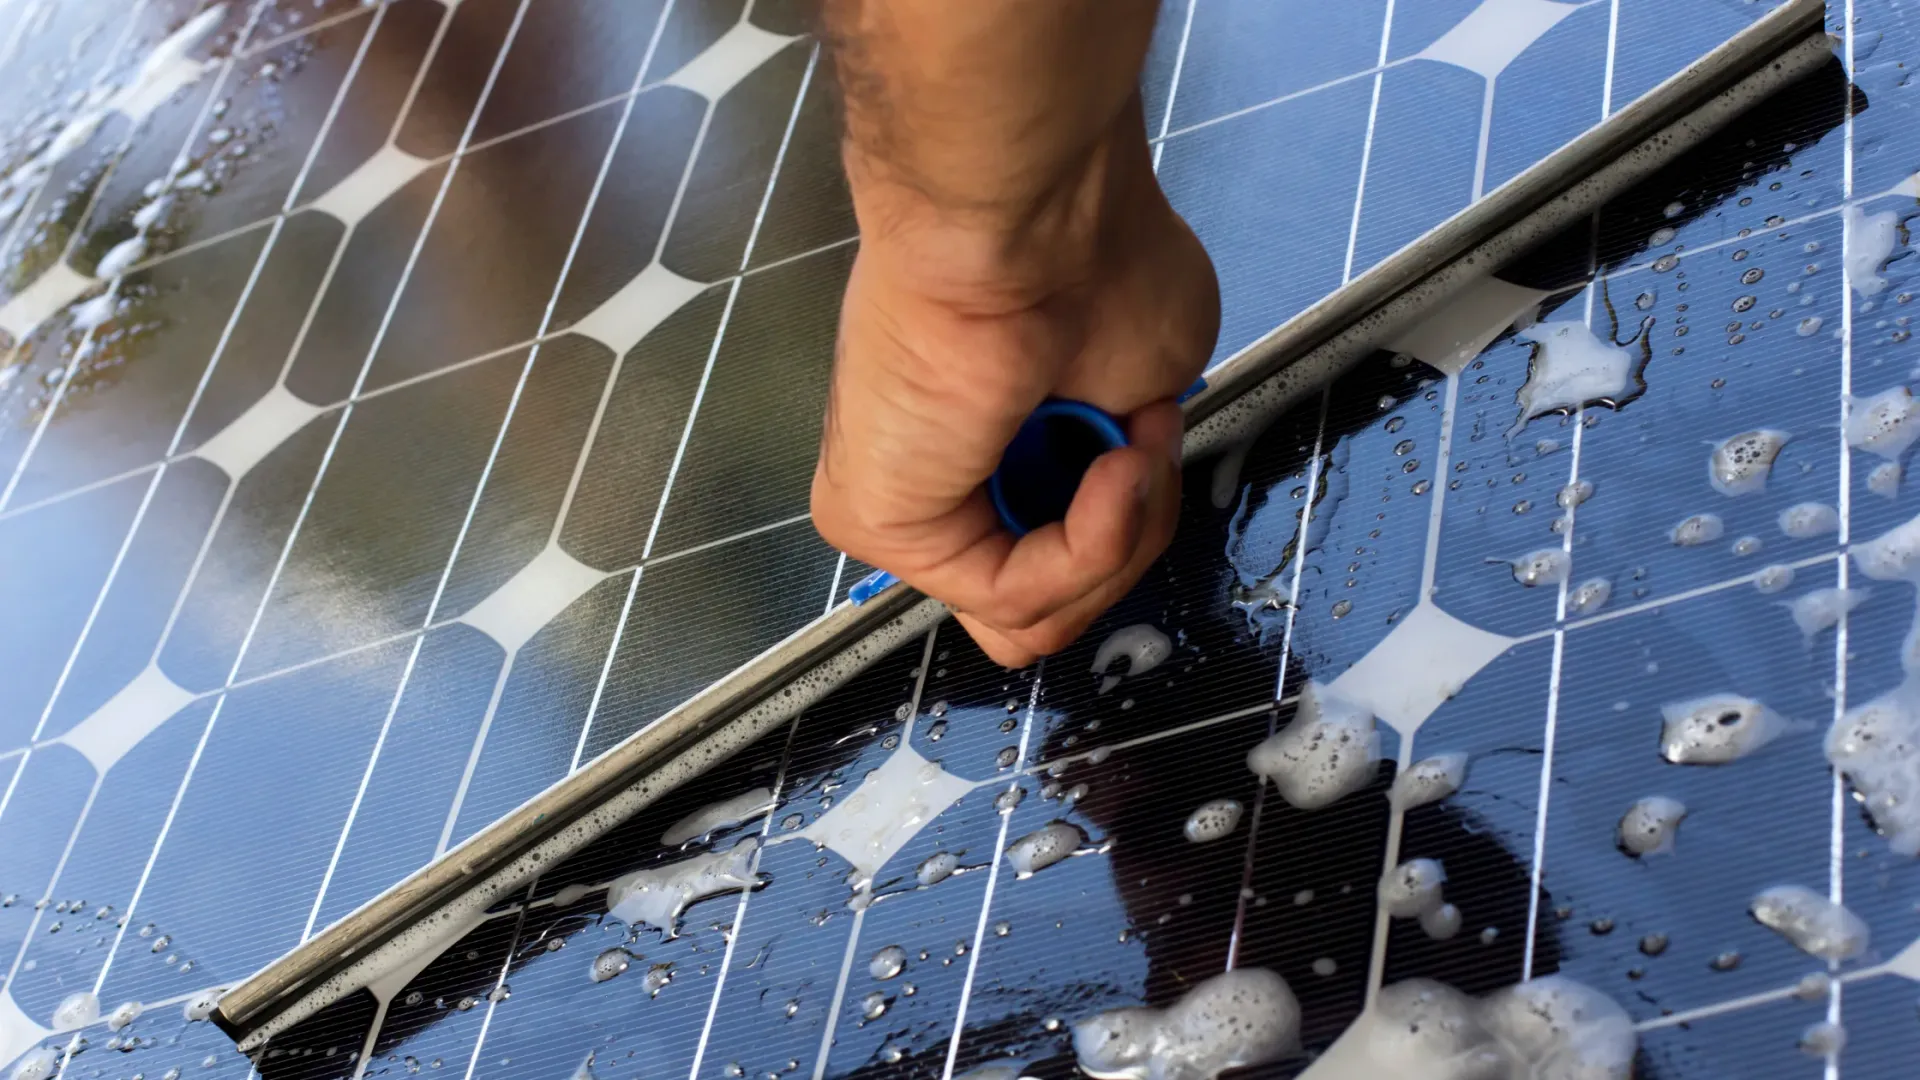
Manual programs that worked at 15 MW often fail at 75 MW. Full-plant passes stretch from five days to twelve. Blocks cleaned on day one soil again before day twelve finishes. The plant averages a dirty state. Asset managers see it as "normal seasonal PR" until someone maps days-to-full-coverage against dust accumulation curves.
| Plant scale (illustrative) | Manual full-pass time | Risk if dust event hits mid-cycle |
|---|---|---|
| 10 MW fixed-tilt | 3–5 days | Moderate; often manageable with surge crews |
| 50 MW mixed blocks | 8–14 days | High; untouched zones lose MWh for weeks |
| 100 MW tracker-heavy | 10–18 days manual | Severe; robots or split fleets often evaluated |
Read manual brush limits at 50 MW before assuming more labour alone fixes scale.
Sign 4: Trackers need night windows crews miss
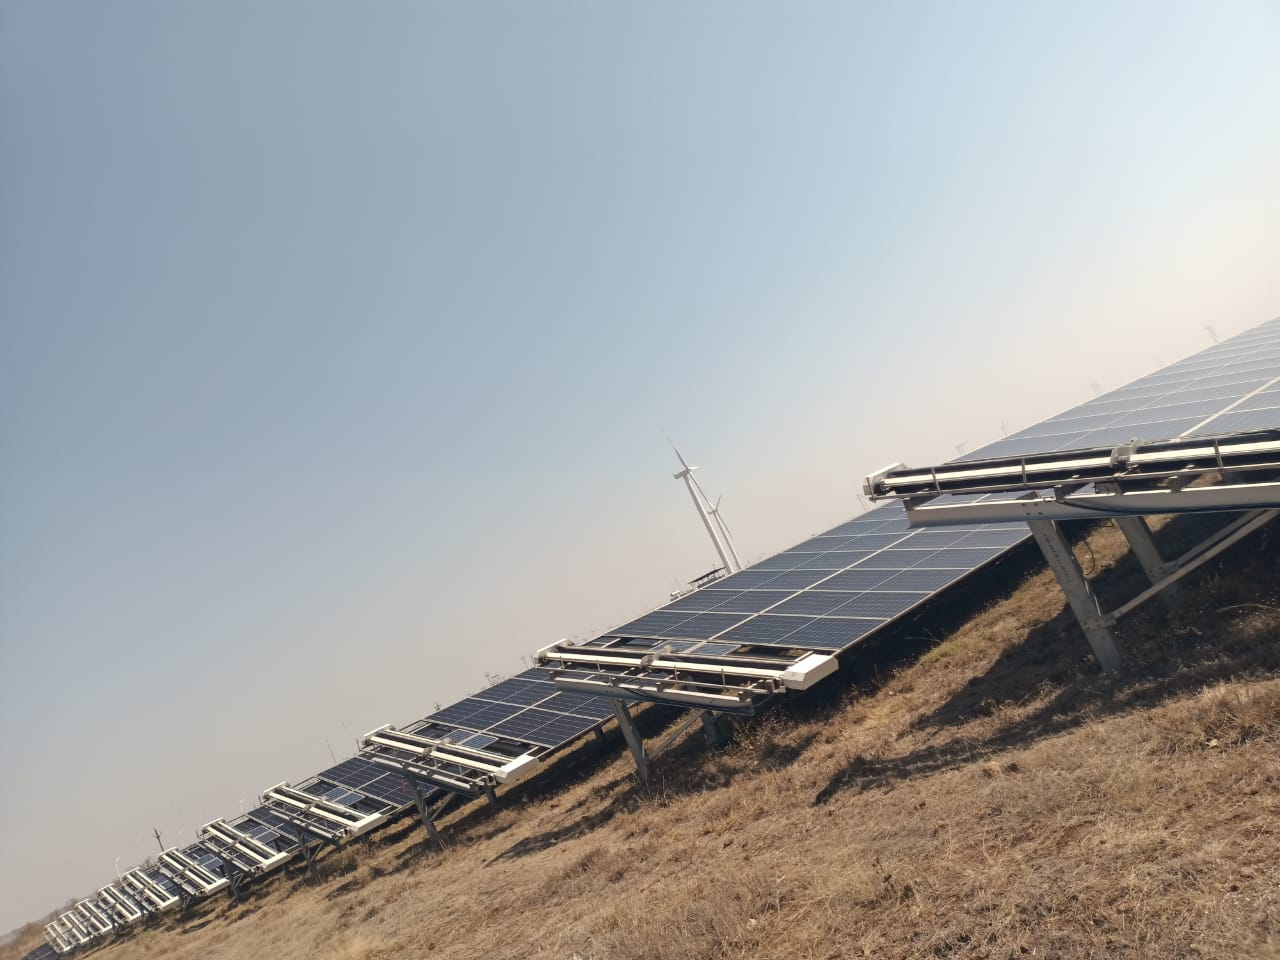
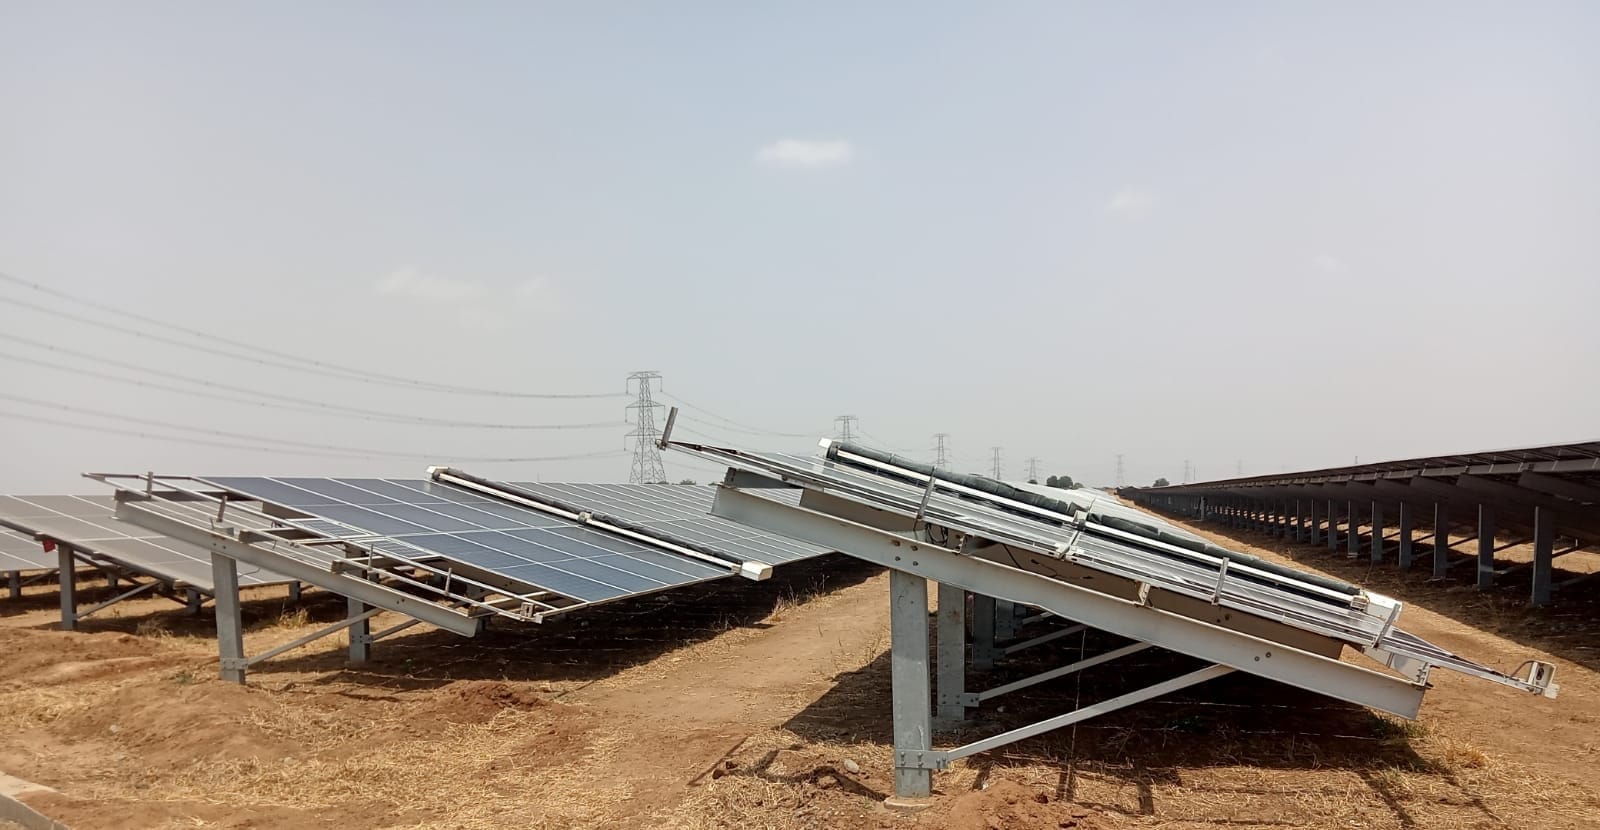
Single-axis trackers complicate daytime cleaning: row length, cable trays, stow angles, and production loss during passes. Night cleaning when modules are stowed is often the only window that avoids generation hit and heat stress on glass. Manual crews at night raise safety and supervision costs. Robots designed for tracker paths can run scheduled night fleets if wind interlocks and OEM approvals are in place.
Hybrid sites sometimes keep manual on fixed-tilt blocks and robots on tracker zones. See robotic cleaning on trackers vs fixed tilt before standardizing one method plant-wide.
Sign 5: Dust storms need SLAs, not intentions
May pre-monsoon weeks in western India can drop PR 5–8% in 48 hours after major dust events. Lenders and offtakers increasingly ask how fast O&M restores output. Manual programs tied to fortnightly contracts cannot answer. Automated fleets with dispatch software and pass logs can target worst blocks first within 24–48 hours if uptime and comms hold.
Correlate storm dates with PR dips in SCADA. If response time consistently exceeds three days, you are leaving tariff rupees on the table. Rajasthan and Gujarat soiling ranges show why storm response is not optional in those clusters.
Signal checklist for plant managers
| Signal | What to measure | Threshold to escalate |
|---|---|---|
| PR sawtooth | 30-day PR vs post-clean baseline | >2.5% average gap between cleans |
| Water constraint | Litres per MW per clean vs permit | Intervals stretched solely due to water |
| Scale | Days to full-plant manual pass | >10 days in dry season |
| Trackers | Hours per row manual vs robot pilot | Manual >2× robot on same row |
| Storm SLA | Hours from event to partial recovery | >72 hours routine |
What to do before buying robots
- Run ROI analysis with site soiling and your PPA tariff.
- Read system selection guide and traditional vs robotic comparison.
- Pilot on worst blocks with pass logs and PR before/after.
- Demand OEM module cleaning approval in writing.
- Do not wait for annual budget cycles if dust season is eight weeks away.
Building the board case for automation
Asset managers pitching robots to investment committees should frame automation as revenue protection, not technology adoption. A credible board pack includes five years of fully loaded comparison: labour, water, mobilization after storms, robot capex amortized, and recovered MWh at contract tariff. Exclude comparisons that pit robot list price against a single manual invoice.
Illustrative 50 MW Rajasthan case structure:
- Baseline: manual wet every 14 days intent, actual 18–21 days in peak dust.
- Average dry-season PR gap: 3.8% versus clean reference modules.
- Lost MWh valued at ₹3.20/kWh PPA: roughly ₹1.1 crore annually.
- Robot fleet O&M plus amortized capex: ₹1.4–1.8 crore annually illustrative.
- Net position depends on uptime and recovered gap; pilot proves which side wins.
Include sensitivity on storm weeks: if three May events each cost 2% PR for ten days uncleaned, manual programs without surge capacity fail hurdle quickly. Robotic cleaning for maximum ROI walks through margin framing for thin PPAs.
Lenders increasingly ask whether cleaning coverage is auditable. Pass logs from automated fleets answer that question; handwritten crew timesheets often do not. Governance matters when refinancing operating assets in 2027–2030 vintages.
When automation is not the first answer
Not every plant needs robots immediately. Fixed-tilt 10 MW sites with mild soiling, reliable water, and crews that complete full passes in under five days may stay manual for years. Automation escalates when signs compound: sawtooth PR plus water caps plus scale delays plus tracker geometry. A single sign warrants monitoring; three signs warrant a pilot budget this quarter.
Hybrid approaches are valid: robots on tracker blocks, manual on fixed-tilt until economics shift. Cost-benefit analysis of cleaning services in India helps structure split methods without forcing one vendor narrative plant-wide.
Key takeaways
- Automate when throughput and economics demand it, not when brochures look polished.
- PR sawtooth, water caps, and scale delays are financial signals, not O&M anecdotes.
- Prove with block-level PR and pass coverage, not vendor demos alone.
- Trackers and storm SLAs often tip marginal manual programs toward fleets.
- Revisit the five signs after each dry season with real SCADA data.
If three or more signs appear on the same block, schedule a robot or surge-capacity pilot before the next dust season rather than waiting for annual PR variance.
Related resources
Frequently asked questions
When crew throughput cannot keep pace with soiling between scheduled rounds, PR stays depressed for weeks, and lost MWh exceeds the cost of automation. On a 50 MW plant at ₹3.50/kWh, even 3% sustained soiling can cost ₹1.5 crore or more annually in foregone revenue.
A repeating sawtooth: sharp recovery right after manual clean, then 3–6% PR loss before the next crew mobilization, especially in Q2 dust season. If monthly PR charts look like a staircase down between cleans, the calendar broke before operations admitted it.
Often yes. Waterless methods maintain higher cleaning frequency without tanker queues or borewell caps. In Rajasthan, sites that ration wet washes to twice monthly frequently see PR gaps that waterless night passes can close at lower marginal cost per row.
Yes. Manual brush crews slow on long single-axis rows, cable trays, and stow states. Robots designed for tracker clearance can pass at night when modules are stowed, but only if wind rules and OEM approvals are documented before fleet procurement.
Select two high-soiling blocks, run manual on one and robots on the other with logged pass coverage, compare irradiance-normalized PR for 14 days pre- and 7 days post-clean, then extrapolate annual ₹ and MWh. Use the ROI calculator with site soiling, not brochure defaults.