Quick answer: Summary for plant managers
For utility-scale assets in India, effective subsidy schemes 2026 cleaning cost planning relies on balancing upfront capital allocation against the high opex of manual wet maintenance. IPPs should shift towards data-driven cleaning cycles to maintain performance ratios in high-dust regions like Rajasthan and Gujarat.
- Soiling loss mitigation: Target 15–30% energy yield recovery in arid zones through consistent cleaning.
- Cleaning frequency: Implement 2–7 day intervals for high-dust sites to prevent permanent degradation and hard-soiling buildup.
- Water efficiency: Achieve up to 90% water consumption reduction by transitioning from manual wet cleaning to dry robotic systems.
- Budgeting shift: Move from high-variable manual labour contracts to fixed-cost automation that hedges against future labour wage inflation.
By optimizing your O&M budget to prioritize automated cleaning, you align your plant's performance with the efficiency mandates expected under updated 2026 MNRE guidelines. This transition is essential for preserving the long-term energy yield of bifacial modules, where rear-side soiling can severely impact overall PR if left unmanaged.
Navigating the 2026 solar subsidy schemes for large-scale O&M
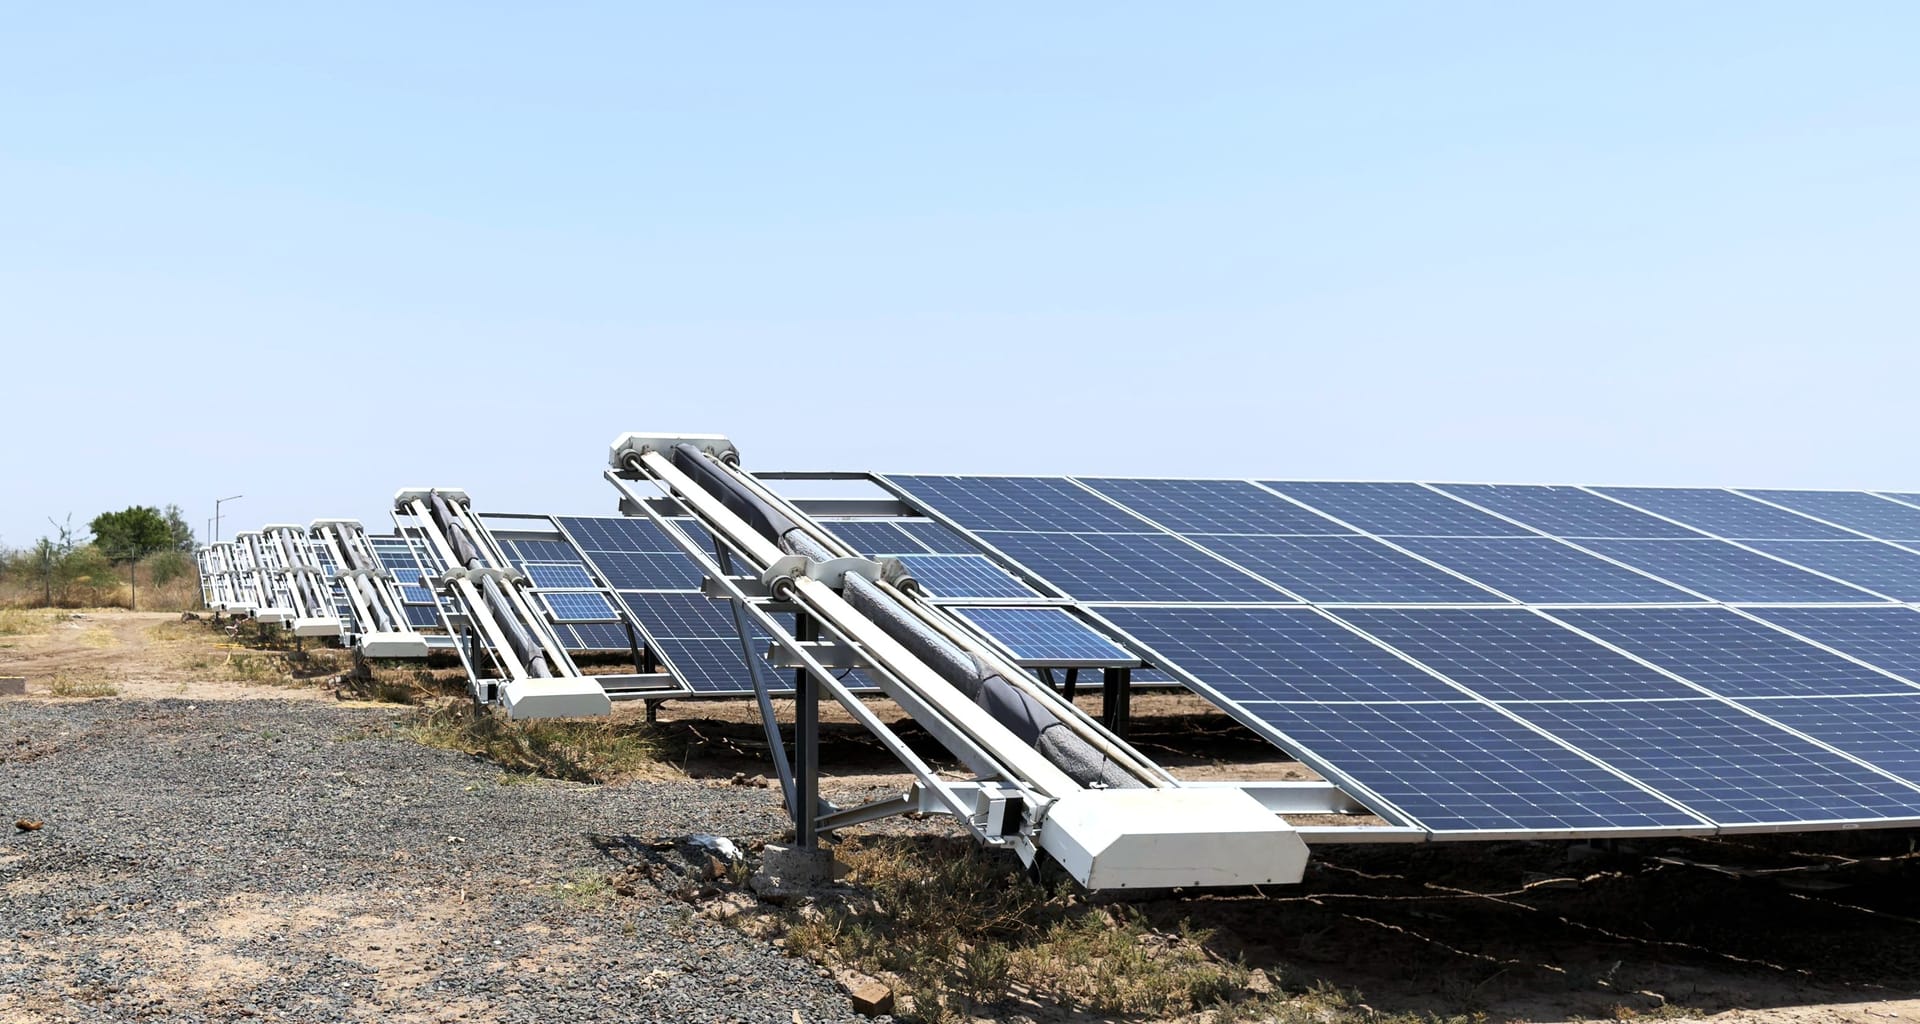
As of 2026, the MNRE policy landscape has shifted focus from pure capacity addition to the long-term viability of solar assets. While initial capital subsidies have historically supported module procurement, the current regulatory environment under the Production Linked Incentive (PLI) scheme prioritizes high-efficiency domestic manufacturing, indirectly pressuring IPPs to maintain higher Performance Ratio (PR) levels to remain compliant with performance-linked guarantees.
For asset managers, subsidy schemes 2026 cleaning cost planning must account for stricter mandates regarding grid stability and yield guarantees. Plants failing to meet minimum generation benchmarks due to excessive soiling may find themselves excluded from certain performance-linked incentives or subject to higher penalty clauses in their Power Purchase Agreements (PPAs). Consequently, the integration of autonomous cleaning systems is increasingly treated as a qualifying expense for operational modernization under updated national maintenance guidelines.
IPPs should consider the following regulatory implications for their O&M budgets:
- Compliance-Linked Efficiency: Future-proof your 2026 O&M strategy by documenting automated cleaning schedules; consistent data logs are increasingly required for ESG reporting and grid-compliance audits.
- PLI-Influenced CAPEX: Capital allocated to high-efficiency modules must be protected by appropriate cleaning technology; investing in dry, waterless robotics preserves the delicate anti-reflective coatings that are standard on today's high-efficiency PV panels.
- Water Scarcity Mandates: Regional authorities in states like Rajasthan and Gujarat are tightening restrictions on industrial water usage, making the transition to waterless cleaning not just an efficiency choice but a regulatory necessity to avoid operational fines and permit delays.
By shifting from manual, high-labor contracts to automated, technology-driven O&M, plant owners can hedge against rising wage inflation in the rural labor market while ensuring that their assets remain in the top tier of generation efficiency for the duration of their PPA cycles. For more detail on structuring these long-term Opex contracts, refer to our guide on cleaning opex pricing models for utility assets.
Budgeting for cleaning: Key Capex and Opex drivers in 2026
For IPPs in India, the shift from manual cleaning to automated solutions has transformed budgeting from a variable-cost headache into a predictable long-term opex model. By 2026, the primary cost drivers for utility-scale cleaning have moved beyond simple labor rates to include equipment reliability, water access, and energy recovery efficiency. When analyzing 10 MW to 100 MW portfolios, plant managers must differentiate between upfront capital layout and the lifecycle opex required to maintain the Performance Ratio (PR) within PPA-mandated levels.
Typical industry-standard budget drivers for 2026 involve three core elements:
- Labor and Compliance Costs: Manual cleaning contracts often expose operators to inflation in rural wages and high turnover. Transitioning to automated cleaning systems reduces long-term dependency on labor, hedging against wage volatility while improving safety and reducing human-induced damage to modules.
- Water Procurement and Treatment: In water-stressed corridors like Rajasthan and Gujarat, the cost of water is no longer just the commodity price. It includes transportation, storage, and the ongoing expense of filtration to prevent mineral scaling on panels. Shifting to dry, waterless robotics can achieve up to 90% water savings, directly impacting the operational opex line item.
- Maintenance and Spare Parts: Robotic fleets require a well-mapped maintenance schedule. Unlike manual tools, which have negligible service overhead, automated robots require managed support to ensure the fleet remains at or above 99% uptime. This includes integrating smart fleet management tools like NECTYR fleet portal for automated scheduling and diagnostics to prevent downtime before it occurs.
For a detailed breakdown of how to compare these financial structures, refer to our cleaning opex pricing models for utility assets. Managers should note that while robotic cleaning represents a higher initial capital hurdle compared to manual kits, the 5-year TCO (Total Cost of Ownership) often favors automated solutions due to the higher PR and preserved module coating integrity compared to aggressive manual wet brushing.
Step-by-step: Implementing a cleaning schedule for MW-scale plants
For a 50 MW or 100 MW site in India, a static calendar-based approach is often obsolete by the second year of operation. Plant managers must transition to a frequency-based schedule that relies on site-specific soiling rates, which in high-dust corridors like Rajasthan can reach a Performance Ratio (PR) loss of 0.5% to 1.0% per day. The following implementation framework aligns cleaning frequency with technical constraints to maximize yield:
- Baseline Assessment: Before scheduling, conduct a monthly soiling loss analysis using reference cells and historical data. Determine the break-even soiling threshold, usually 2% to 3% PR loss, at which the cost of cleaning is offset by the revenue recovered.
- Tiered Cleaning Frequencies: Divide your plant into blocks based on soiling exposure. High-traffic or desert-adjacent blocks should receive high-frequency (bi-weekly) cleaning, while low-soiling zones can be managed on a monthly or bi-monthly cycle.
- Integrating Automated Monitoring: Use a platform like NECTYR fleet portal to track cleaning logs and correlate robot performance with PR recovery. This allows operators to trigger cleaning based on real-time plant intelligence rather than arbitrary dates.
- Operational Feedback Loops: Review post-cleaning yield data every quarter. If a block is not meeting recovery expectations, inspect for localized issues like shading, bird droppings, or robot maintenance gaps, as documented in our guide to separating module degradation from soiling losses.
- Scaling Across MW Portfolios: For multi-site portfolios, standardize your SOPs for robot deployment, recharging, and maintenance to ensure that cleaning schedules are not interrupted by logistics delays or spare parts shortages.
By shifting to this dynamic model, IPPs can ensure that their cleaning costs scale proportionally with actual generation losses, rather than inflating fixed Opex through manual labor contracts that often provide diminishing returns.
How do regional soiling rates in India dictate cleaning frequency?
In the Indian utility landscape, soiling is rarely uniform. Plants located in the arid zones of Rajasthan or Gujarat face aggressive sand accumulation, which causes Performance Ratio (PR) degradation of 0.5% to 1.0% per day. Conversely, sites in humid regions like coastal Tamil Nadu or Odisha experience more gradual soiling, often driven by moisture and airborne contaminants. Relying on a blanket cleaning schedule across a multi-GW portfolio is a common source of inefficiency.
For optimal O&M, IPPs must categorize their assets into soiling-intensity tiers:
- High-Intensity (Desert/Arid): Sites in Rajasthan, western Gujarat, and parts of Haryana require bi-weekly cleaning cycles to prevent irreversible loss. In these corridors, waterless robotic cleaning is essential to avoid the cost of transporting water and the risks of mineral scaling from brackish local groundwater.
- Moderate-Intensity (Industrial/Agri-adjacent): Plants located in central India, such as Maharashtra or Madhya Pradesh, often face seasonal cycles linked to crop harvesting or agricultural burning. Monitoring AQI data and local agricultural calendars helps schedule extra cleaning passes during high-particulate months.
- Low-Intensity (Coastal/Southern Plateau): While these regions suffer less from wind-blown sand, salt spray and high humidity create sticky layers of dust. These sites require higher-frequency manual maintenance or dedicated cleaning robots to avoid biofilm buildup, which is harder to remove than loose dust.
Understanding regional soiling is the foundation of effective cleaning cost planning. By correlating local weather data with yield drops in soiling loss tools, operators can determine the precise day a plant block hits the break-even point for cleaning. This data-backed approach shifts O&M from a fixed cost center to an intelligent, yield-protection strategy that mitigates the risk of under-performing during peak seasonal demand.
Technical transition: Moving from manual labour to automated systems
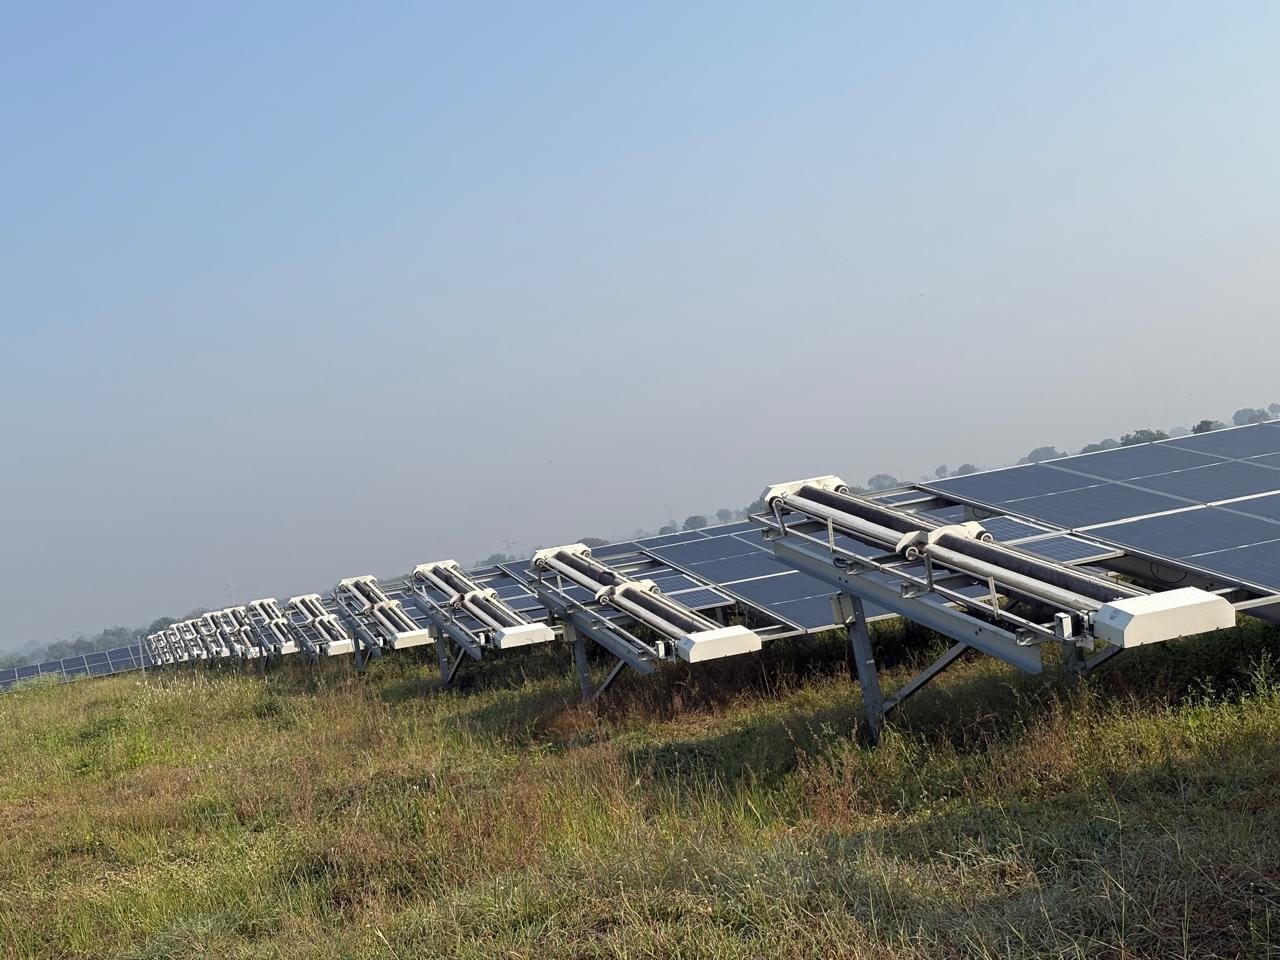
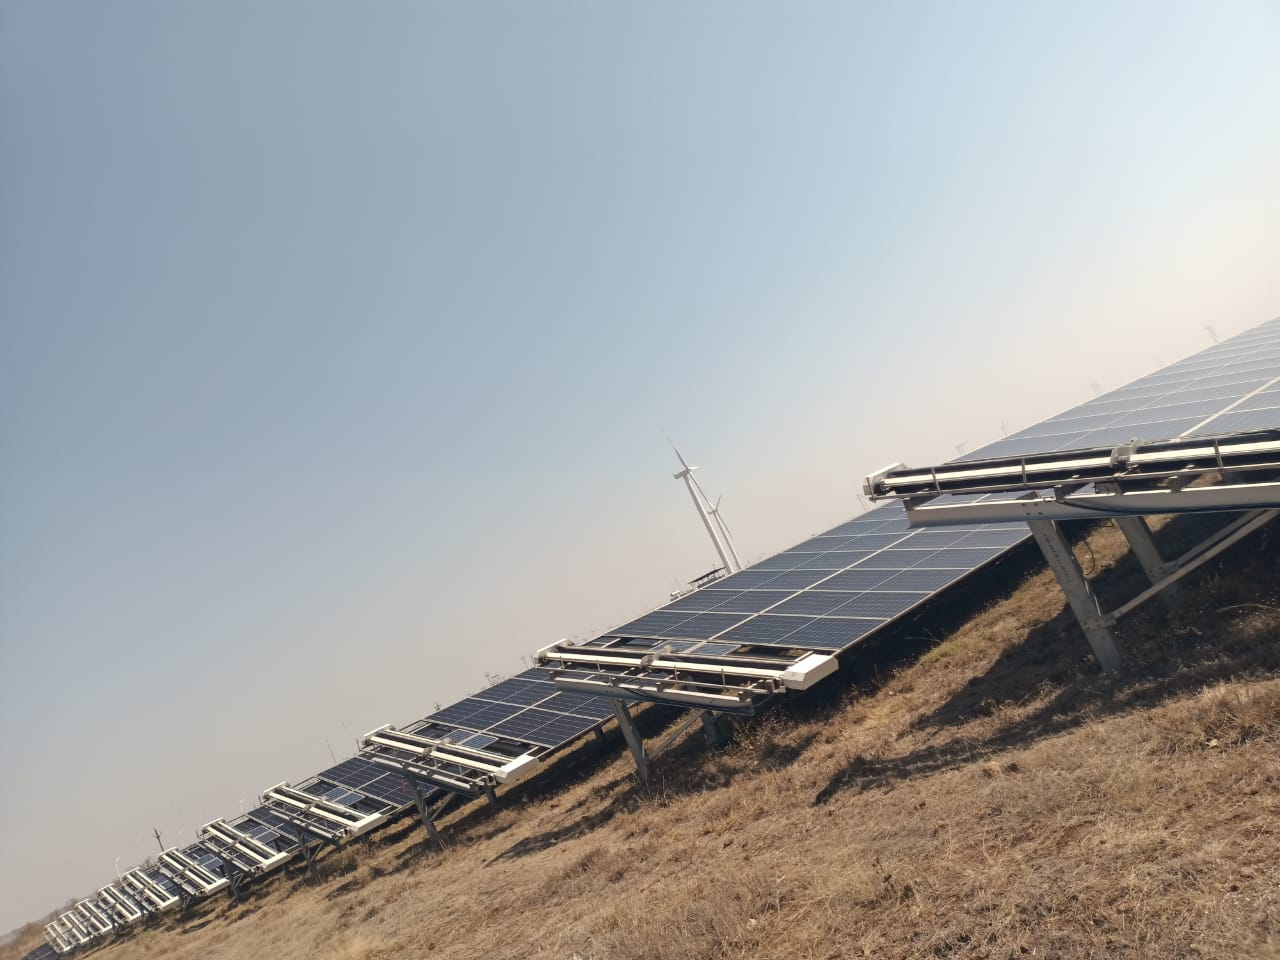
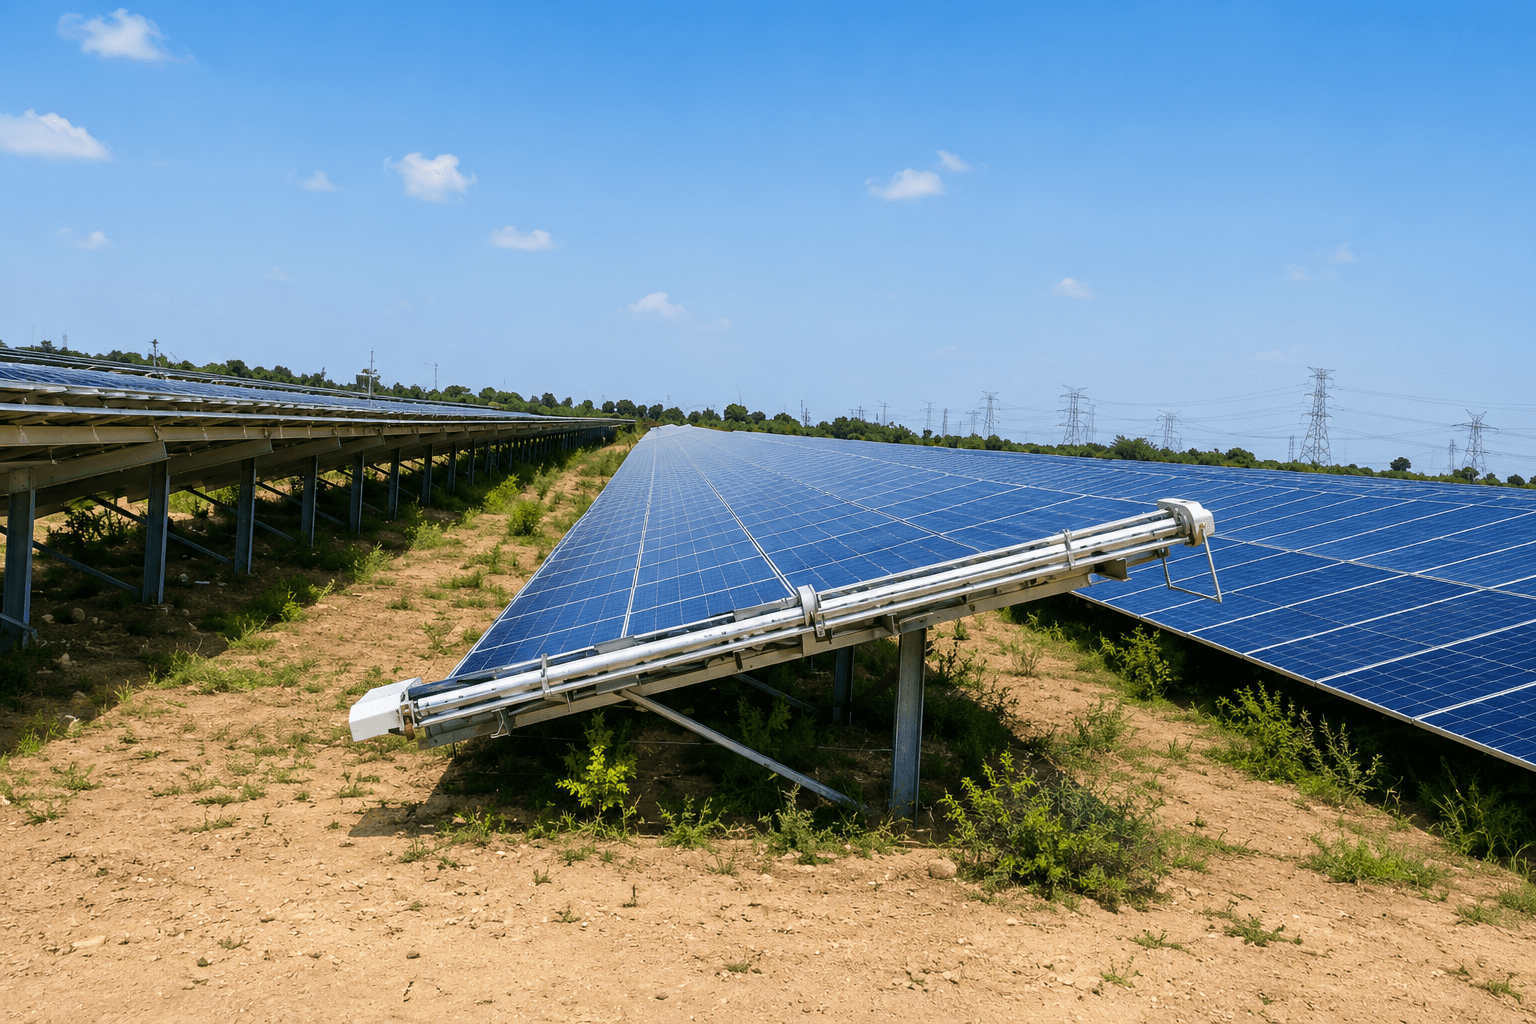
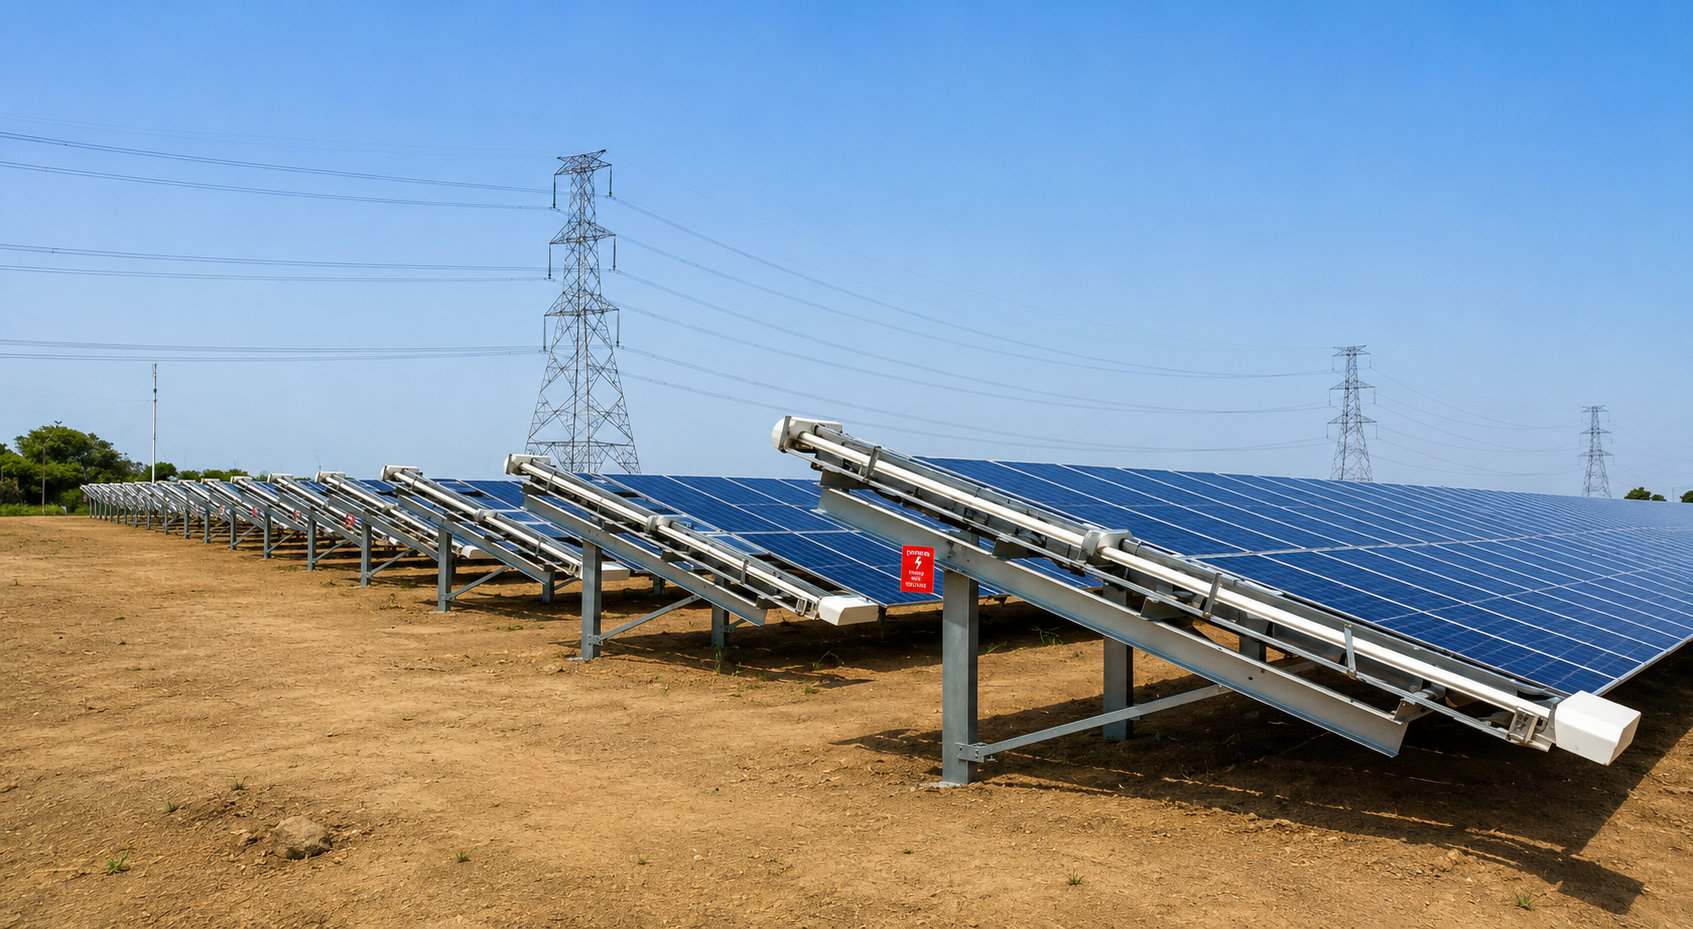
Moving from manual cleaning to autonomous robotic systems is not merely an equipment upgrade; it is a fundamental shift in O&M architecture. For MW-scale plants in India, this transition requires aligning plant design with robot mobility requirements. A critical first step involves auditing your existing site layout to ensure that inter-row spacing, tilt angles, and end-of-row access paths meet the minimum operational requirements for robots like the GLYDE or NYUMA.
The transition process typically follows a three-phase approach to mitigate operational risk:
- Baseline & Pilot Phase: Select a single block or row (ideally 1–2 MW) to install a pilot fleet. During this phase, you must record baseline PR recovery, water consumption, and robot power reliability. This data validates your ROI before a full-site rollout.
- Infrastructure Preparation: Retrofit end-row tracks or ensure that docking stations, such as the CRADYL, are integrated into the plant design. This allows for automated row-transfer, removing the need for manual 'lift-and-shift' labour which often leads to panel breakage and safety incidents.
- Fleet Integration: Connect your robots to a centralized management portal like NECTYR. Automated fleet monitoring allows you to replace manual attendance registers with real-time logs of cleaning passes, battery status, and fault alerts.
IPPs must also evaluate the technical compatibility of their modules. Modern bifacial modules, increasingly common in Indian utility projects, require specialized cleaning methods. While single-pass PBT brushes used on the NYUMA-X are effective for standard surfaces, developers often select dual-pass microfiber systems like the GLYDE-X to ensure residue-free cleaning on rear-side glass without risking micro-cracks or anti-reflective coating degradation.
By automating the cleaning cycle, you decouple O&M budget planning from manual labour volatility. In a typical 50 MW plant, shifting to an automated stack eliminates the logistical challenges of managing large cleaning crews, reduces water reliance by up to 90%, and ensures that cleaning frequency remains consistent even during peak periods when labour availability is low. This structured technical migration is the most reliable path for ensuring long-term yield protection in high-soiling environments.
What plant managers should do next for 2026 compliance
As 2026 approaches, the alignment between government subsidy schemes and long-term O&M planning has never been more critical for Indian IPPs. With the focus shifting toward domestic manufacturing under the PLI scheme and stricter ALMM compliance, your cleaning and O&M strategy must evolve beyond reactive maintenance. Proactive asset owners are now auditing their cleaning infrastructure to ensure consistency and water efficiency, which are vital for maintaining PR in high-soiling zones like Rajasthan and Gujarat.
- Perform a site-specific soiling audit: Before 2026 Q1, map your plant's soiling loss data to current weather patterns. Use this to determine if your current manual schedule is cost-effective or if a transition to automated waterless cleaning is required for your specific MW block.
- Optimize your O&M budget for automation: If you are planning a new utility-scale project or an AMC renewal, account for the long-term O&M savings provided by robotic systems. Factor in a 90% reduction in water use and the mitigation of PR loss to justify the shift from high-risk manual labor to data-driven autonomous fleets.
- Adopt a tiered O&M model: Consider integrating autonomous robots for base-load cleaning and keeping manual teams for complex or edge-case maintenance. This hybrid approach ensures you remain compliant with O&M performance benchmarks while maximizing the lifespan of your modules.
- Leverage fleet monitoring for accountability: Transition away from manual logbooks. Implement digital platforms like NECTYR to track daily cleaning passes, fault alerts, and battery status across your entire MW portfolio, ensuring transparent reporting for both stakeholders and regulatory bodies.
By shifting to a structured, autonomous O&M framework now, you secure your generation capacity against the volatility of the 2026 market. For IPPs managing portfolios above 50 MW, the transition from manual, brush-based cleaning to an intelligent, robot-managed stack is the most effective path toward long-term yield optimization. You can verify your potential return on investment by using a cleaning robot ROI calculator to match your current Opex spend against a scaled robotic deployment.
Sources and further reading
Frequently asked questions
For utility-scale assets in India, effective subsidy schemes 2026 cleaning cost planning relies on balancing upfront capital allocation against the high opex of manual wet maintenance. IPPs should shift towards data-driven cleaning cycles to maintain performance ratios in high-dust regions like Rajasthan and Gujarat.
The primary drivers include high-variable manual labor expenses and water consumption costs. Moving toward dry robotic cleaning systems allows IPPs to reduce water usage by up to 90 percent and hedge against future increases in labor wages.
In high-dust regions such as Rajasthan and Gujarat, operators should implement cleaning cycles at 2–7 day intervals. This frequency prevents permanent degradation and hard-soiling buildup, allowing for a 15–30 percent energy yield recovery.
Yes, adopting automated cleaning is increasingly recognized as a qualifying expense for operational modernization. It ensures consistent performance ratios required by updated 2026 guidelines, especially for bifacial modules where rear-side soiling impacts overall energy production.