Liquidated Damages for Generation Loss Due to Soiling
A 100MW Rajasthan site facing a PPA penalty gap
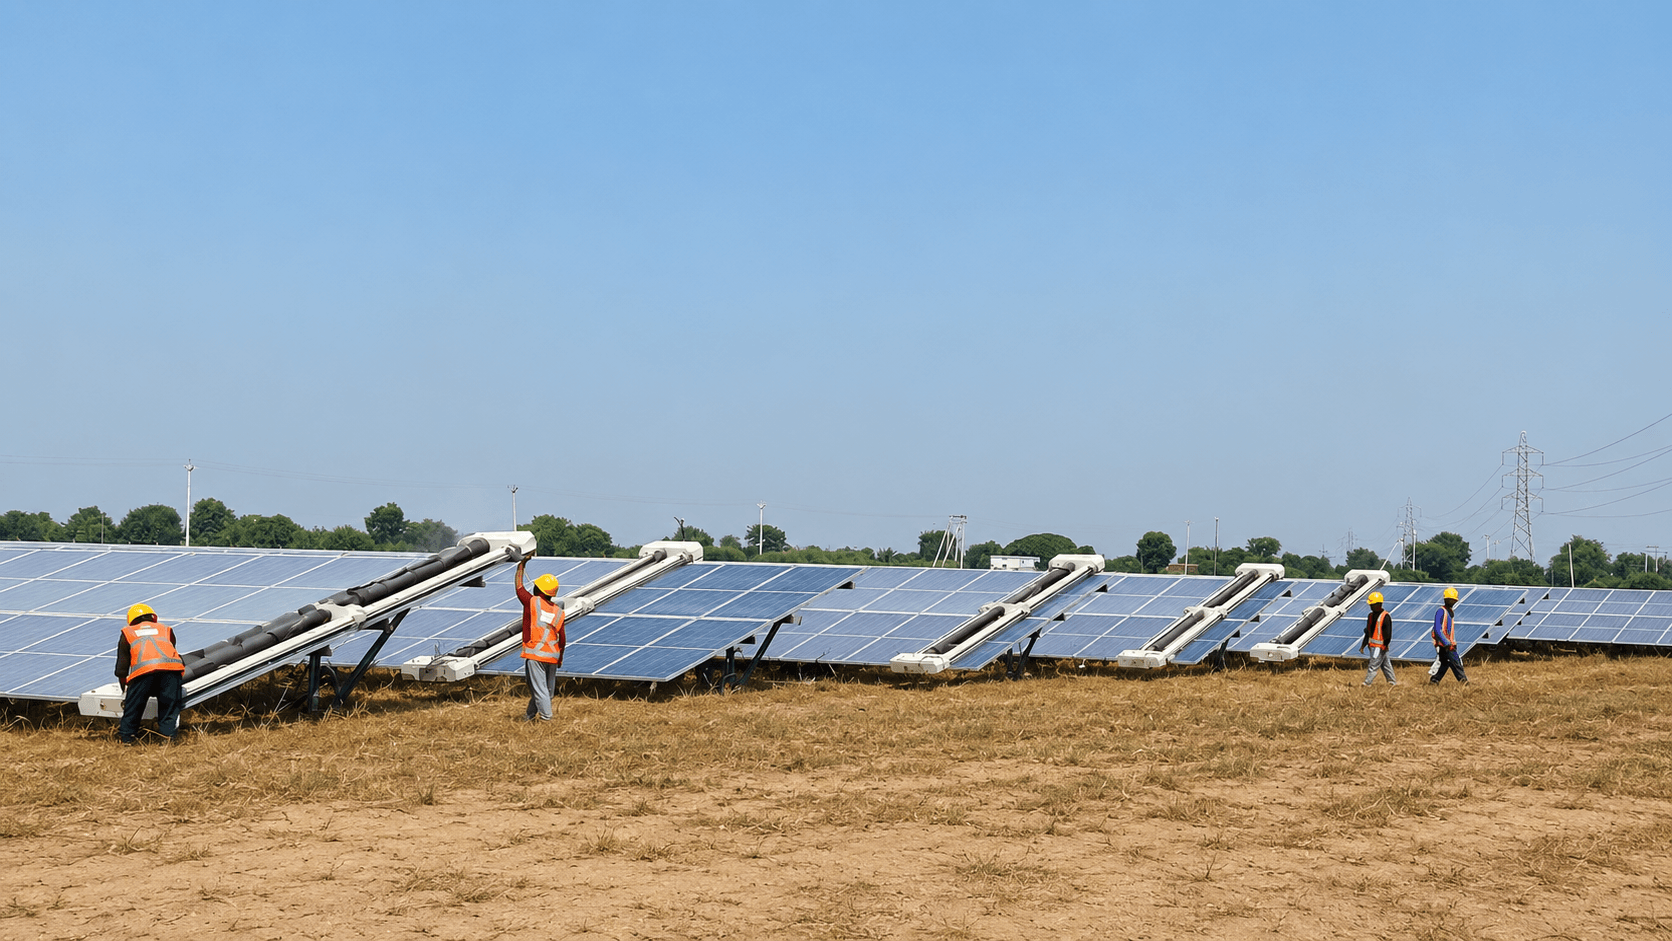
For a 100MW plant in Rajasthan, liquidated damages are a real risk. They occur when you fail to meet the Performance Guarantee (PG) in your PPA. If soiling drops your Performance Ratio (PR) too low, you face penalties. Many sites set a threshold between 75% and 80%. In dusty areas, yield loss can hit 15% to 30%. This turns a simple O&M issue into a major financial risk.
A penalty gap occurs when generation stays below the target for several quarters. If you cannot prove you followed a cleaning schedule, you have no defense. A strong cleaning program is a key risk management tool. It shields your revenue from clawbacks. Data-driven schedules help you move from reactive cleaning to a predictable model. For large fleets, data is the only way to avoid financial loss. Learn more in our analysis of automated cleaning data. Also, see how automated monitoring systems provide the evidence needed for audits.
Defining 'liquidated' and 'damages' in solar O&M contracts
In solar contracts, 'liquidated damages' are set penalties. You agree on these amounts when you sign the contract. They compensate owners for performance failures like soiling loss. These are not general damages. You do not need to prove market loss in court. Instead, a clear formula triggers a deduction from your monthly invoice or bond. This happens when your PR falls below the agreed level.
'Damages' represent the money lost due to the gap in generation. This compares expected output to the actual output at the substation. For Indian plants, we use the Performance Ratio (PR). This compares energy yield to sunlight levels. If you miss cleaning schedules, dust builds up. In places like Rajasthan, loss reaches 15% to 30%. This is often seen as poor maintenance, not an act of nature.
For asset managers, these penalties can add up. If a contract requires a 78% PR but the site hits 72%, you must pay. The damages are calculated per kWh of shortfall. It is vital to know the difference between O&M costs and penalty risks. Cleaning costs money, but penalties cost much more. Ensure your PPA defines 'soiling' clearly. This helps you separate it from module degradation. Read our guide on isolating performance losses to prevent invalid claims.
Calculating generation loss: The technical math of soiling impact
You must separate weather issues from physical dust. This helps you calculate the exact impact on your PR. Module degradation is a slow, steady process. However, soiling is cyclical. In arid regions like Gujarat, soiling can cause a 15% to 30% yield loss.
Operators calculate the loss threshold using a simple formula. They compare actual energy output to the theoretical yield. This yield is adjusted for sunlight levels. Daily loss might only be 0.1% to 0.5%. But over 15 days, this adds up quickly. This often drops the PR below the 78% to 80% target. Many operators use reference modules to track this. Comparing clean modules to the main array shows the exact loss. This helps you schedule cleaning before penalties hit. Our analysis on isolating performance losses provides a framework for audit defense. Note that reducing cleaning to save money is rarely seen as a force majeure event. This leaves the full liability on the operator.
What are the common triggers for liquidated damages in Indian PPAs?
Indian PPAs trigger damages when a plant misses its Guaranteed Performance Ratio (GPR). Most contracts set a minimum PR between 78% and 80%. If soiling causes the PR to drop, you pay a penalty. This penalty is based on the missing energy generation.
The trigger process usually follows a formal audit:
- Performance Ratio Deviation: The PR drops below the GPR for a month or a quarter.
- Documented Maintenance Failure: You cannot prove you followed a cleaning schedule. This is critical if losses hit 15% to 30% in dusty regions.
- Energy Yield Shortfall: The loss in MWh is measured against your energy models. Soiling is seen as a controllable factor, not a grid issue.
Plant managers must know the difference between grid issues and soiling. Grid curtailment is often excusable. Soiling losses are almost always the responsibility of the O&M provider. Use our guide on isolating performance losses to ensure your data is accurate. Adopting fleet telemetry can also provide the documentation needed to shield your project from claims.
Step-by-step: Implementing a soiling-resilient cleaning protocol
Many 100MW plants struggle with manual cleaning cycles. To avoid penalties, move from fixed schedules to condition-based cleaning. This keeps your logs ready for audits.
- Baseline Calibration: Run a 14-day performance audit during the dry season. Use clean reference modules to measure true soiling loss.
- Dynamic Triggering via SCADA: Set a trigger based on your PR. Trigger a full cleaning cycle within 48 hours if the PR falls below 78%. You should also trigger it if satellite data shows a loss over 2%.
- Execution and Verification: Use fleet-ready robots. Ensure every row completion is timestamped. Log the start and end times for every block. This protects you during audits.
- Automated Data Logging: Use software like NECTYR to automate logs. This removes human error. It also provides a clear record for plant owners.
- Feedback Loop Integration: Check the PR after cleaning. If it does not recover, inspect the panels for bird droppings or damage.
This approach turns cleaning into a verifiable asset. It reduces penalty risks and improves plant output. Learn more about performance monitoring strategies to keep your fleet in compliance.
Mitigating risk: Manual labor vs. automated cleaning consistency
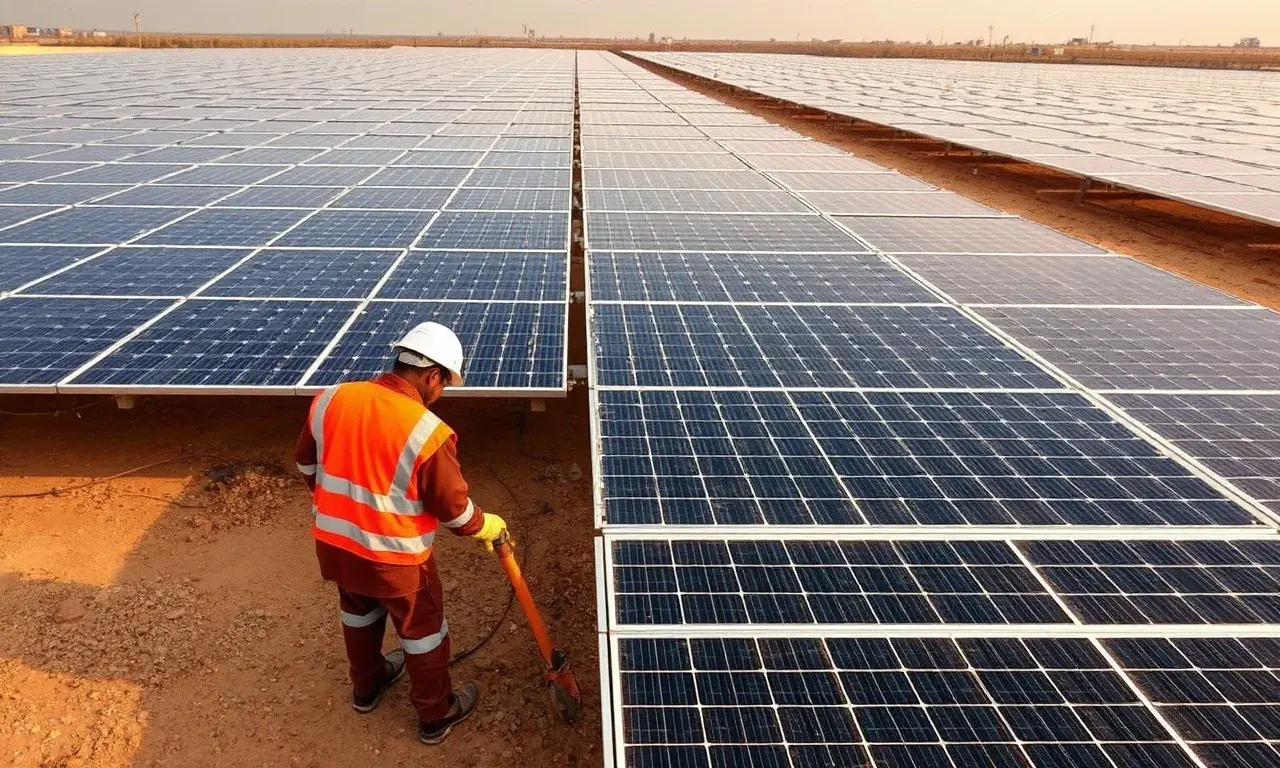
Manual labor carries high risk. Cleaning quality varies too much. Crews often rely on visual checks alone. This leads to uneven cleaning. Dust patches can cause hotspots and module damage. This creates a steady generation loss that is hard to explain during audits.
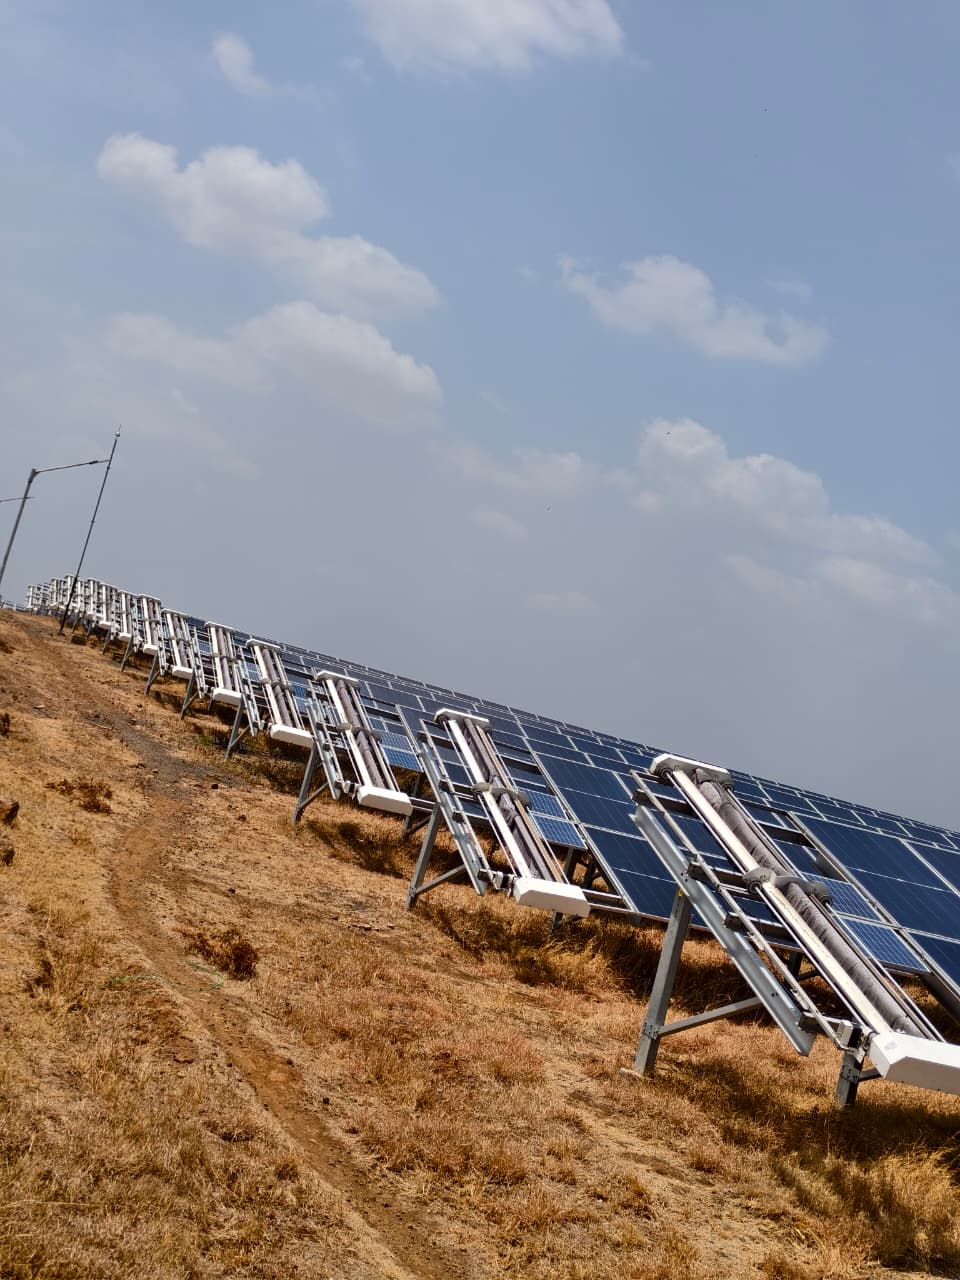
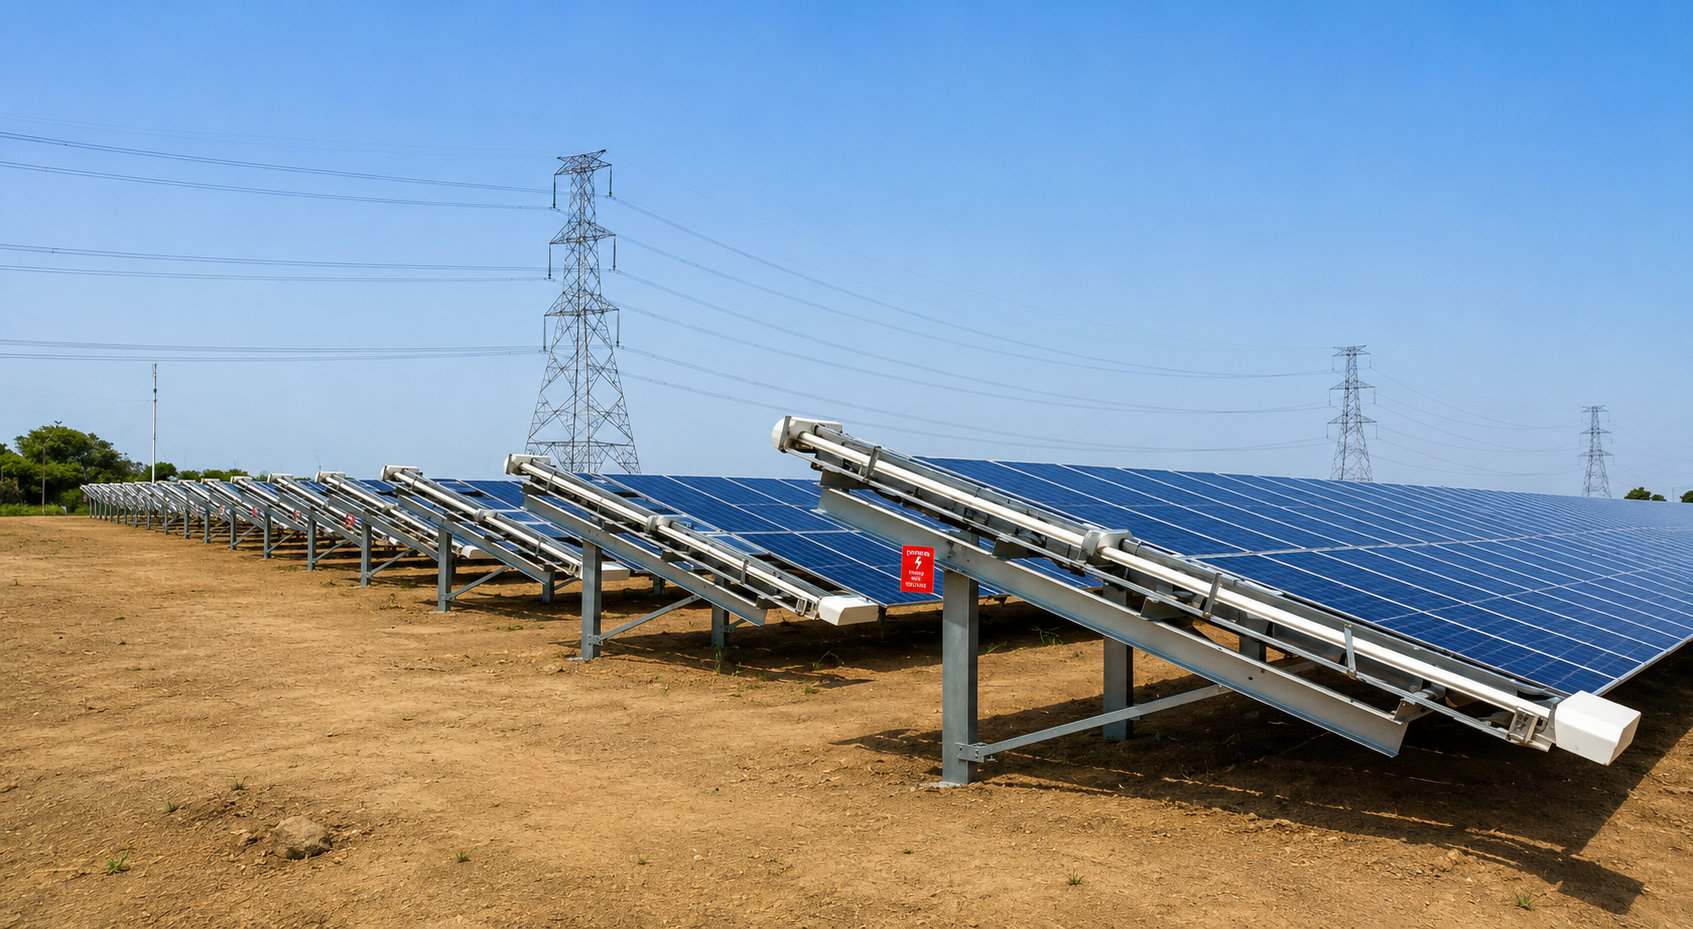
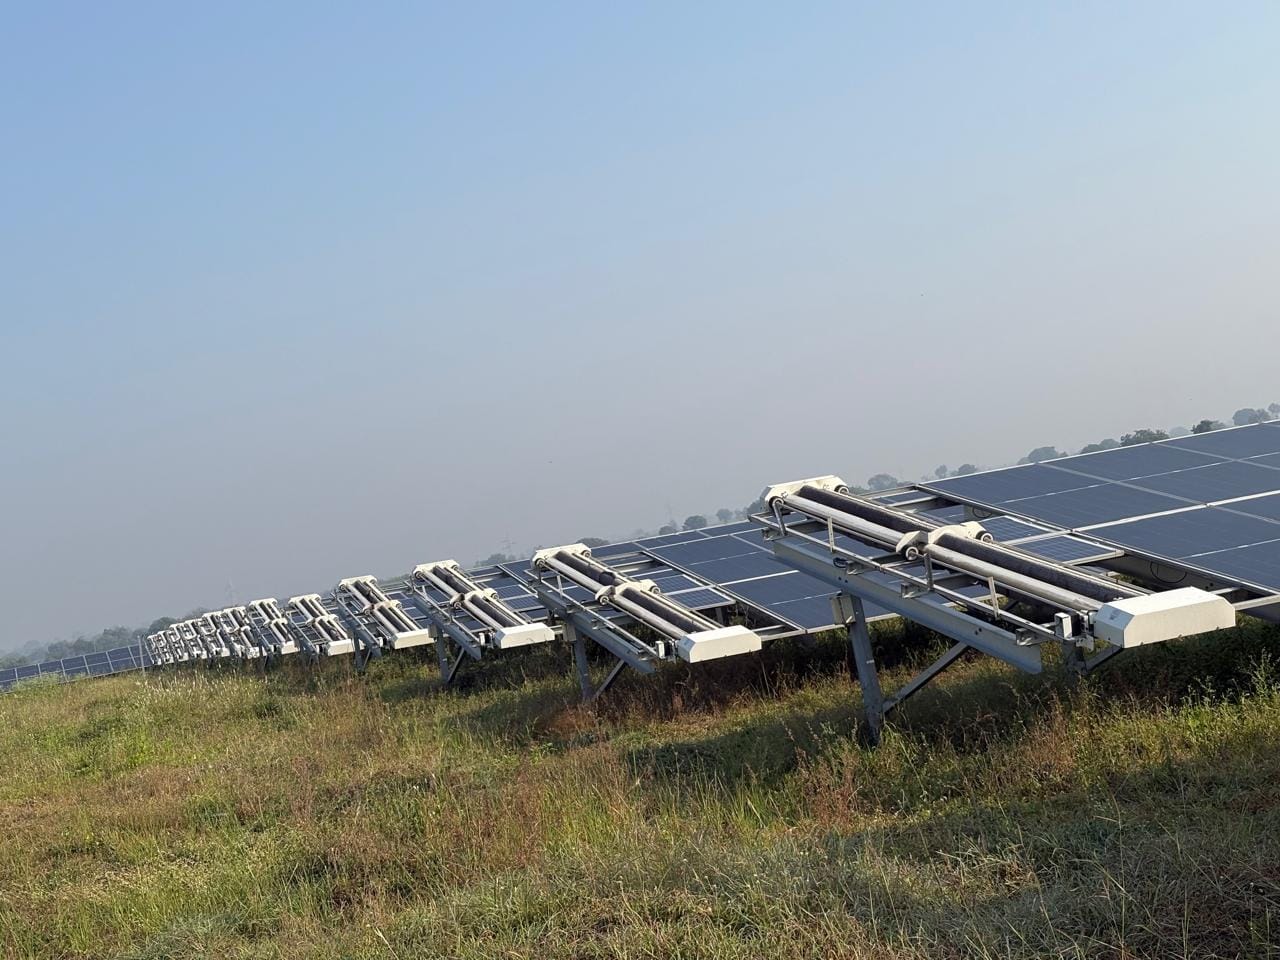
Automated cleaning is much more consistent. Systems like GLYDE or NYUMA ensure uniform pressure on every panel. They can reach 95%+ to 99%+ dust removal per cycle (by robot model). This makes PR recovery predictable. You can prove every block was serviced. This removes the guesswork from your reports.
Automation helps in two ways. First, it keeps output within PPA limits in dusty areas. Second, it lowers costs by managing fewer people. Asset managers should move toward robotic fleet telemetry. Replace manual work with an automated monitoring stack. This helps IPPs secure their guarantees and ensure long-term success.
How to defend against claims during a technical performance audit?
If an owner claims damages, you must prove the cause. You must separate soiling from equipment aging. First, normalize your data against weather inputs. Subtract the expected module degradation (usually 0.5% to 0.7% per year). The remaining gap is your potential soiling loss. Cross-reference this with your NECTYR logs to prove you met your duties.
Build a strong data package using these steps:
- Baseline PR Verification: Compare current PR to historical data. Use on-site sensors to account for temperature and light.
- Automated Service Records: Show timestamped, geo-tagged robot logs. Systems like GLYDE or NYUMA provide reports that confirm the exact time and duration of cleaning.
- Visual and Sensor Validation: Use sensor-based soiling data to back up your digital logs. This shows cleaning happened when it was needed.
- Third-Party Compliance Review: If disputes continue, hire an engineer. They can verify your records against energy output. This often satisfies auditors.
Automation removes subjectivity. It turns maintenance into a defensible process. Use fleet telemetry strategies to keep your program safe.
Key takeaways for asset managers and O&M leads
- Audit Readiness: Use NECTYR for timestamped logs. This separates soiling from equipment degradation.
- Quantify PR Drift: Clean the panels if the PR drops more than 1% in a week. This prevents major penalties.
- Standardize Execution: Use waterless robots instead of manual crews. This removes human error.
- Prioritize Data Integrity: Link cleaning to real-time weather data. This proves your frequency is correct for local dust.
Sources and further reading
Frequently asked questions
Liquidated damages are calculated using a predetermined formula defined in the power purchase agreement. When actual energy generation or the performance ratio falls below the guaranteed contractual threshold, the penalty is automatically deducted from the monthly invoice based on the yield shortfall.
In high-dust regions like Rajasthan, soiling significantly drags down the performance ratio by reducing the amount of sunlight that reaches the photovoltaic cells. Without an optimized cleaning cadence, operators often experience yield losses of 15-30 percent, which can push the performance ratio below the guaranteed 75-80 percent threshold.
Yes, maintaining an audit-ready cleaning log is critical for defense. If an operator can demonstrate that cleaning cycles were performed according to the agreed technical schedule, they are better positioned to defend against performance audits and mitigate the risk of revenue clawbacks.
Distinguishing these requires robust telemetry and data-driven monitoring. By utilizing automated systems to track real-time panel performance, operators can isolate losses caused by dust accumulation from long-term hardware degradation, providing the granular evidence needed to justify performance figures during contractual audits.