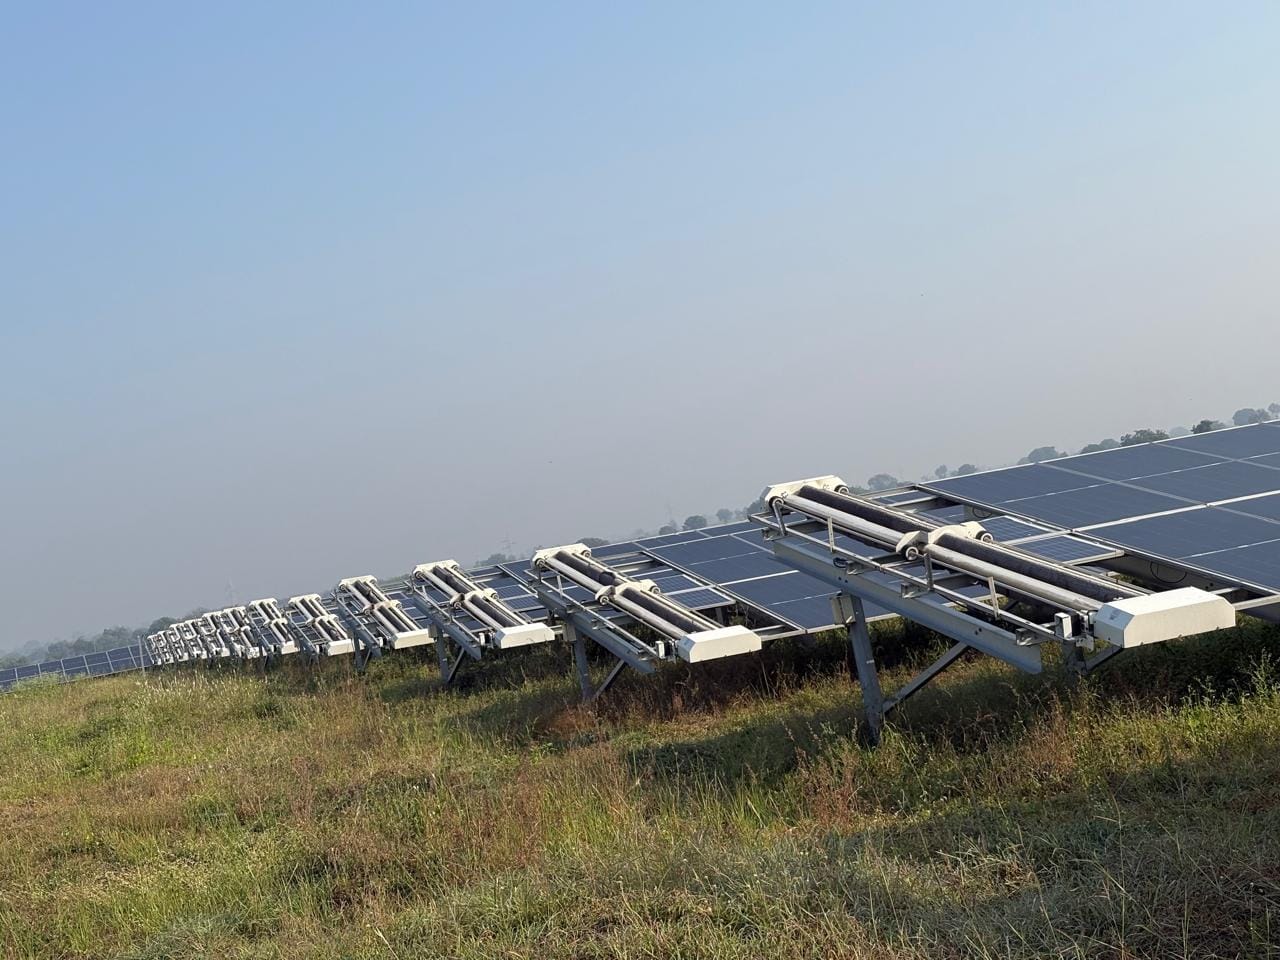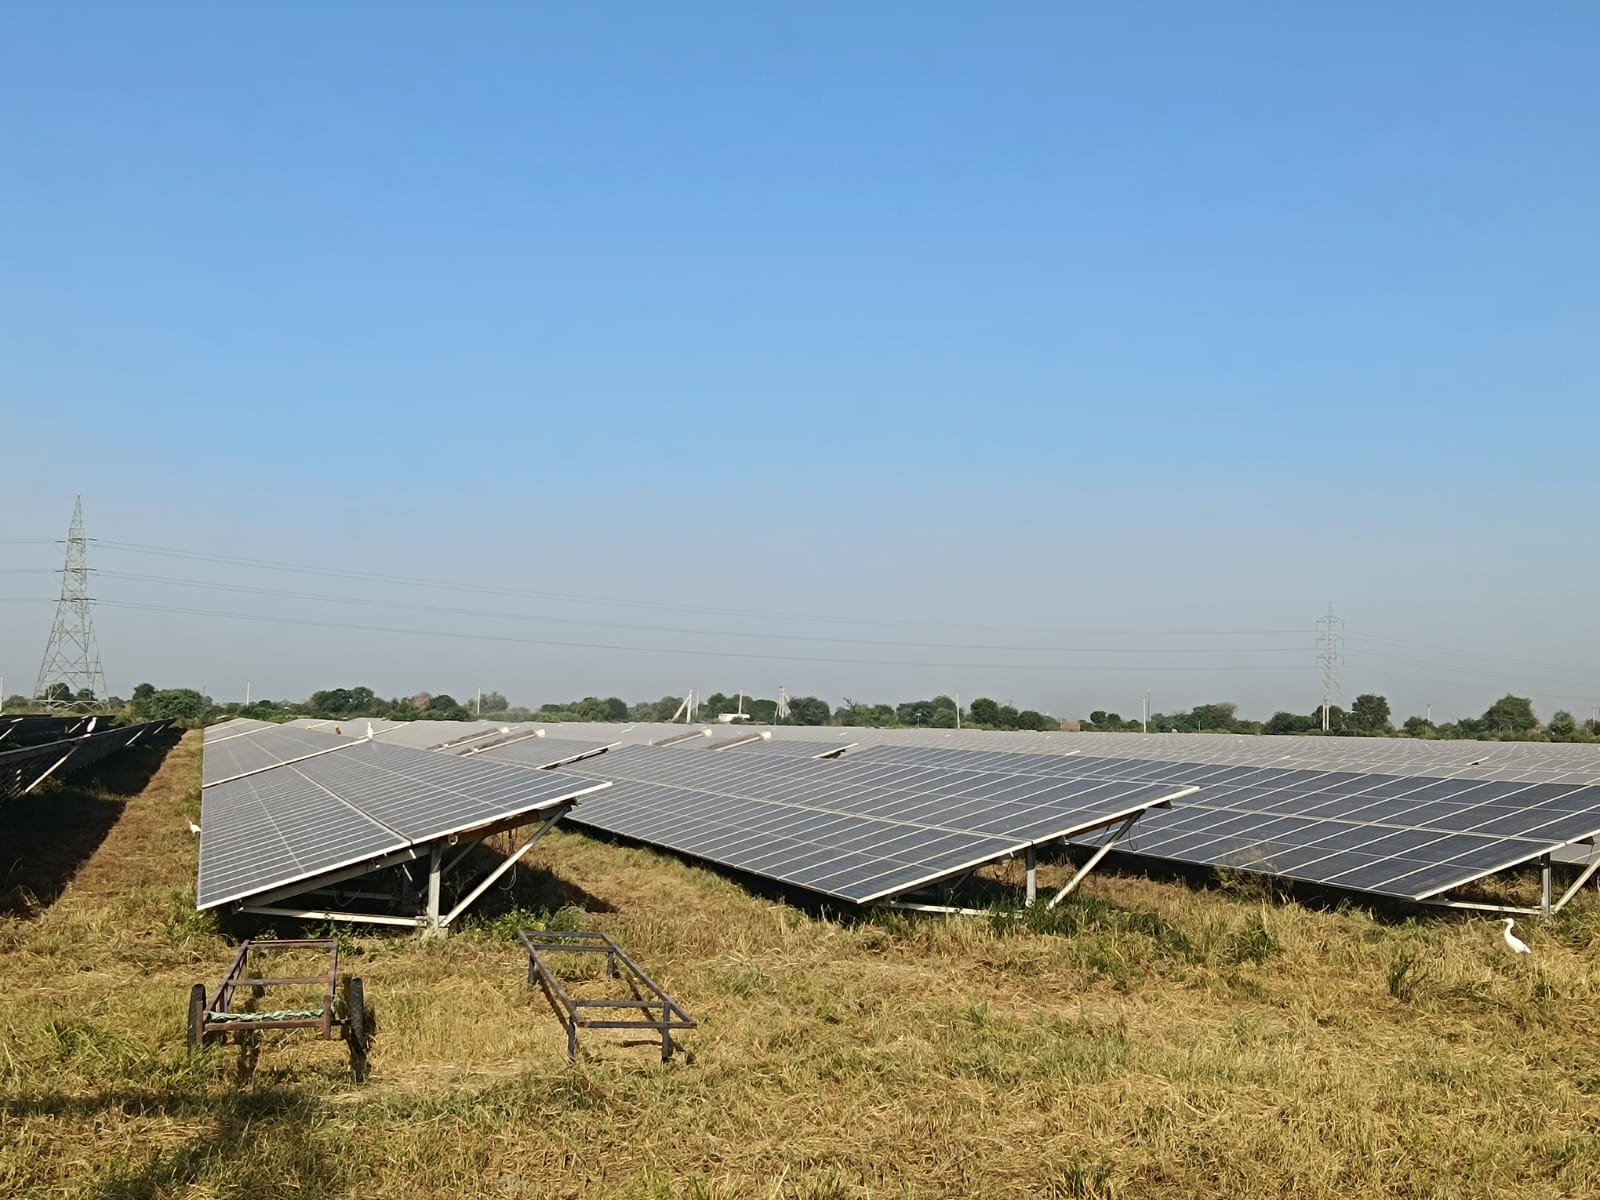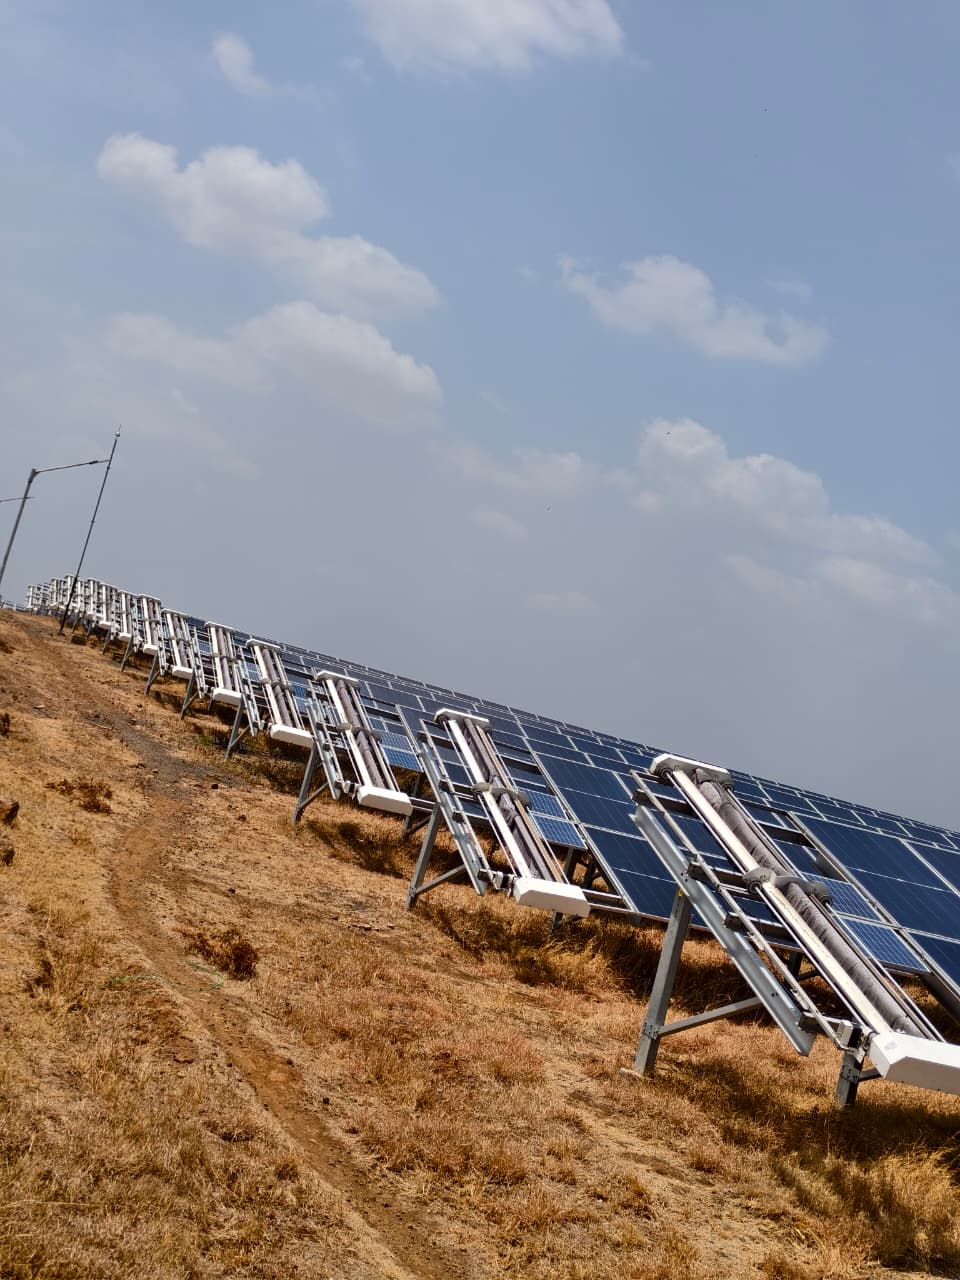
Calculating carbon credits from soiling loss reduction requires a precise conversion of recovered energy yield into carbon dioxide equivalent (CO2e) avoidance. By linking your performance ratio (PR) recovery directly to the Carbon Credit Trading Scheme (CCTS) framework, asset managers can turn a standard maintenance expense into a measurable ESG asset.
The 100MW Rajasthan Scenario: When PR Drift Becomes a Carbon Liability
In a 100MW utility-scale plant located in Rajasthan, high irradiance levels are frequently undermined by rapid dust accumulation. When PR drifts from an expected 82% to 74% over a single dry month, the plant loses significant generation potential. This lost MWh is not merely a revenue gap; it is a direct failure to displace fossil fuel energy generation. Under India's CCTS, the carbon liability of this soiling is calculated by multiplying the energy deficiency by the grid emission factor.
Consider a plant with an annual average soiling loss of 10%. If this loss is reduced by 6% through an optimized cleaning cycle, the plant recovers roughly 4,500 to 5,500 MWh per annum, depending on specific solar resource data. At a standard grid emission factor (typically ranging from 0.71 to 0.82 tCO2e/MWh for the Indian grid), this recovery translates into approximately 3,500 to 4,500 tonnes of CO2e avoided annually. For a site manager, this signifies that every percentage point of PR recovery has a tangible carbon value that can be validated for compliance and reporting. Managing these losses through robust data cycles is no longer optional for ESG-compliant portfolios, as highlighted in fleet telemetry analysis. Failing to optimize cleaning schedules leaves this carbon value stranded, effectively paying for the lost generation twice through both missing revenue and unrealized carbon credit potential.
Defining the Baseline: Understanding Carbon as a Function of Soiling
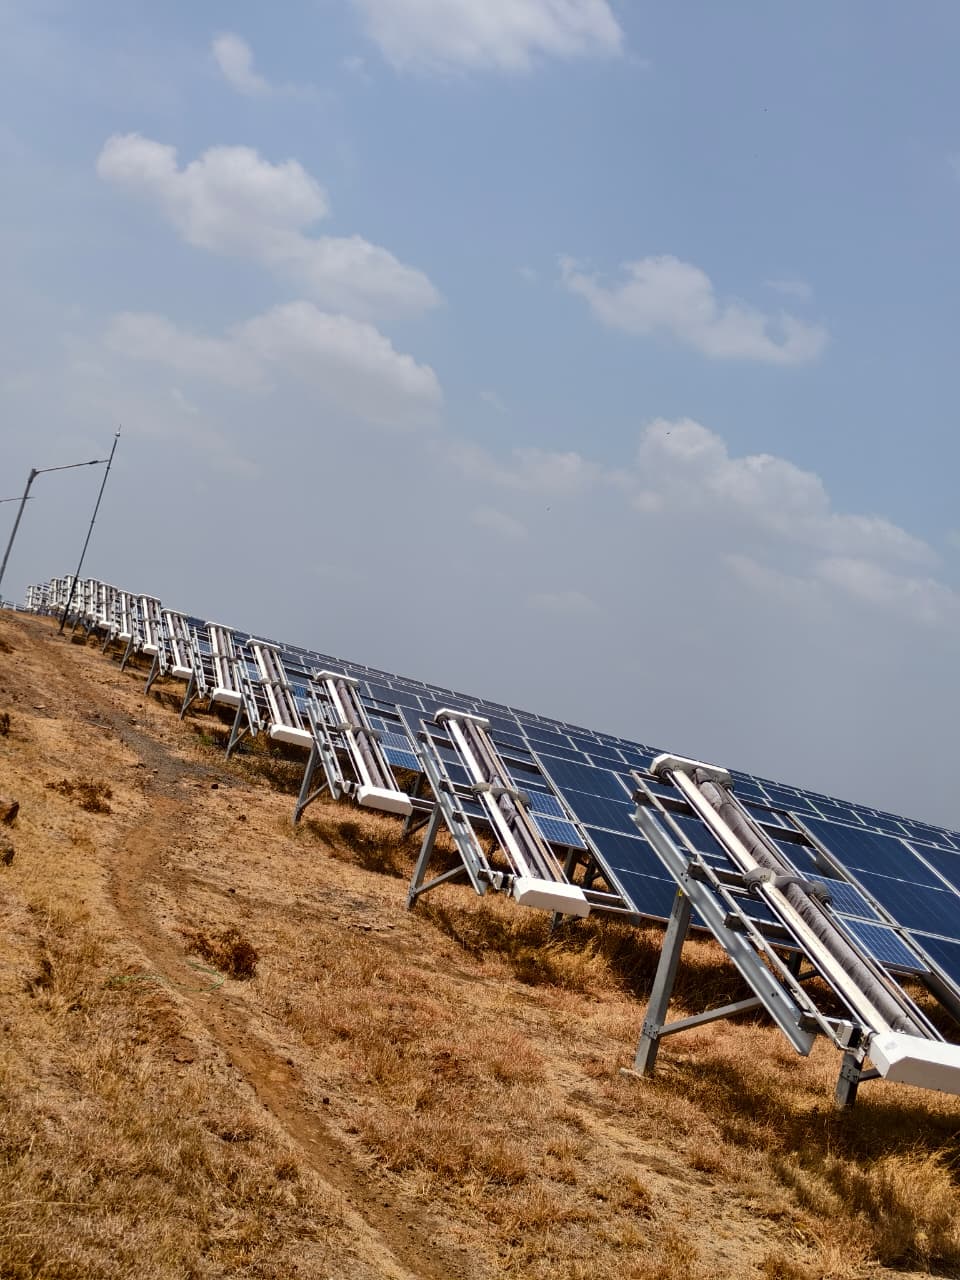
To accurately calculate carbon credits, you must first isolate soiling loss from other system variables like module degradation or inverter downtime. In the context of the Carbon Credit Trading Scheme (CCTS) in India, the baseline is defined by the energy yield your plant would achieve under perfect environmental conditions versus the actual yield affected by dust, bird droppings, and regional particulate matter.
For a standard 50MW or 100MW utility plant in India, site managers often observe a Performance Ratio (PR) dip of 5% to 30% depending on seasonal severity. The baseline emission calculation requires:
- Documented PR data from your SCADA system to isolate soiling impact from equipment performance.
- The specific grid emission factor provided by the Central Electricity Authority (CEA) for your regional grid.
- Historical irradiance data (GHI) to normalize energy yield during the period of interest.
Without a clean baseline, the calculation for carbon credit claims remains speculative. By tracking the difference between actual generation and the potential generation of a clean panel, you establish the MWh of energy recovery attributable strictly to your maintenance intervention. This data-driven approach moves carbon accounting from estimated models to auditable logs, which is a critical step for plant managers aiming to monetize O&M performance. Effectively separating soft losses from technical degradation is a prerequisite for any fleet telemetry analysis you perform. Asset owners should note that inconsistent measurement protocols often lead to rejected credit applications during the audit phase of the CCTS lifecycle. For sites experiencing high dust loading, such as those in the desert regions of Rajasthan or Gujarat, aligning your data collection with these baseline protocols is not just an O&M task; it is the fundamental ledger for your site sustainability portfolio.
The Technical Calculation: Mapping Soiling Loss Reduction to CO2e Avoided
Translating soiling loss reduction into verified carbon credits requires a precise calculation of recovered generation that would otherwise be sourced from fossil-fuel-heavy grids. In the context of India's CCTS, the calculation follows a standardized emission reduction formula: ER = ER_baseline - ER_project, where ER is the Emission Reduction, measured in tonnes of CO2 equivalent.
For a 50 MW utility-scale solar plant, the calculation process involves three specific steps:
- Quantify Net Yield Recovery: Determine the differential between your actual yield during a high-soiling period and the theoretical yield of an optimally clean array. If you recover 5,000 MWh annually through automated cleaning, that figure is your core energy delta.
- Apply the Grid Emission Factor (GEF): Multiply this recovered energy by the CEA-published grid emission factor. For most Indian state grids, this factor ranges between 0.71 and 0.82 tCO2e/MWh. Using a conservative factor of 0.75, 5,000 MWh of recovered generation equates to 3,750 tonnes of CO2e avoided annually.
- Verify Against Baseline Documentation: Audits for carbon trading require proof that these MWh were not previously available. You must provide SCADA logs from periods before and after your cleaning intervention, alongside irradiance data to prove that the increase was due to module cleanliness rather than improved weather conditions.
For plant managers, the complexity lies in the temporal alignment of data. Effective carbon credit claims rely on granular telemetry, such as that provided by fleet telemetry systems, which track PR movement at the block or row level. Without the ability to correlate cleaning events with specific performance spikes, auditors may reject your recovery claims as speculative. By integrating your O&M logs directly with your generation data, you treat maintenance not as an expense, but as a carbon-generation asset. This transition from manual spreadsheets to automated reporting platforms is a prerequisite for any regular cleaning optimization schedule, ensuring that every cleaning cycle is auditable and traceable toward your annual sustainability targets.
How does the Carbon Credit Trading Scheme (CCTS) impact cleaning schedules?
India’s Carbon Credit Trading Scheme (CCTS) transforms solar plant maintenance from an operational cost center into a direct revenue driver. For plant managers, this means cleaning schedules must now align with the reporting requirements of the Carbon Credit Trading Scheme (CCTS) to ensure every recovered megawatt is eligible for verification. Unlike traditional O&M contracts that rely on fixed quarterly wash cycles, a carbon-aligned schedule is dynamic. It prioritizes cleaning events during high-irradiance windows where the delta between actual and potential generation is maximized, thereby creating a stronger, more verifiable data trail for auditors.
The CCTS framework emphasizes the principle of additionality. Your plant must demonstrate that the energy yield recovery achieved through regular cleaning, typically in the 3% to 15% range for utility-scale sites, is a direct result of these specific O&M interventions. This requires:
- Granular SCADA Logging: You must record the exact timestamp of every cleaning event. Automated systems, such as the fleet telemetry systems, simplify this by automatically syncing cleaning logs with generation data.
- Performance Ratio (PR) Benchmarking: Maintain a clean reference row or block to serve as your daily baseline. This allows you to isolate soiling losses from other technical degradation factors, providing the audit-ready documentation required under Indian regulatory norms.
- Frequency Optimization: Moving from calendar-based to condition-based cleaning reduces operational overhead while maximizing the avoided emission credit volume. This is especially critical for 50 MW+ plants in arid regions where dust buildup can cause significant yield slippage within mere days.
By moving to an automated cleaning approach, plant managers can capture the necessary data points without adding human labor hours. Integrating these schedules into your regular cleaning optimization schedule ensures that your site complies with the rigorous data standards of the CCTS. This shifts the focus from managing the labor cost of water-based washing to managing the net carbon return of the plant. As the market for carbon credits matures in India, the plants with the most accurate, continuous, and auditable maintenance logs will command the highest valuation for their generated offsets.
Measurement Protocols: From Soiling Ratios to Audit-Ready Data
Translating soiling loss reduction into verified carbon credits requires moving beyond simple visual inspections. Utility-scale operators in India must deploy a dual-layer measurement protocol that links site-specific meteorological data with real-time SCADA energy output. By establishing a baseline through a controlled, non-cleaned reference string or module block, you can isolate the impact of dust accumulation from grid fluctuations or inverter efficiency loss.
For audit-ready reporting, your measurement process must adhere to the following steps:
- Baseline Synchronization: Use a pyranometer collocated with your reference modules to determine the expected energy yield. Any divergence in actual vs projected output that exceeds the standard module degradation rate is categorized as a soiling loss event.
- Automated Log Generation: Platforms such as fleet telemetry systems eliminate manual reporting bias by timestamping the initiation and completion of every cleaning pass. Auditors under the Carbon Credit Trading Scheme (CCTS) require these digital proofs to validate that the energy recovery was indeed caused by an O&M intervention.
- Soiling Ratio (SR) Tracking: Calculate the ratio of actual yield to theoretical yield under standard test conditions. By monitoring this ratio daily, you can determine exactly when yield recovery hits the 3% to 15% threshold required to trigger a cost-effective carbon credit submission.
Without these granular logs, proving additionality becomes difficult, as regulatory bodies will challenge the causality between your O&M activities and the resulting carbon offset. Relying on regular cleaning optimization schedules ensures that the data you collect is consistent and auditable, effectively bridging the gap between operational performance and environmental accounting.
Mitigating the 'Double Counting' Risk in ESG Reporting
As utility-scale projects in India increasingly incorporate carbon credits into their financial reporting, the risk of double counting becomes a primary audit concern. Double counting occurs when the carbon offset from cleaning-driven yield recovery is claimed by both the plant owner and the cleaning service provider, or when the same emission reduction is reported under both a voluntary corporate ESG framework and India's formal Carbon Credit Trading Scheme (CCTS). To ensure your credits are valid and tradable, you must establish a clear chain of custody for your generation data.
For operators of 50 MW+ portfolios, avoiding this risk requires rigorous contractual and data-handling discipline:
- Define Carbon Ownership: Explicitly state in your cleaning service contract that all environmental attributes and generated carbon offsets remain the sole property of the asset owner.
- Standardize Emission Baselines: Use a consistent regional grid emission factor (tCO2/MWh) as provided by the Central Electricity Authority (CEA). Using internal estimates or non-standardized factors creates discrepancies that auditors will flag as non-compliant.
- Immutable Data Logging: Use fleet telemetry software to record the exact start and end times of every automated cleaning pass. This creates an auditable record that links specific yield recovery events to your regular cleaning optimization schedule, proving that the energy gain is the direct result of a documented maintenance activity.
- Unique Attribution IDs: Assign a unique identifier to each carbon credit batch derived from soiling reduction. This allows for clear tracking in your ESG registry and prevents the submission of the same generation improvement to multiple carbon market platforms.
By treating cleaning data with the same technical scrutiny as generation billing, plant managers can provide the transparency necessary for high-value carbon credit validation. Integrating these protocols into your solar panel cleaning systems ensures that the environmental impact is measurable, verifiable, and uniquely yours, safeguarding the long-term integrity of your sustainable asset valuation.
Operational Thresholds: When is Yield Recovery Worth the Credit?
For large-scale Indian solar sites, the decision to trigger a cleaning intervention is rarely based on aesthetic standards. Instead, it is an economic equation where the cost of the cleaning service must be lower than the value of the incremental energy generated. When factoring in the additional revenue potential from carbon credits, the sensitivity of this threshold increases. In high-soiling regions such as Rajasthan or Gujarat, where dust accumulation can drive performance ratio (PR) losses of 5% to 30%, identifying the optimal cleaning point is critical to maintaining a profitable carbon asset portfolio.
As a rule of thumb for 50 MW+ sites, the intervention threshold typically lands between a 3% and 5% PR drop. When your fleet telemetry software indicates that soiling losses are exceeding this margin, the yield recovery justifies the operational cost of the cleaning run. For projects integrated into the Carbon Credit Trading Scheme (CCTS), this 3% to 5% range is the 'sweet spot' for volume: it represents enough energy recovery to quantify a meaningful emission reduction, yet ensures you are not cleaning so frequently that the energy cost of the cleaning equipment exceeds the carbon value itself.
Consider these threshold parameters when planning your O&M calendar:
- Lower Bound (3% PR Loss): Below this point, the cost of labor or robotic power consumption often outweighs the marginal revenue from carbon credits and energy gain.
- Upper Bound (15% PR Loss): Sustained soiling at this level indicates a failure in the cleaning cycle. Beyond 15%, the efficiency of the cleaning equipment, specifically regular cleaning optimization schedules, is compromised by the stubborn nature of aged dust layers, leading to potential permanent yield degradation.
- Fleet-Wide Scaling: For portfolios over 100 MW, apply these thresholds per block or per cluster rather than site-wide. This granular approach prevents the common error of cleaning low-soiling areas while ignoring high-loss zones, ensuring every MWh recovered is eligible for credit certification.
By defining these specific recovery targets, plant managers turn a variable O&M expense into a quantifiable ESG asset. This technical rigor ensures that every cleaning pass is not just a maintenance task, but a documented step toward your site's annual carbon emission reduction target.
What plant managers should do next
Moving from a passive maintenance strategy to an active, audit-ready carbon credit program requires operational changes that go beyond simple cleaning. Plant managers at 50 MW+ sites in India should prioritize the following steps to ensure their soiling loss reduction efforts yield verifiable credits under the Carbon Credit Trading Scheme (CCTS).
- Baseline Standardization: Before deploying any fleet-wide cleaning protocol, establish a clean-panel baseline using reference cells. Without this reference, your soiling loss data lacks the scientific rigor required by third-party auditors to certify emissions reductions.
- Automated Data Integration: Transition from manual spreadsheets to automated logging. If you use a robotic cleaning solution, ensure the telemetry data, specifically run logs, timestamps, and row-level completion rates, is exported directly into your energy management platform. This avoids the manual entry errors that invalidate carbon credit applications.
- Establish Threshold-Based Triggers: Replace calendar-based cleaning with performance-based triggers. Configure your monitoring system to flag blocks that hit a 3% to 5% PR drop. This ensures your cleaning schedule optimization remains focused on high-yield recovery zones rather than arbitrary maintenance dates.
- Audit-Ready Documentation: Compile a monthly performance report that overlays cleaning activity against generation output. Auditors under the CCTS framework will look for the correlation between cleaning interventions and the resulting uptick in energy production; having this data pre-indexed saves months during the validation process.
- Scale via Pilot Blocks: Before scaling a new cleaning technology across your entire 100 MW+ portfolio, run a 5 MW pilot program for one full season. This allows you to calibrate the soiling loss model and estimate accurate carbon credit volumes before making significant, long-term O&M budget commitments.
By treating soiling reduction as a technical energy recovery project rather than a routine service task, you bridge the gap between simple housekeeping and high-value ESG compliance. The data you generate today is the foundation for your plant's long-term sustainability valuation.
Sources and further reading
Frequently asked questions
The calculation involves multiplying the recovered energy yield, measured in MWh through performance ratio improvement, by the regional grid emission factor. This converts the avoided energy loss into tonnes of carbon dioxide equivalent (tCO2e) avoided, which serves as the basis for credit validation.
Yes. By isolating soiling losses from other variables like module degradation and linking performance ratio recovery to documented data, asset managers can integrate these savings into the Carbon Credit Trading Scheme as a measurable ESG asset.
In high-irradiance regions like Rajasthan, reducing annual soiling losses by 6 percent can result in a recovery of approximately 4,500 to 5,500 MWh per annum for a 100MW plant. This level of yield recovery effectively displaces fossil fuel generation and creates tangible carbon value.
Waterless cleaning impacts the project efficiency by maintaining a more consistent performance ratio without the operational delays associated with manual cycles. While the carbon credit value is primarily determined by the MWh recovered and the grid emission factor, waterless methods often provide better data cycles, which are essential for verifying compliance and maximizing reporting accuracy.