Board slides for Indian utility solar often show module degradation curves and availability targets. Few show the steady revenue leak from dust: performance ratio drifting 3% to 7% between cleans while PPA invoices assume higher output. That gap is not abstract industry trivia. It is measurable MWh at ₹3.00 to 4.50/kWh on 25 to 500 MW assets, year after year, when cleaning cadence cannot match soiling rate.
This article reframes soiling as a line-item revenue loss Indian IPPs undercount in models, with calculation steps, illustrative tables, and recovery options grounded in utility operations, not clickbait scale headlines.
Quick answer
- Soiling = PR drift × MWh × tariff between effective cleans.
- Arid Indian utilities often lose 3% to 7% PR in peak dust weeks.
- Manual cycle time often exceeds economic cleaning window.
- Finance models omit gaps; O&M sees volatility without ₹ bridge.
- Fix with frequency, coverage logs, and PR proof, not slogans.
What soiling actually costs on utility balance sheets
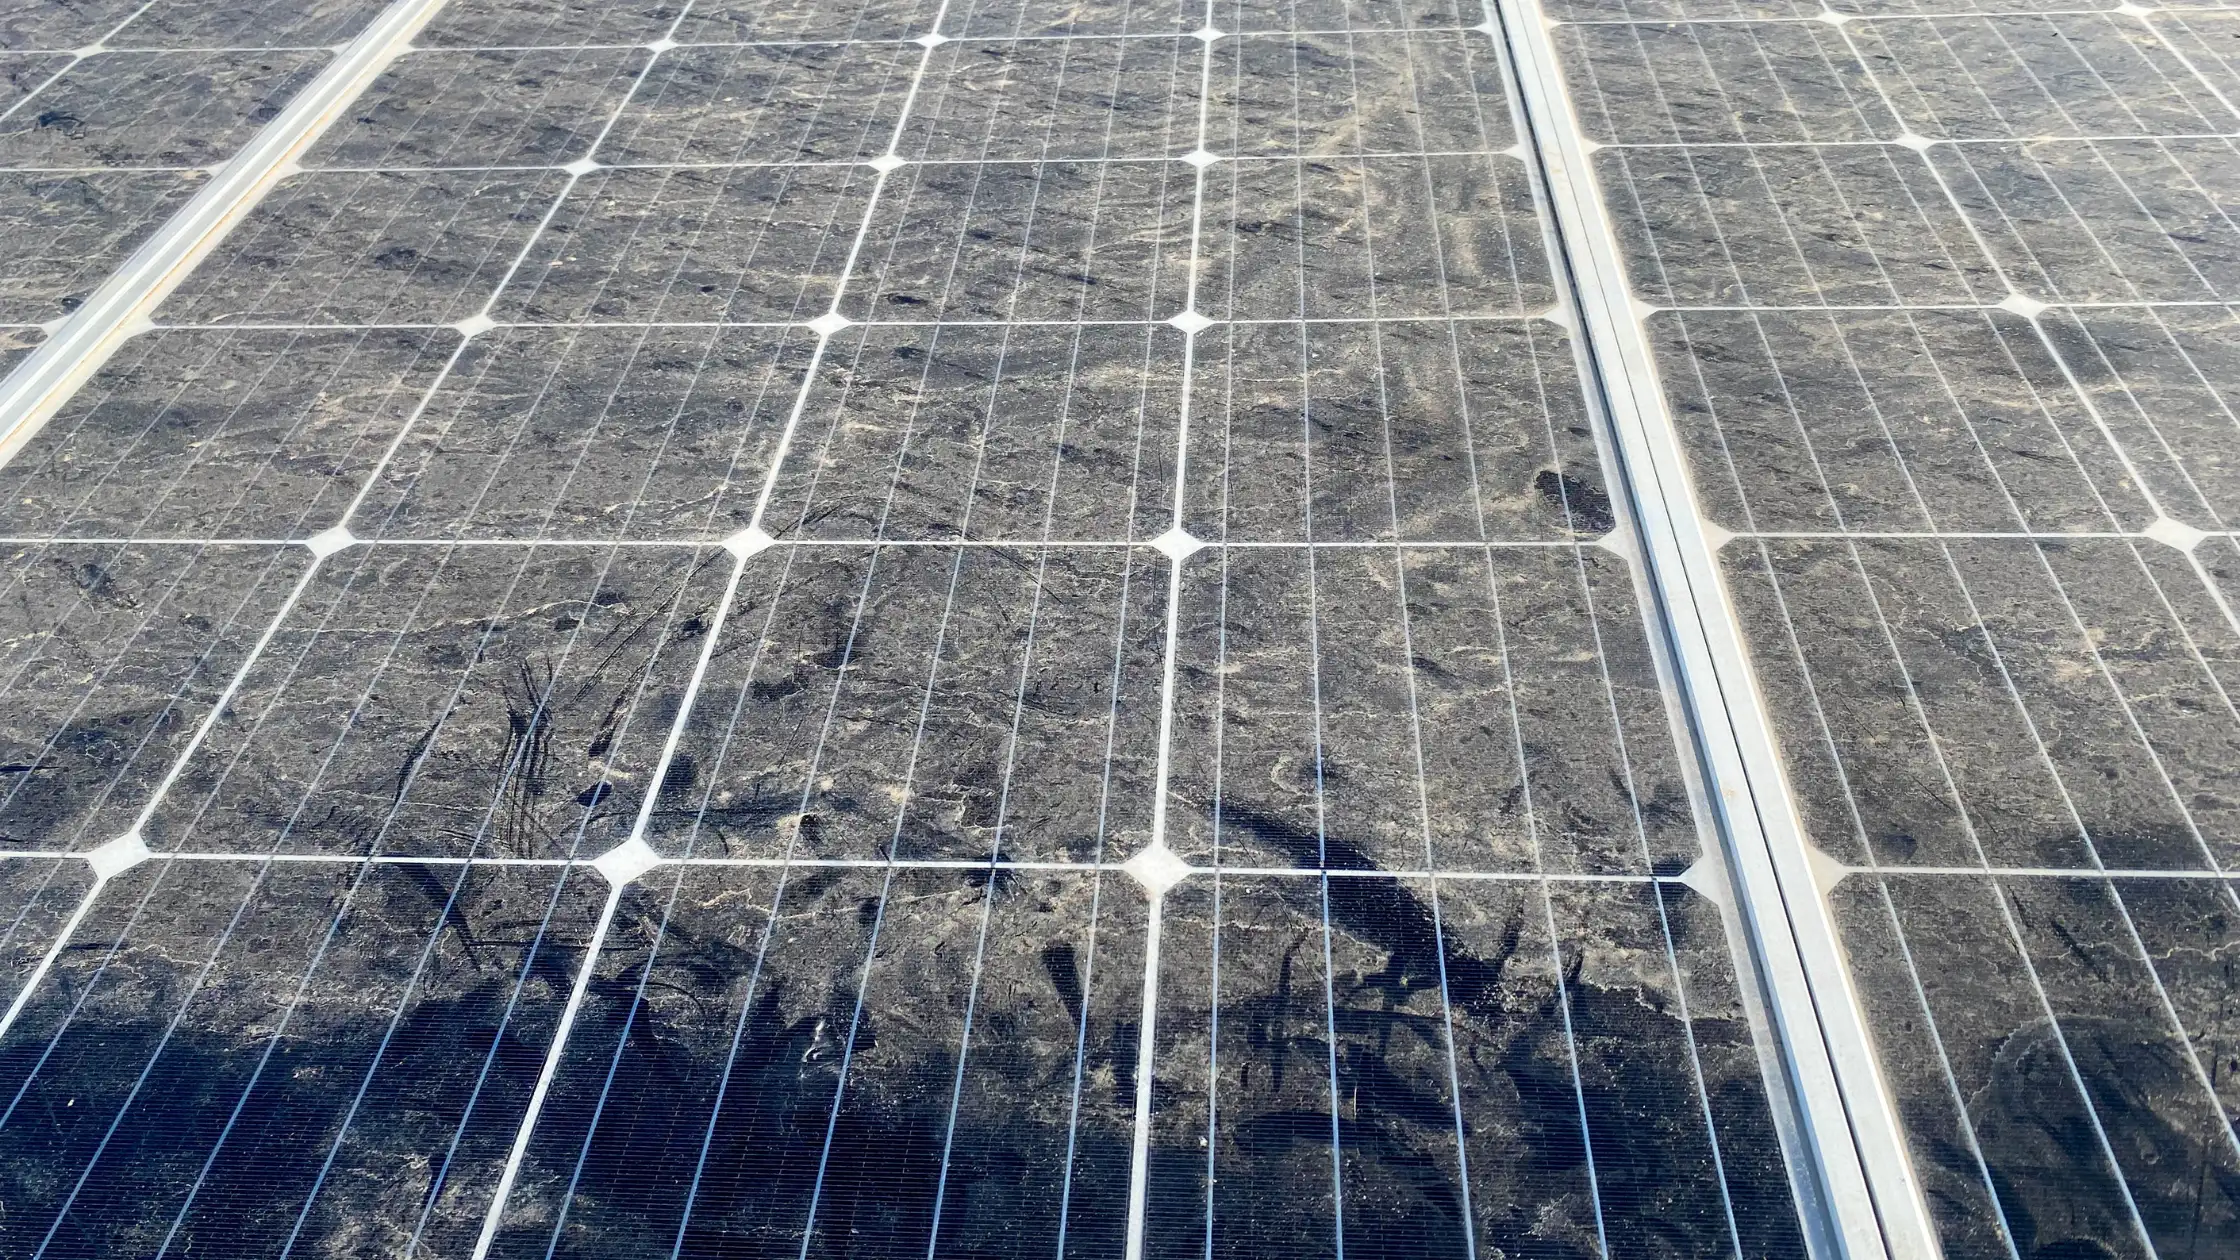
Soiling is not only dirty glass. It is uncaptured energy sold at contract tariff. A 50 MW Rajasthan plant with specific yield 1,600 kWh/kWp nominally targets 80 GWh annually. Sustained 4% PR loss from dust between passes forfeits roughly 3.2 GWh, about ₹1.1 crore at ₹3.50/kWh before escalation. Spread across a 500 MW portfolio, leakage aggregates to material EBITDA drag even without exotic global totals in the headline.
Loss compounds when storms hit and manual mobilization takes 5 to 10 days while soiling accelerates. Each day of delay adds MWh not recovered until the next effective pass.
Illustrative soiling cost table (verify on site)
| Plant size | Avg PR gap (dry season) | Approx annual MWh loss | ₹ at ₹3.50/kWh |
|---|---|---|---|
| 25 MW | 3% | ~1.2 GWh | ~₹42 lakh |
| 50 MW | 4% | ~3.2 GWh | ~₹1.1 crore |
| 100 MW | 5% | ~8.0 GWh | ~₹2.8 crore |
| 200 MW | 4% | ~12.8 GWh | ~₹4.5 crore |
Replace assumptions with your reference modules, tariff, and curtailment-normalized PR. Numbers illustrate structure only.
Why IPPs undercount soiling in IC models
- Financial models use P50 yield without dynamic dust seasonality.
- Manual cleaning budgets assume planned passes, not weather delays.
- Partial row coverage from crews counts as clean in tickets, not in PR data.
- Curtailment and inverter faults mask soiling in blended SCADA views.
- No monthly PR bridge ties cleaning spend to recovered ₹.
Result: O&M fights dust while finance treats cleaning as fixed opex with unclear ROI. Refinancing and technical advisor reviews then surface unexplained PR gaps.
Calculate soiling loss in five steps
- Establish clean baseline PR on reference modules after verified effective clean.
- Track irradiance-normalized PR daily through dust season.
- Integrate average PR gap over days between effective cleans.
- Convert gap to lost MWh on actual or budgeted production volume.
- Multiply by PPA tariff; present annual and monthly ₹ leakage.
Detail PR math in performance ratio calculation guide and how cleaning increases efficiency.
Manual cadence vs soiling rate mismatch
| Region pattern | Typical manual full-plant cycle | Soiling rebound window | Outcome |
|---|---|---|---|
| Western Rajasthan dry season | 10 to 21 days | PR dip visible in 5 to 7 days | Chronic mid-cycle loss |
| Gujarat tracker post-storm | 7 to 14 days mobilize | Sharp 5%+ dip week 1 | Revenue spike loss |
| Maharashtra shoulder humidity | Variable wet/dry | Adhesion after mist | Streak persistence |
Recovery levers that move ₹
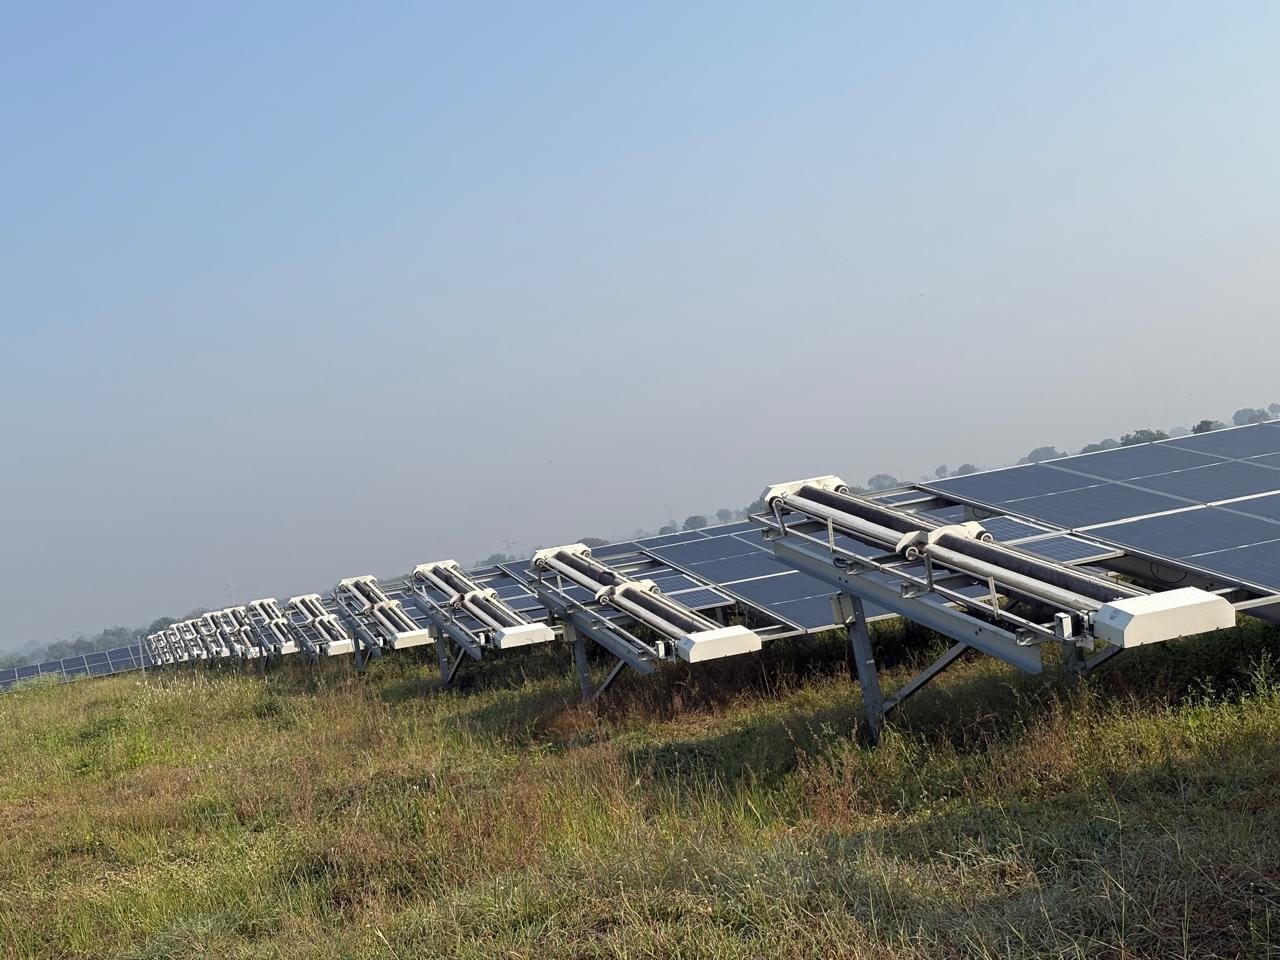
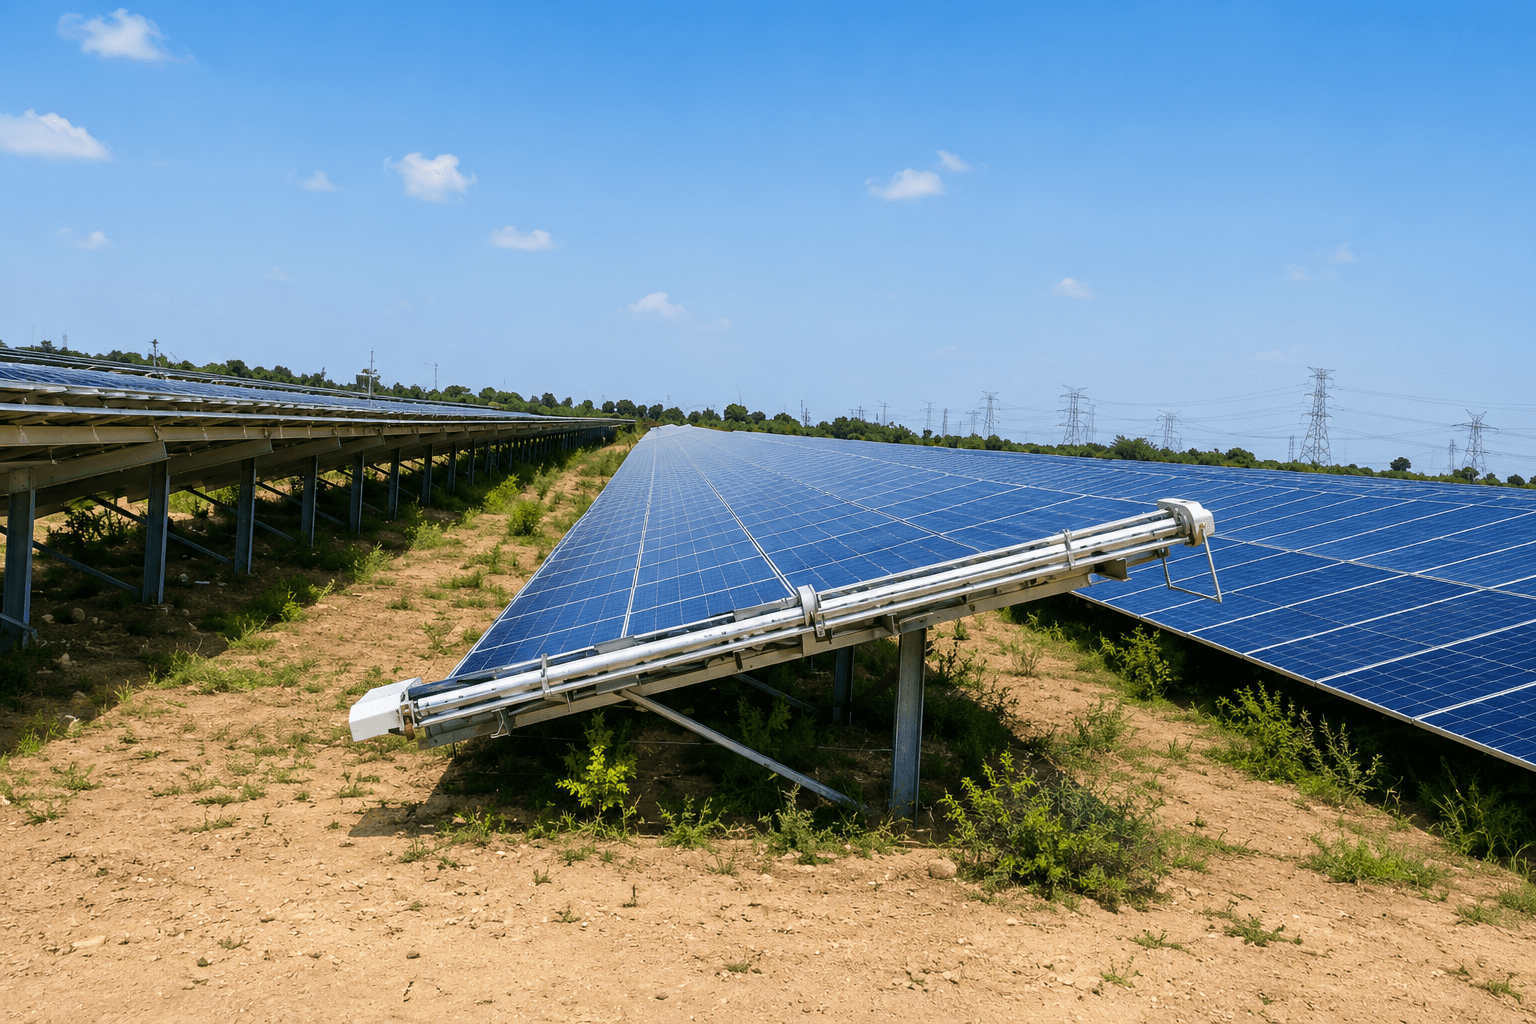
Higher frequency with proof: robots or hybrid programs that hit 5 to 7 day effective coverage on worst blocks. Waterless autonomous passes in water-stressed sites reduce logistics drag that slows manual response. Storm playbooks with pre-positioned crews or fleet surge. Vegetation and drainage fixes for mud splash at row edges. Investor-grade PR bridges monthly.
Compare economics in cleaning cost-benefit analysis India and robotic cleaning ROI.
When soiling loss exceeds cleaning investment
If annual ₹ leakage from sustained 3%+ PR gap exceeds incremental five-year cleaning TCO (manual plus opportunity cost or robot amortization), under-investing is value destruction. Break-even tilt toward robots when water cost rises, rows lengthen, and night cleaning avoids export loss. Mild sites with fast manual cycles and 1 to 2% gaps may rationally defer automation.
What soiling loss is not
Not inverter clipping, tracker fault, grid curtailment, or module degradation alone. Not solved by marketing claims without coverage logs. Not uniform across blocks: prioritize dustiest zones with soiling scores, not calendar parity.
Should a 100 MW IPP put soiling ₹ in every monthly investor pack?
Yes. Show PR bridge with dust season narrative, ₹ at tariff, cleaning passes completed vs deferred, and recovered MWh after storms. Technical advisors and lenders increasingly ask for operational evidence, not headline problems. Quantified soiling cost builds the case for frequency investment robots or enhanced manual hybrid programs.
Portfolio view: aggregating soiling rupees across SPVs
Holding companies with multiple Gujarat and Rajasthan SPVs should sum block-level leakage monthly, not average PR at portfolio level only. One under-cleaned 150 MW asset can drag blended returns while smaller well-maintained sites mask the gap in consolidated dashboards. Assign soiling cost ownership to each SPV manager with cleaning cadence KPIs tied to tariff-weighted MWh.
Sensitivity: tariff and curtailment
| Scenario (100 MW, 5% PR gap) | Approx annual rupee loss |
|---|---|
| ₹3.00/kWh, low curtailment | ~₹2.4 crore |
| ₹3.50/kWh, moderate curtailment normalized | ~₹2.8 crore |
| ₹4.00/kWh, high value off-take | ~₹3.2 crore |
Normalize PR on uncurtailed hours where SCADA allows so cleaning benefit is not hidden inside dispatch loss.
Board questions CFOs should ask O&M
- What was average PR gap between effective cleans last quarter?
- How many block-days missed target coverage and why?
- What rupees did we forfeit at contract tariff from soiling, not curtailment?
- Does cleaning spend recover more rupees than it costs on five-year view?
- Do we have reference module proof or only crew tickets?
Linking soiling loss to cleaning investment decisions
When annual leakage exceeds incremental robot or enhanced manual program TCO, delaying investment destroys value. Run paired scenarios in 10 MW waterless vs manual comparison. Present IC with soiling rupee bridge first, then cleaning TCO, then net recovery. Order matters for approval psychology.
Are ESG reports capturing soiling risk?
Water withdrawal and cleaning frequency appear in more Indian utility sustainability disclosures, but lost MWh from dust often stays out of narrative. Adding quantified soiling impact shows investors operational seriousness and supports capex for autonomous programs without vague green claims.
How do storms amplify soiling cost on utility plants?
Pre-monsoon dust storms can drop PR 5 to 10 percent within 48 hours on exposed blocks. Manual programs waiting for tanker mobilization lose high-value MWh during the first week when irradiance is still strong. Model storm weeks separately in annual soiling loss budgets; average seasonal PR hides spike losses that drive IC frustration.
Robotic surge plans with on-site fleets and documented defer logic after rain reduce both spike duration and module damage risk from forced damp dry passes.
Include soiling loss line in annual budget reforecast cycles, not only at commissioning when dust assumptions are theoretical.
Key takeaways
- Soiling is measurable ₹ leakage at PPA tariff on Indian utility plants.
- Peak dry-season PR gaps of 3% to 7% are common in arid belts.
- Financial models fail when cleaning gaps are invisible.
- Calculate MWh loss with reference modules and PR bridges.
- Recover with frequency, coverage proof, and site-specific economics.
Related resources
Frequently asked questions
Highly site-specific. Arid utility sites often see 3% to 7% performance ratio gap between cleans in peak dust season, worth lakhs to crores annually depending on MW and PPA tariff. A 100 MW plant at ₹3.50/kWh losing 4% average PR may forfeit roughly ₹1.4 to 1.8 crore per year if cleaning cadence cannot keep pace.
Models use nameplate yield and generic degradation, not block-level dust curves. Manual cleaning gaps, storm delays, and partial coverage are omitted. Finance sees smooth budget lines while O&M fights PR volatility without ₹ bridge to investors.
Estimate baseline PR on clean reference modules, measure average PR drift between effective cleans, convert lost percentage to MWh using irradiance-normalized production, multiply by PPA tariff. Include curtailment-normalized hours where SCADA allows.
When full-plant manual cycle time exceeds economic soiling window (often 7 to 14 days in western India dry season) and tariff exceeds roughly ₹3.00/kWh. Water logistics and labour spikes after storms widen the gap further.
Higher cleaning frequency with documented coverage, waterless robots for dry dust belts, storm surge plans, vegetation control for mud splash, and PR bridges in monthly investor packs. No single product fixes inverter faults or curtailment masked as soiling.