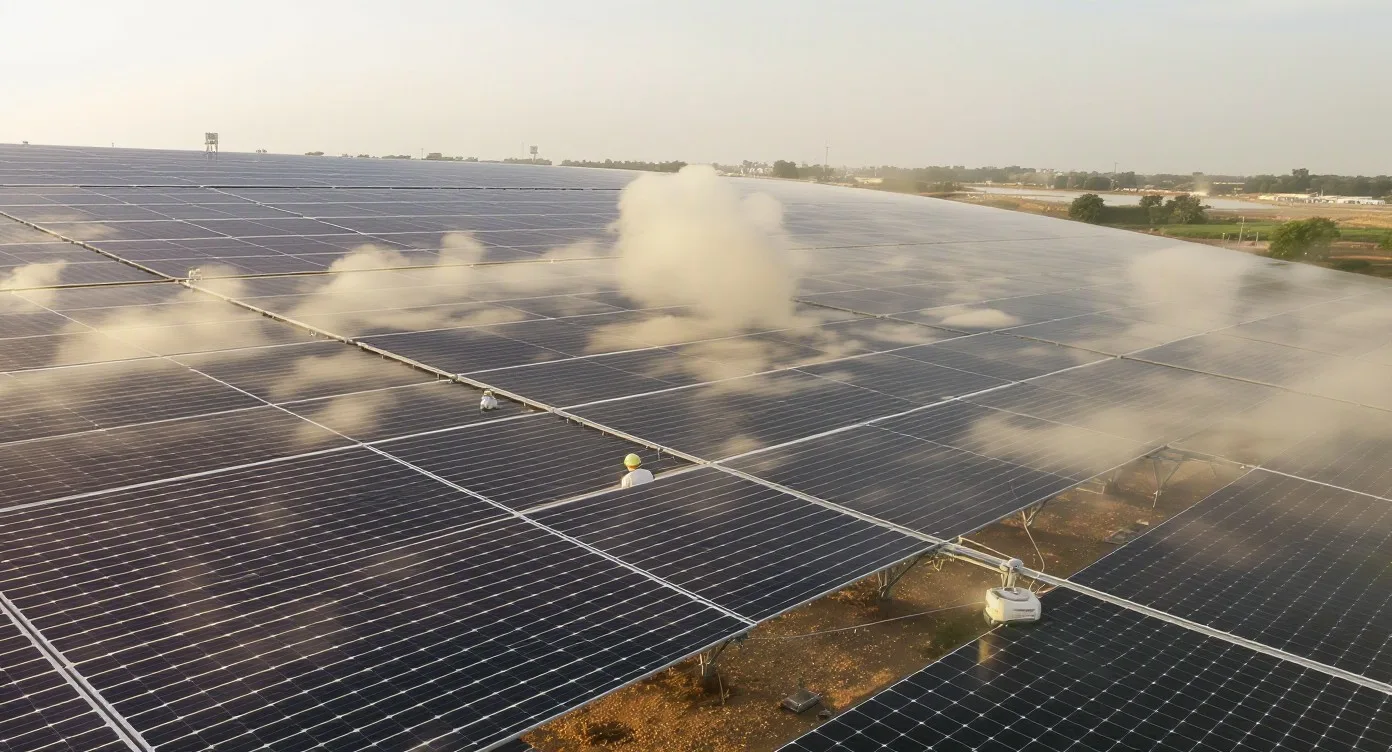

Quick answer
In the high-temperature environment of Indian solar utility plants, summer operations face a dual challenge: thermal efficiency degradation and intensified soiling. Maintaining plant uptime requires balancing standard temperature coefficient losses with the significant revenue drops caused by dust accumulation in regions like Rajasthan and Gujarat.
- Thermal efficiency loss: Modules typically experience 0.3% to 0.5% efficiency degradation for every degree Celsius rise above 25°C.
- Summer soiling loss: Utility-scale sites often report energy yield losses between 5% and 30% in arid Indian zones during dry summer months.
- Cleaning threshold: Asset managers should trigger cleaning operations when soiling-induced performance ratio (PR) loss exceeds 2% to 3%.
- Water savings: Transitioning to automated, waterless cleaning systems offers a potential 90% reduction in water use compared to traditional wet-wash methods.
For more insights on how these metrics influence long-term asset health, see our guide on optimal cleaning frequency for utility plants. Understanding the financial impact of these losses is also critical, as detailed in our analysis of soiling-related revenue leaks that many IPPs currently undercount.
The Thermal Impact: Understanding Temperature Coefficients in Summer
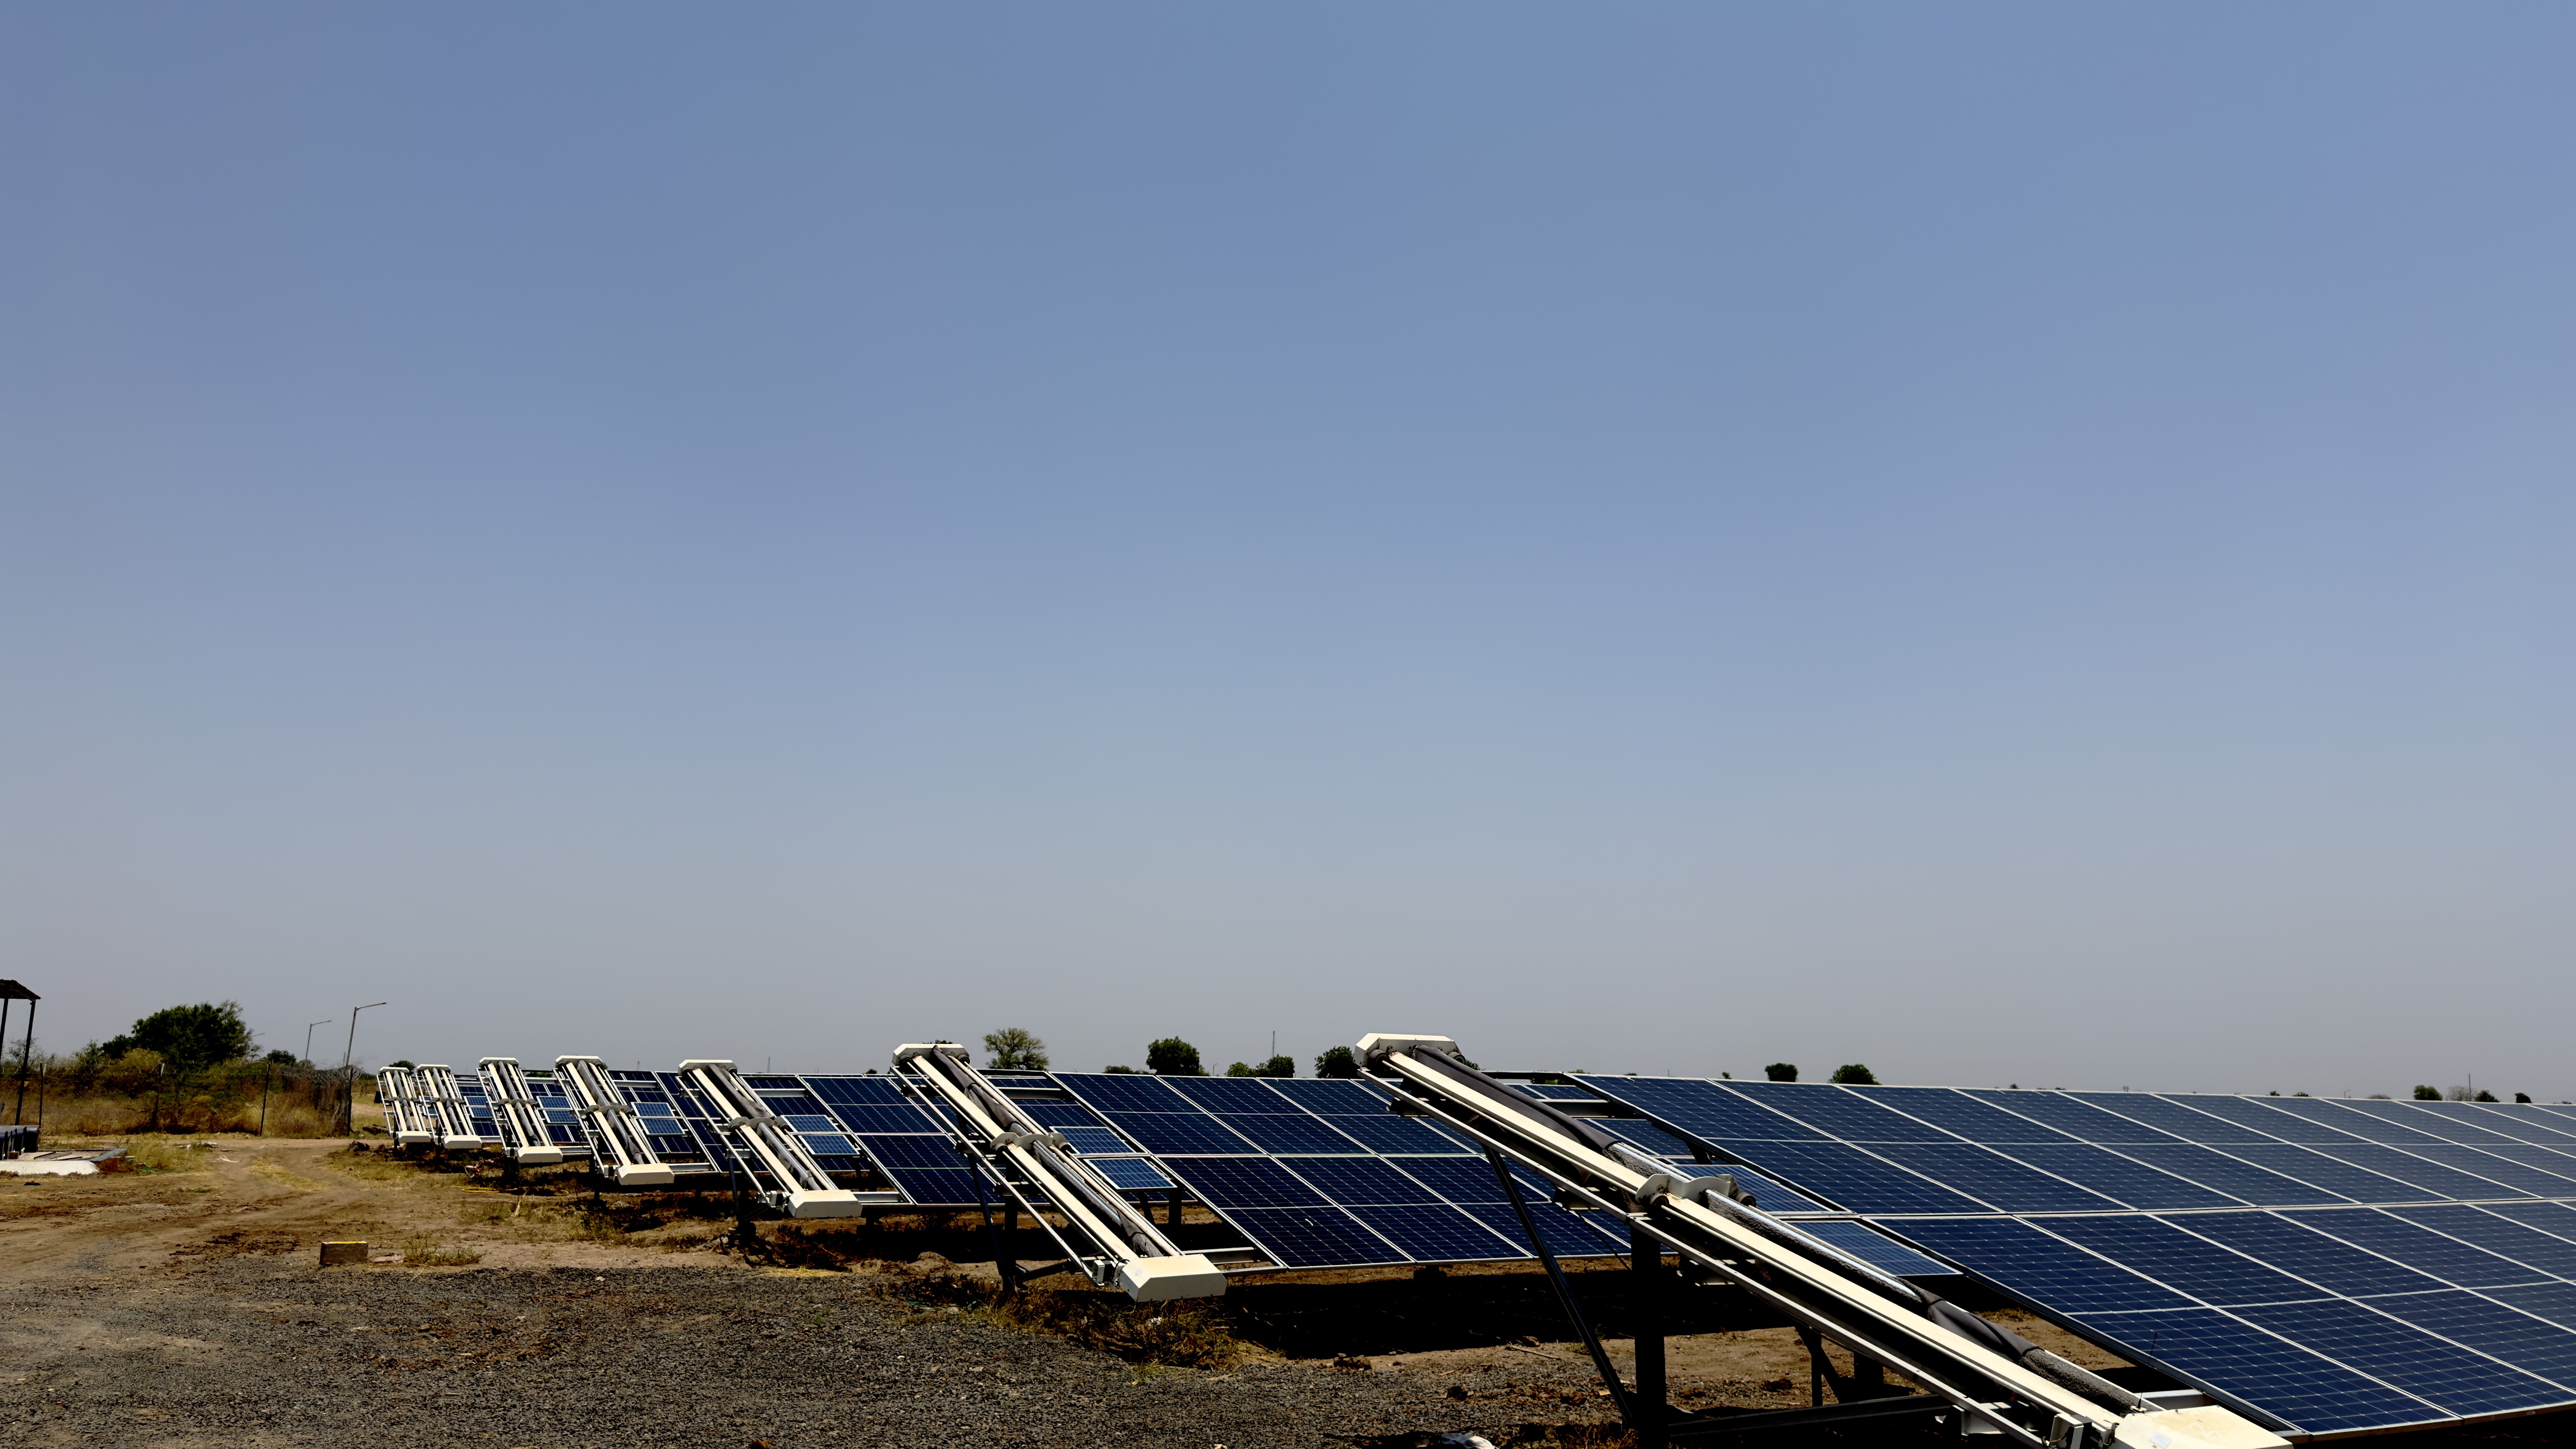
In the intense heat of an Indian summer, module efficiency is dictated by the temperature coefficient of the solar cells. Standard PV module specifications typically indicate a power degradation of 0.3% to 0.5% for every degree Celsius rise above 25°C. When ambient temperatures in states like Rajasthan soar past 45°C, module surface temperatures frequently exceed 70°C. This thermal stress causes a significant drop in maximum power output before sunlight even touches the cells.
While this thermal loss is an inherent physical property of silicon-based modules, it fundamentally alters your O&M calculus. During peak summer, the revenue loss from dust-induced soiling acts as a multiplier on top of these thermal losses. A module operating at reduced efficiency due to heat is even more sensitive to shading and dust, as the voltage drop across soiled cells further destabilizes the string performance. Effectively managing this heat-soiling synergy requires precise monitoring of the Performance Ratio (PR) to distinguish between unavoidable thermal degradation and preventable cleaning losses.
For operations teams, this means that the typical summer cleaning schedule must be far more dynamic than a winter or monsoon protocol. Because the modules are already underperforming due to temperature, failing to remove dust creates a compounding effect that can slash daily energy yields by 10% to 15% more than in cooler months. Operators should consult our detailed analysis on soiling-related revenue leaks to see how to isolate these variables in their SCADA performance reports.
Summer Soiling Dynamics in India's Semi-Arid Regions
In the arid landscapes of Rajasthan and Gujarat, the summer season represents the most challenging operational period for solar asset managers. Unlike monsoon periods where rainfall provides natural module surface maintenance, the extreme heat of summer creates high atmospheric dust concentration and frequent dust storms. This particulate matter, ranging from fine silt to coarse sand, settles rapidly on glass surfaces and significantly reduces sunlight transmission to the cells.
Utility-scale operators in these regions must distinguish between background soil accumulation and episodic dust events. Industry-observed data indicates that solar plants in high-dust corridors can experience generation losses ranging from 5% to 30% during the peak summer months if cleaning cycles are not adjusted. High temperatures exacerbate this decline; as cell efficiency drops due to thermal coefficients, any additional obstruction from accumulated dust forces string voltage deviations that further suppress the plant's overall performance ratio (PR).
For MW-scale sites, this implies that static cleaning schedules are insufficient. Instead, O&M teams should deploy localized sensors that measure real-time soiling degradation rather than relying on time-based intervals. Understanding how regional dust composition correlates with specific site geometry is essential for maintaining output during the high-irradiance window of March to June. As the demand for reliable energy grows, optimizing cleaning schedules to counteract this seasonal soiling is a critical lever for protecting project IRR, as discussed in our guide on optimal cleaning frequency for utility plants.
Advertisement
How does summer heat impact panel efficiency and cleaning requirements?
Extreme summer heat creates a paradox for utility-scale solar operators in India. While high irradiance levels during the day offer the potential for peak energy generation, the associated rise in ambient temperature triggers a direct reduction in the voltage performance of silicon-based modules. This thermal derating is an inevitable physics-based constraint, but it significantly magnifies the impact of soiling.
When dust layers accumulate on a hot module, they trap thermal energy, further elevating the local surface temperature. This compounding heat cycle forces string voltage downward, often resulting in larger performance losses than simple shading models predict. For an operator, this means that your summer cleaning requirements are not just about light transmission; they are about cooling and thermal mitigation.
The compounding effect of heat and dust
- Thermal Derating: Modules typically lose 0.3% to 0.5% of peak power for every degree Celsius above 25°C. In states like Rajasthan, surface temperatures regularly hit 70°C, cutting output significantly before dust enters the equation.
- Reduced Cooling Potential: A layer of dust acts as an insulating blanket. This reduces the heat dissipation rate of the glass surface, pushing cell temperatures even higher and deepening the efficiency deficit.
- Voltage Instability: Soiled, overheated cells can cause uneven voltage drops across a string. On tracker-based systems, this inconsistency often leads to mismatched current and triggers premature inverter derating.
By keeping the module surface clean, you allow for better natural airflow and heat dissipation across the glass. This simple physical intervention helps your plant operate closer to its rated temperature coefficient throughout the hottest months. Integrating this logic into your O&M planning is a core component of maximizing PR, as highlighted in our technical guide on soiling-related revenue leaks. For plants operating at a scale of 50 MW or more, a shift to automated, frequent dry cleaning is often the only way to manage this heat-soiling synergy without triggering the high water costs and operational delays associated with manual washing teams.
Technical Implementation: Setting Soiling Thresholds for MW-Scale Plants
For utility-scale assets in India, static cleaning schedules are a source of hidden revenue loss. Instead of cleaning on a fixed calendar basis, operators should implement data-driven triggers based on real-time performance ratio (PR) degradation. A standard approach involves establishing a baseline PR during peak performance hours and setting a deviation threshold, typically between 2% and 3%, to trigger a cleaning cycle. Once the actual plant PR dips below this threshold due to dust accumulation, the system initiates the cleaning sequence.
Integrating this threshold logic requires reliable telemetry from local weather stations and SCADA systems. In semi-arid regions such as Rajasthan or Gujarat, where dust deposition is non-linear and subject to wind-driven storm events, the trigger frequency must be dynamic. By deploying automated cleaning systems, you can achieve granular control that matches the rate of soiling. For plants exceeding 10 MW, this approach effectively minimizes the time modules spend below their optimal output, directly protecting the project IRR.
Data-driven threshold parameters
- Baseline Deviation: Aim for a 2% to 3% drop in PR as the primary trigger for a cleaning cycle.
- Sensor Calibration: Ensure local pyranometers and reference cells are cleaned regularly to avoid data skewing.
- Regional Variance: Use higher trigger sensitivity during the March to June dust season compared to the monsoon period.
- String Monitoring: Aggregate current data from string combiners to verify if degradation is localized to specific table rows or across the entire plant block.
Using predictive maintenance software, such as the NECTYR fleet portal, allows operations teams to visualize these soiling trends across a portfolio. By separating module degradation from actual soiling losses, as outlined in our guide on separating performance metrics, you ensure that cleaning resources are deployed only when they provide a measurable gain in energy yield.
Mitigating Water Scarcity: Comparing Cleaning Methodologies
In water-stressed regions like Rajasthan and Gujarat, relying on traditional wet washing is increasingly untenable for utility-scale O&M. Manual water-based cleaning consumes significant volumes of water per cleaning cycle, often exceeding 1.5 to 2 litres per module for every wash. For a 50 MW plant, a single deep-cleaning cycle can drain tens of thousands of litres of water, which is often sourced from expensive tankers or depleting local borewells. This logistical burden creates a fragile supply chain where water scarcity forces operators to extend cleaning intervals, directly resulting in higher soiling-related revenue leaks.
Dry cleaning methodologies, including robotic systems using microfiber or specialized brushes, eliminate this dependency while protecting modules from abrasive water-based scouring. When evaluating methods for your plant, consider the following comparison of industry-typical approaches for 10 MW+ scale installations:
| Cleaning Method | Water Usage | Labour Intensity | Operational Impact |
|---|---|---|---|
| Manual Water Wash | High (1.5–2L/module) | Very High | Significant downtime; high Opex; risk of hard-water scaling |
| Semi-Auto Brushes | None | Moderate | Requires personnel for transport; inconsistent edge cleaning |
| Autonomous Robotics | Zero | Minimal | High consistency; real-time PR monitoring; lower long-term LCOE |
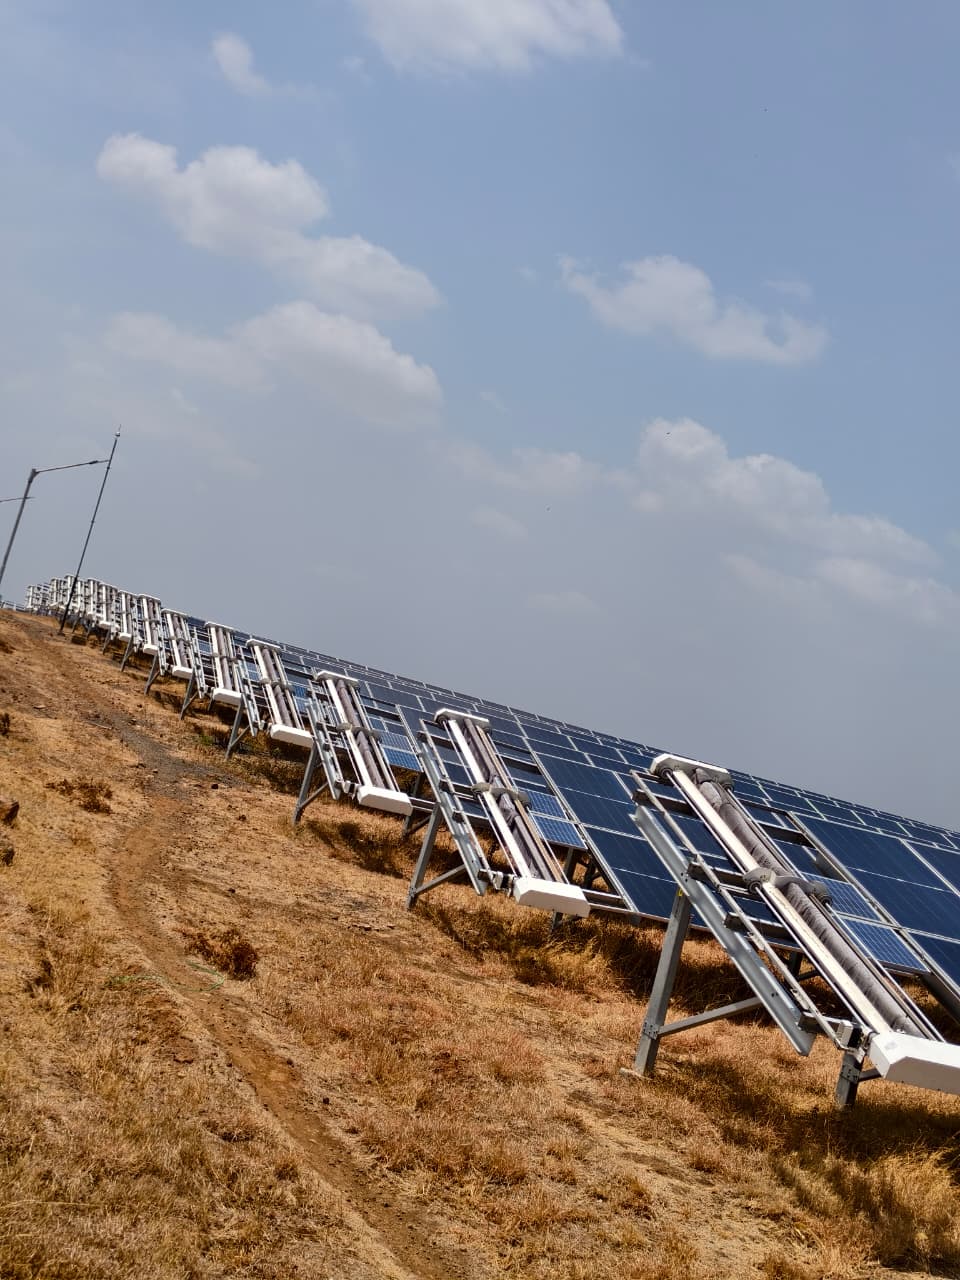
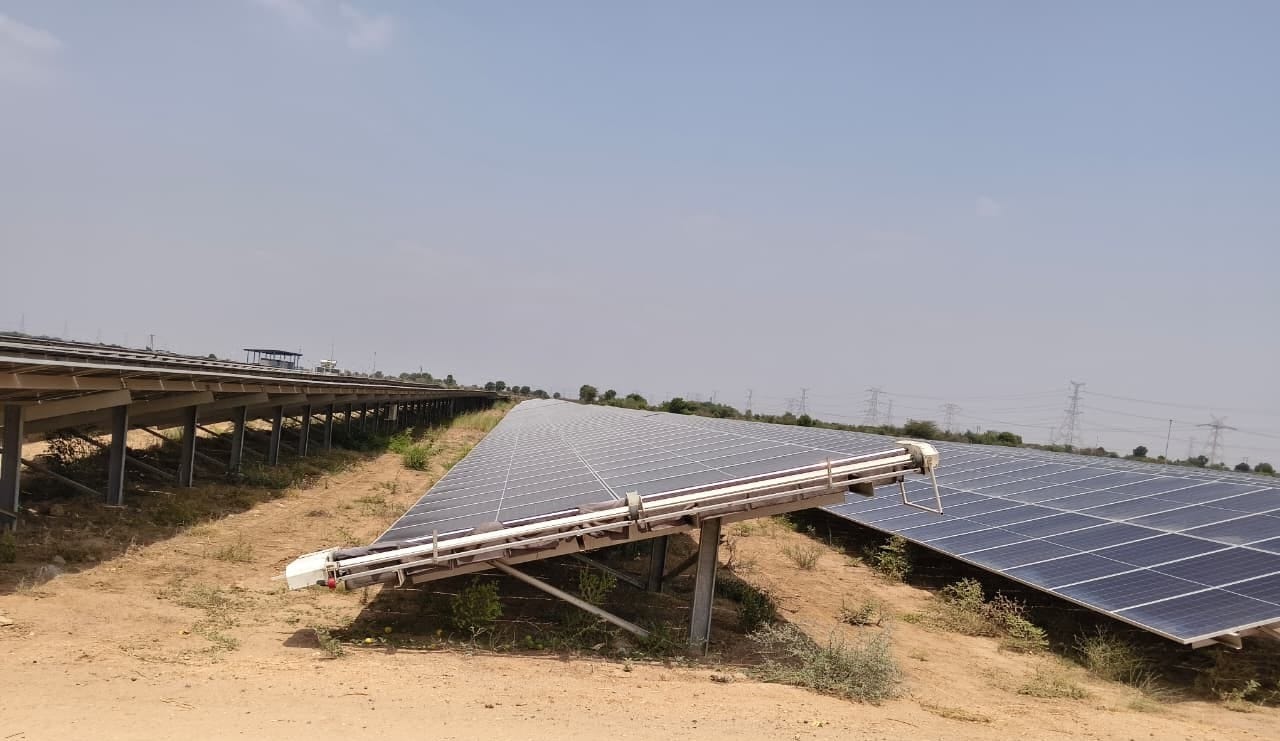
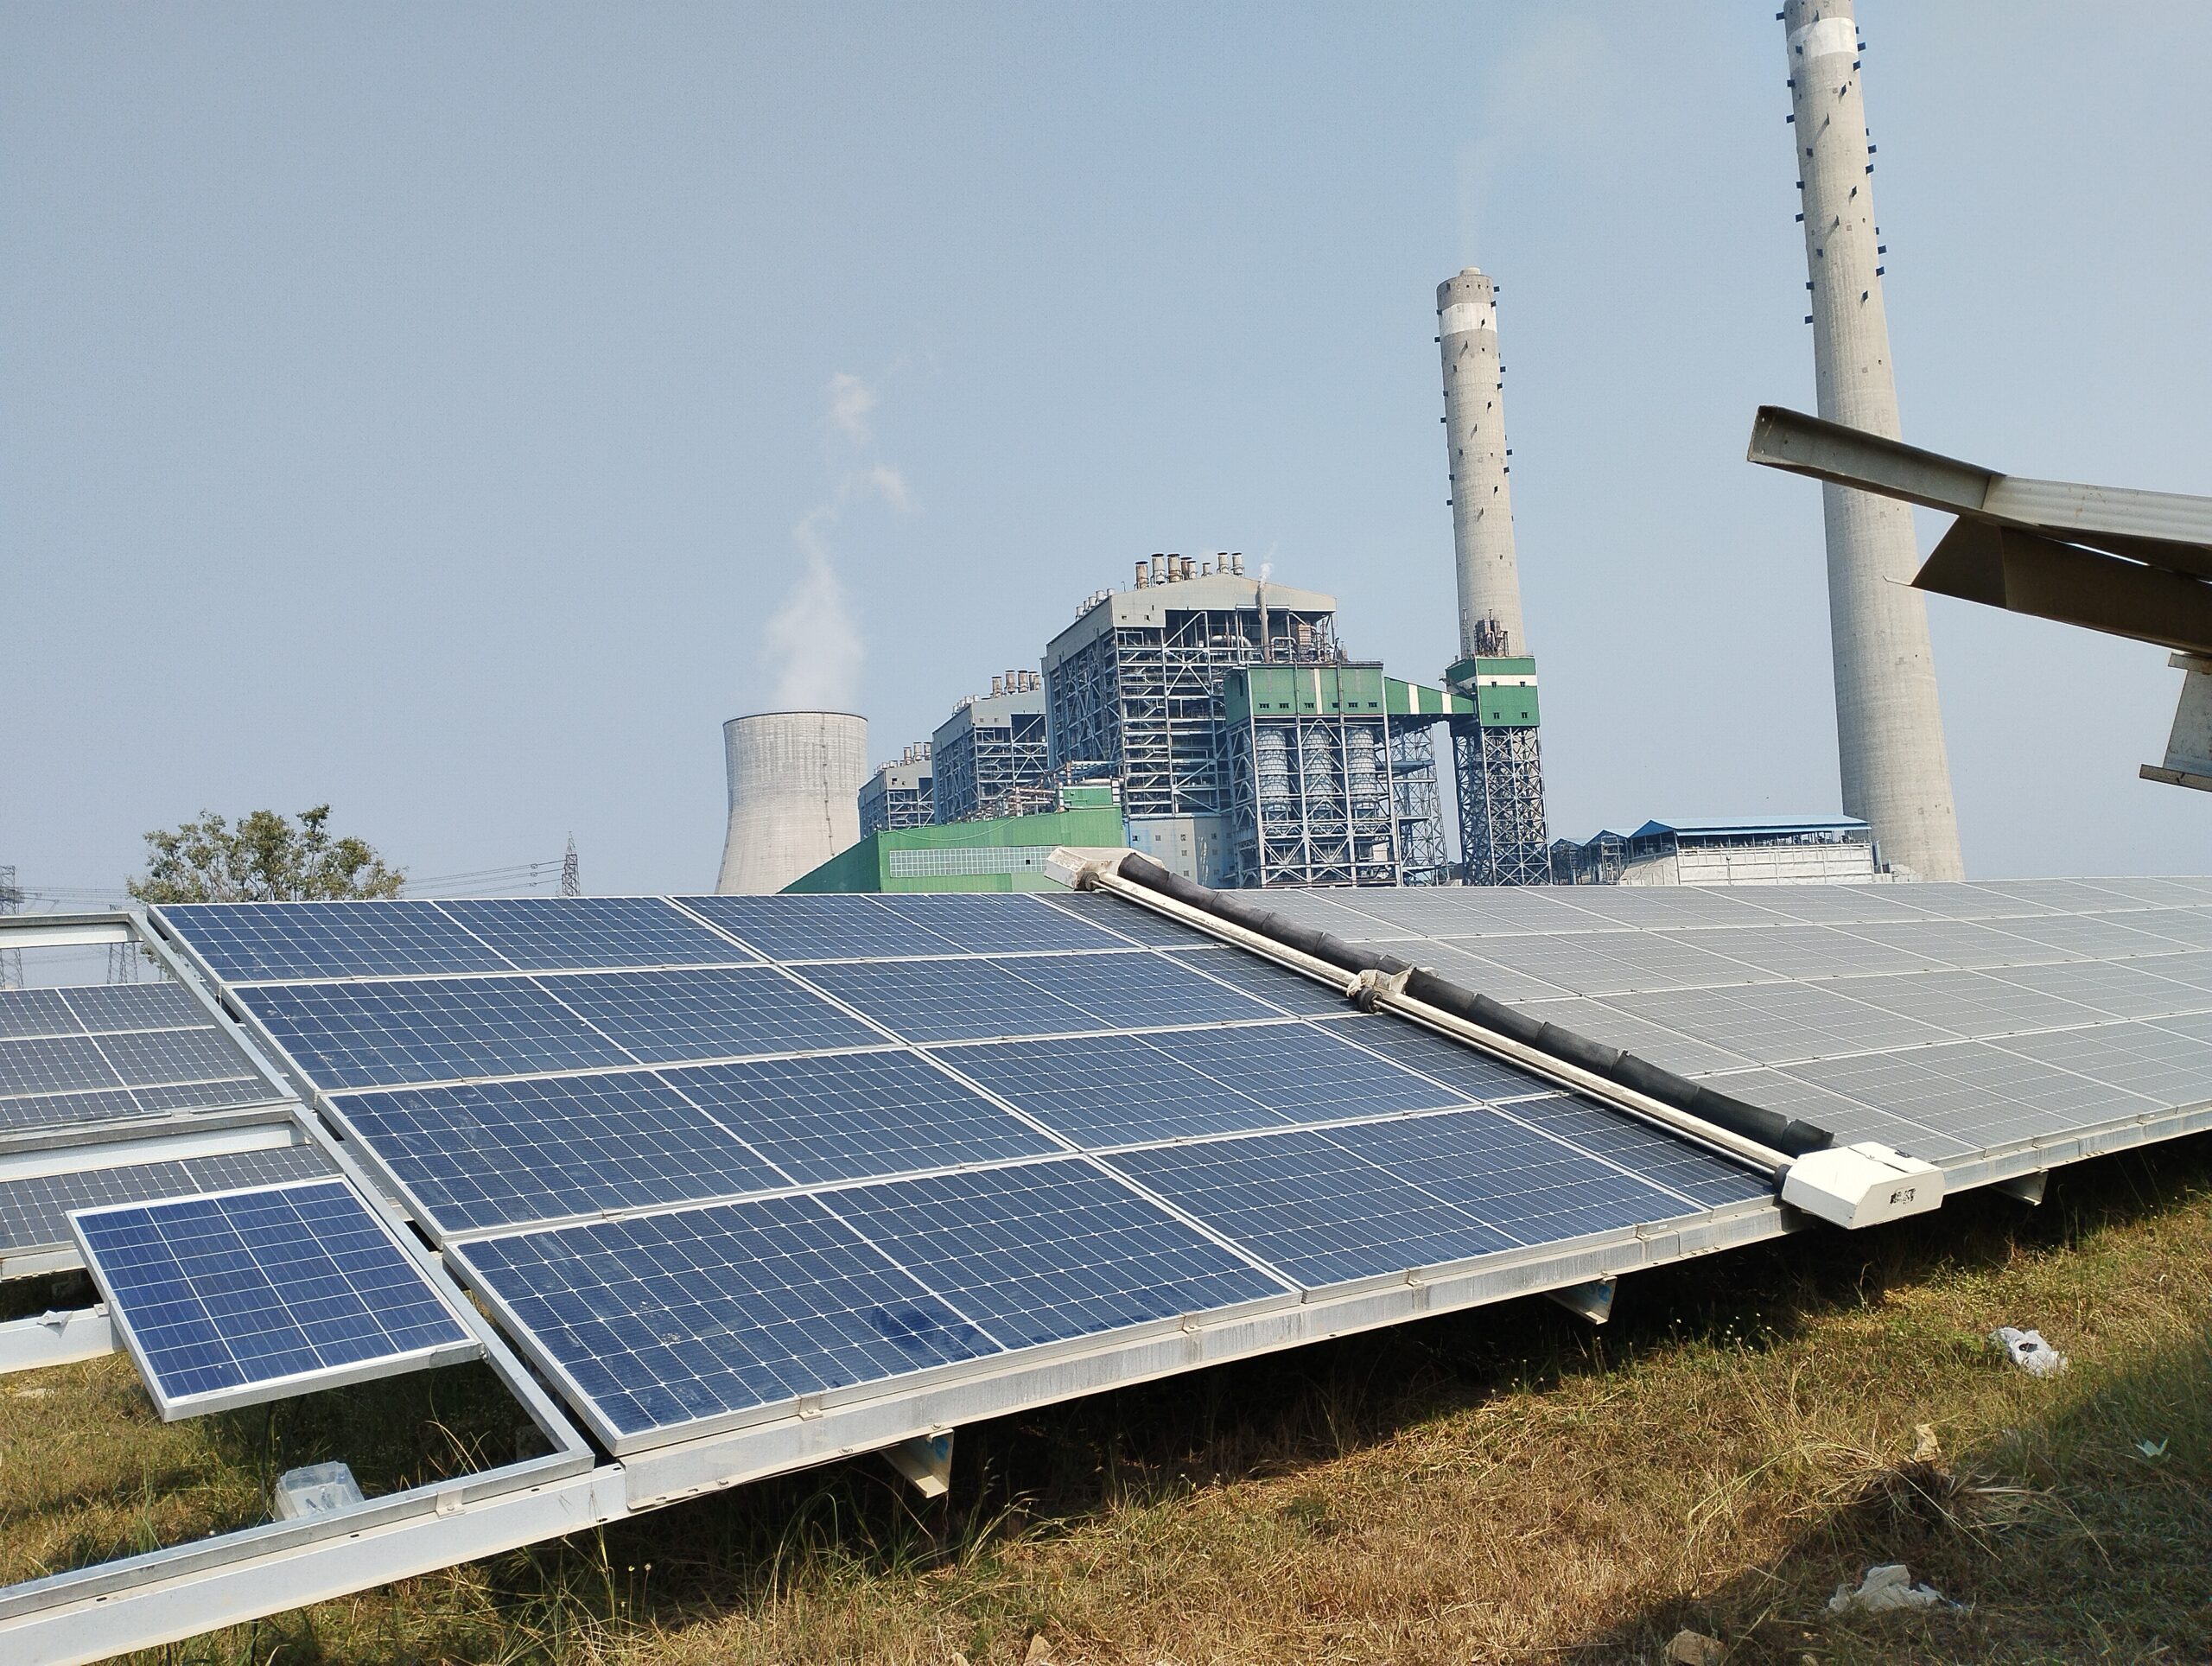
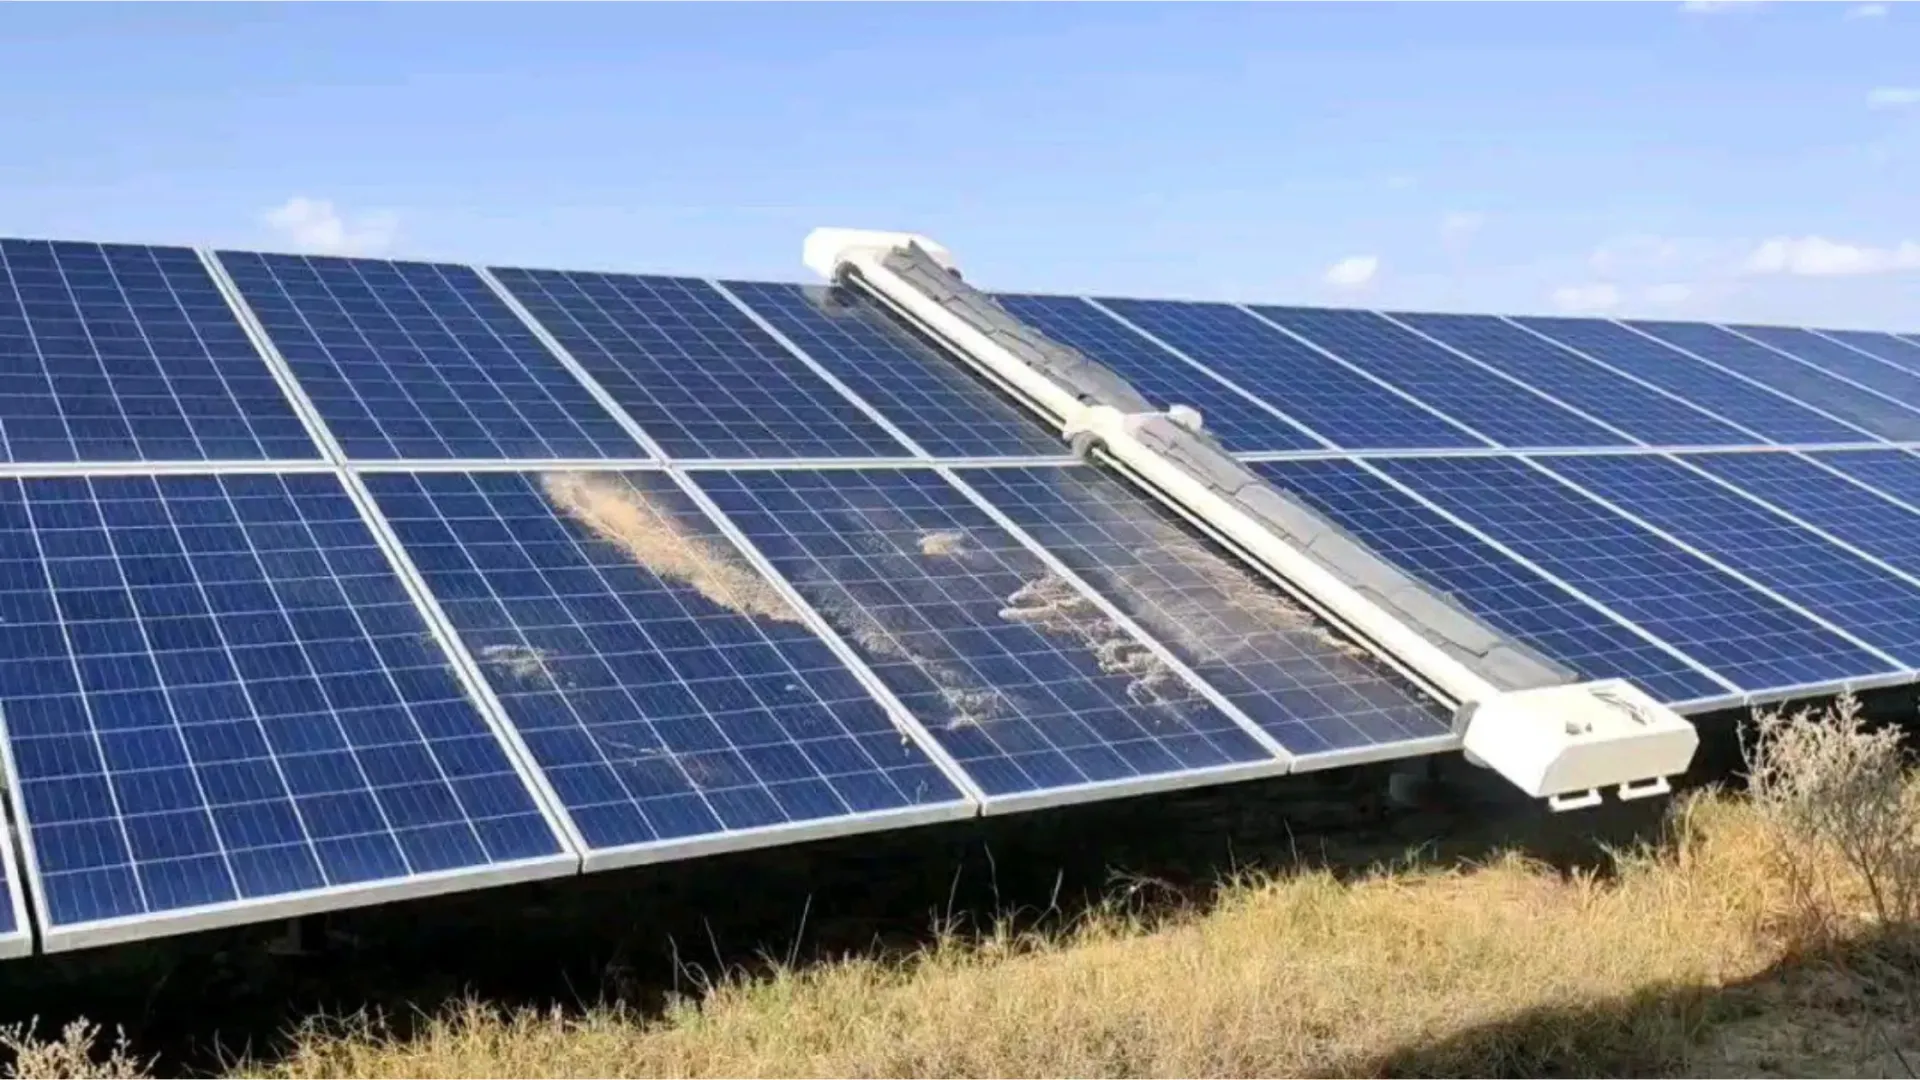
Autonomous robotic systems, such as the GLYDE dual-pass airflow and microfiber platform, enable frequent cleaning without adding to the plant headcount. By automating the cleaning process, operators can execute daily or weekly cycles during low-generation hours to ensure that modules remain free of dust-induced hotspots. This shift to dry, automated cleaning preserves the long-term integrity of the module’s anti-reflective coating and prevents the water-related scaling issues often seen in mineral-heavy groundwater areas. Beyond the immediate water savings, which can reach up to 90% in large-scale deployments, robotic cleaning provides a predictable cost structure that is independent of local water shortages or seasonal droughts. As you optimize your site O&M, it is essential to align your cleaning method with your specific site geography and water availability metrics to minimize your long-term operational costs.
Impact on Plant Performance Ratio (PR) and LCOE
Extreme summer heat combined with accumulated soiling creates a dual-threat to plant Performance Ratio. High ambient temperatures force modules toward their upper thermal limits, where efficiency drops by approximately 0.3% to 0.5% per degree Celsius above 25°C. When thick layers of dust act as a thermal blanket, they trap heat against the glass surface, accelerating degradation and reducing the efficiency of power conversion. In utility-scale plants across Rajasthan or Gujarat, neglecting cleaning during the peak summer months can result in a drop in PR of 5% to 15%, depending on the soiling load and local humidity conditions.
This performance loss translates directly into higher Levelized Cost of Energy (LCOE) figures. Because LCOE is the quotient of lifetime costs over energy generation, every MWh of revenue lost to soiling increases the cost burden per unit of power. When O&M teams rely on infrequent, manual interventions, the cost of generation remains volatile due to inconsistent cleaning cycles and the high cost of manual labour. Implementing frequent, automated dry cleaning stabilizes the PR curve by removing dust before it hardens or creates significant shading. This consistency reduces generation volatility and allows asset managers to predict yields with higher accuracy, directly optimizing the long-term ROI of the project.
What plant managers should do next
- Audit your current cleaning schedule against regional dust storm data to move from calendar-based to condition-based maintenance.
- Assess your plant geography for water availability; if your site relies on expensive water trucking, evaluate switching to autonomous, waterless cleaning to cut OPEX.
- Integrate string-level current monitoring with a centralized fleet management system like NECTYR to identify specific rows that require priority cleaning before hot spots develop.
- Review module warranty terms to ensure that your chosen cleaning method, whether manual or robotic, adheres to manufacturer guidelines for surface treatment.
- Consider an OPEX-based cleaning model to shift CAPEX risk and secure fixed-price cleaning cycles that protect generation during the most intense summer heat months.
Sources and further reading
Frequently asked questions
In the high-temperature environment of Indian solar utility plants, summer operations face a dual challenge: thermal efficiency degradation and intensified soiling. Maintaining plant uptime requires balancing standard temperature coefficient losses with the significant revenue drops caused by dust accumulation in regions like Rajasthan and Gujarat.
Most silicon-based solar modules have a temperature coefficient that results in a power output drop of 0.3% to 0.5% per degree Celsius rise above the standard testing temperature of 25°C.
Asset managers should initiate cleaning cycles whenever the performance ratio loss due to soiling exceeds 2% to 3% to ensure optimal yield during peak summer months.
Yes, automated waterless cleaning systems can effectively manage dust accumulation while providing up to a 90% reduction in water consumption compared to traditional wet-wash methods, which is critical for maintenance in water-scarce arid zones.