Quick answer
Separating module degradation from soiling loss requires tracking your daily Performance Ratio (PR) against local weather and site-specific soiling thresholds. Degradation is a permanent, irreversible decline in module output, while soiling is a temporary loss caused by particulate accumulation. Operators can differentiate the two by monitoring PR recovery patterns immediately after a cleaning cycle or a heavy rainfall event.
- Typical annual degradation for mono-crystalline modules is 0.5%–0.7%.
- Soiling loss in arid Indian regions causes 5%–15% monthly PR variance.
- Monitor overnight or post-cleaning PR recovery to verify if the loss is reversible.
- Implement automated cleaning if daily soiling accumulation exceeds 0.2% PR decay.
If your PR returns to your baseline post-cleaning, the issue is transient soiling. If the PR remains permanently lower than the expected year-over-year degradation curve, your plant may be experiencing early-stage module degradation or other system-level faults. For large-scale assets, distinguishing these trends is critical for maintaining PPA generation guarantees and optimizing O&M spend. For more on optimizing cleaning schedules to protect your investment, see our insights on smart postpone triggers and regional cleaning strategies.
The technical challenge of isolating soiling loss
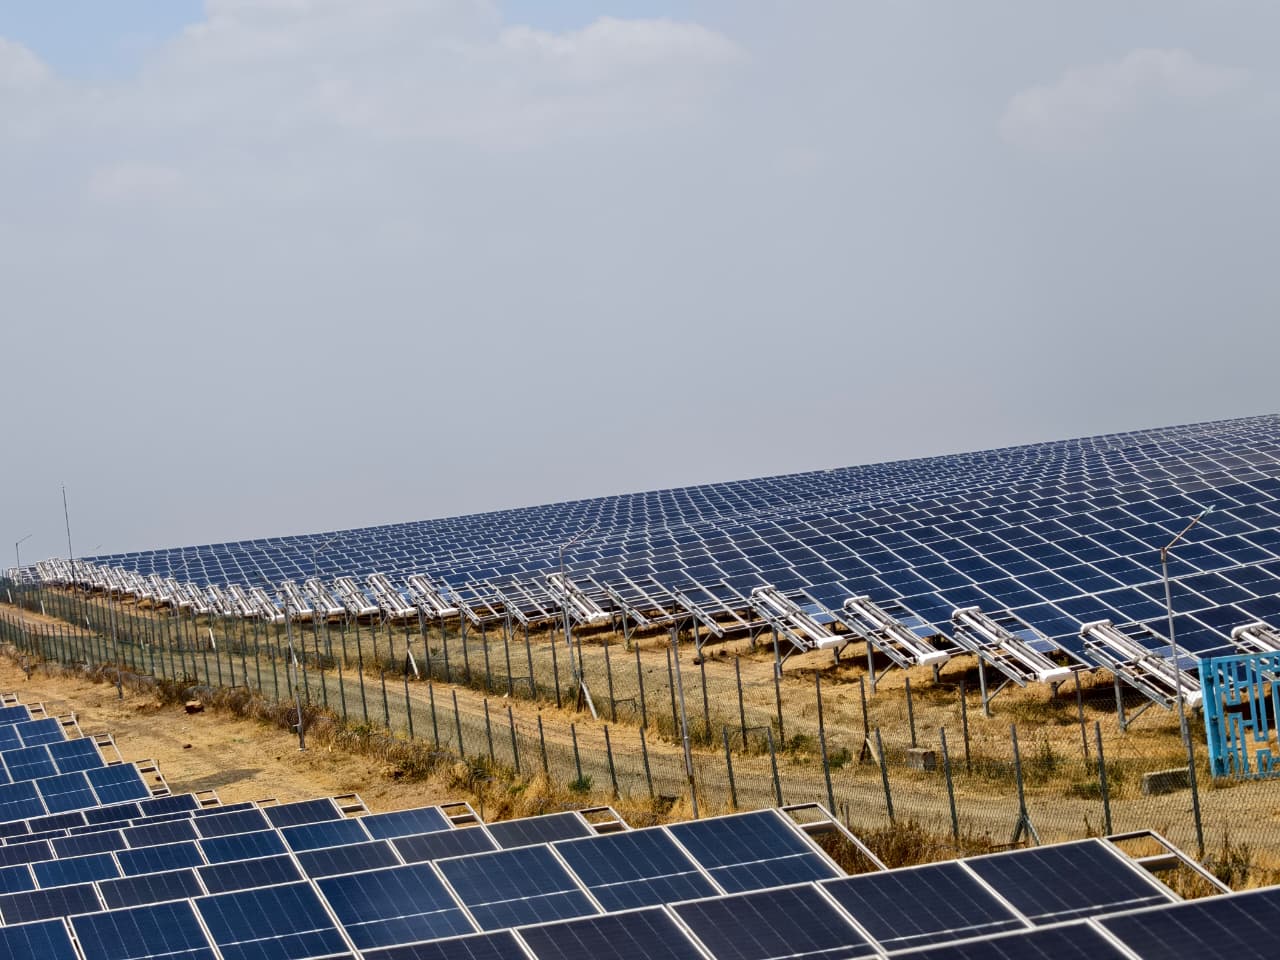
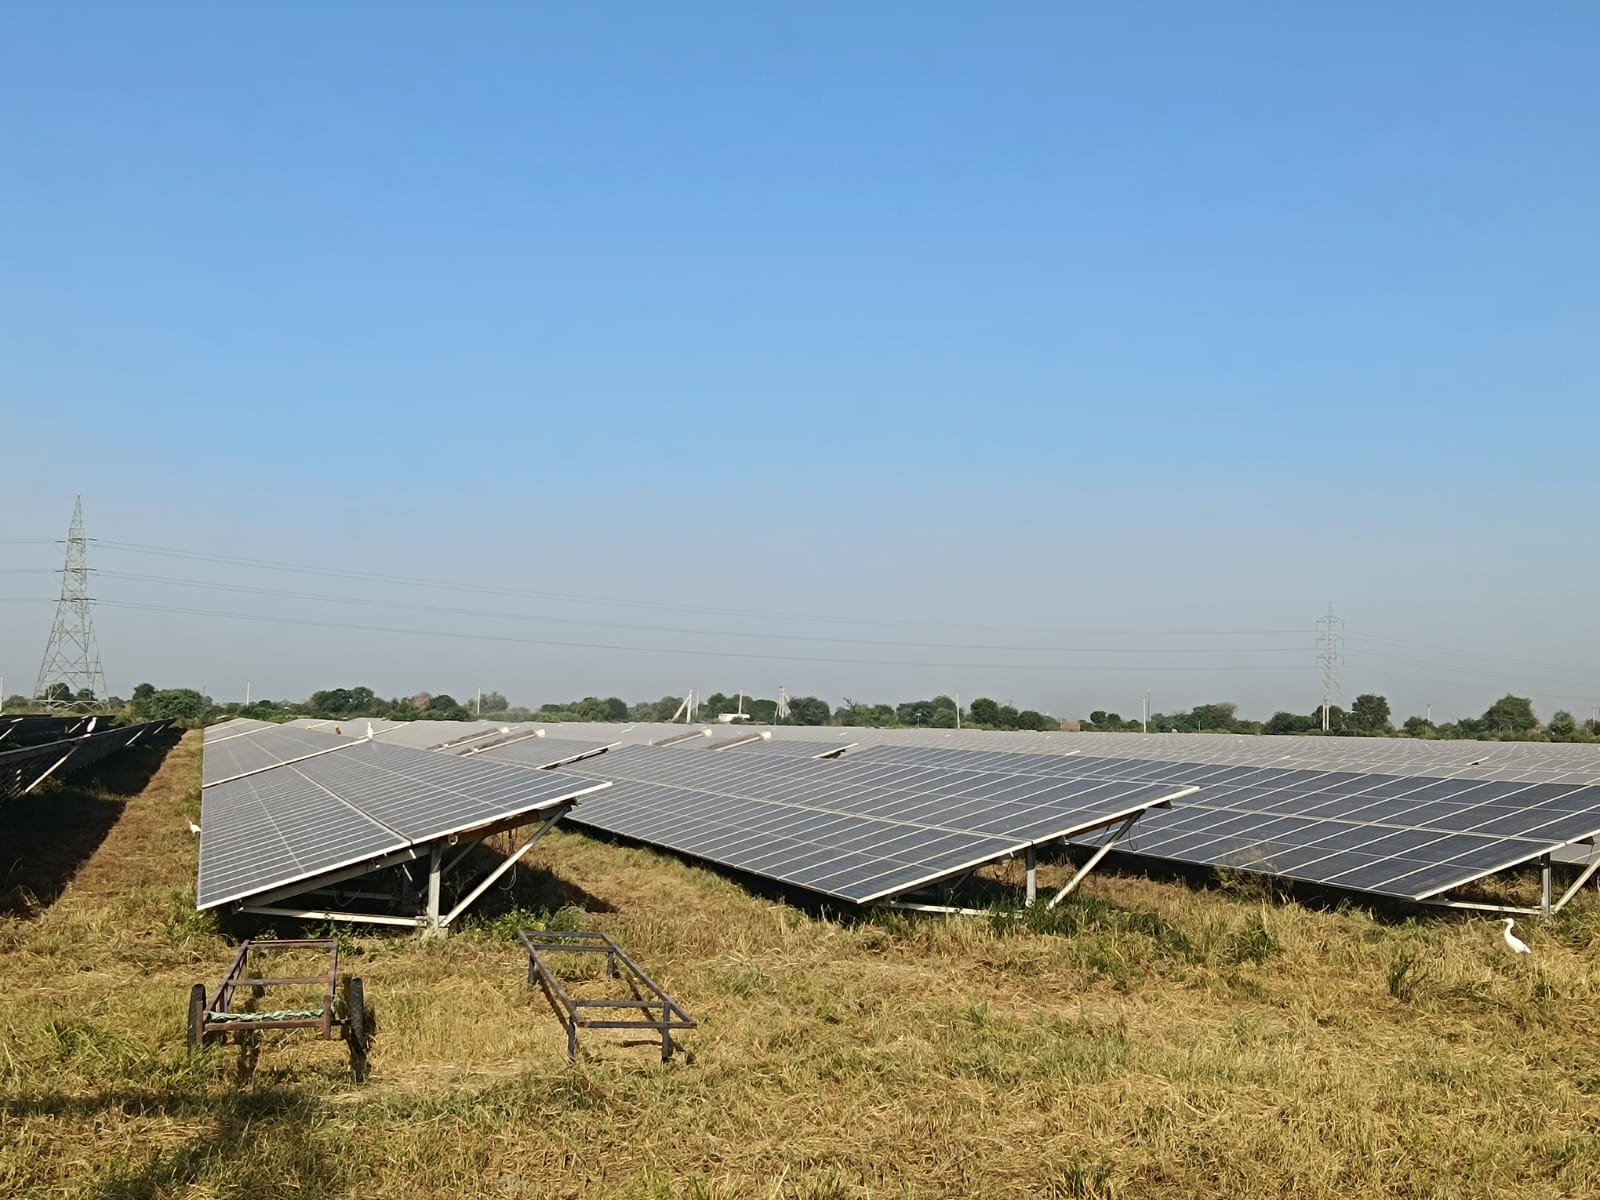
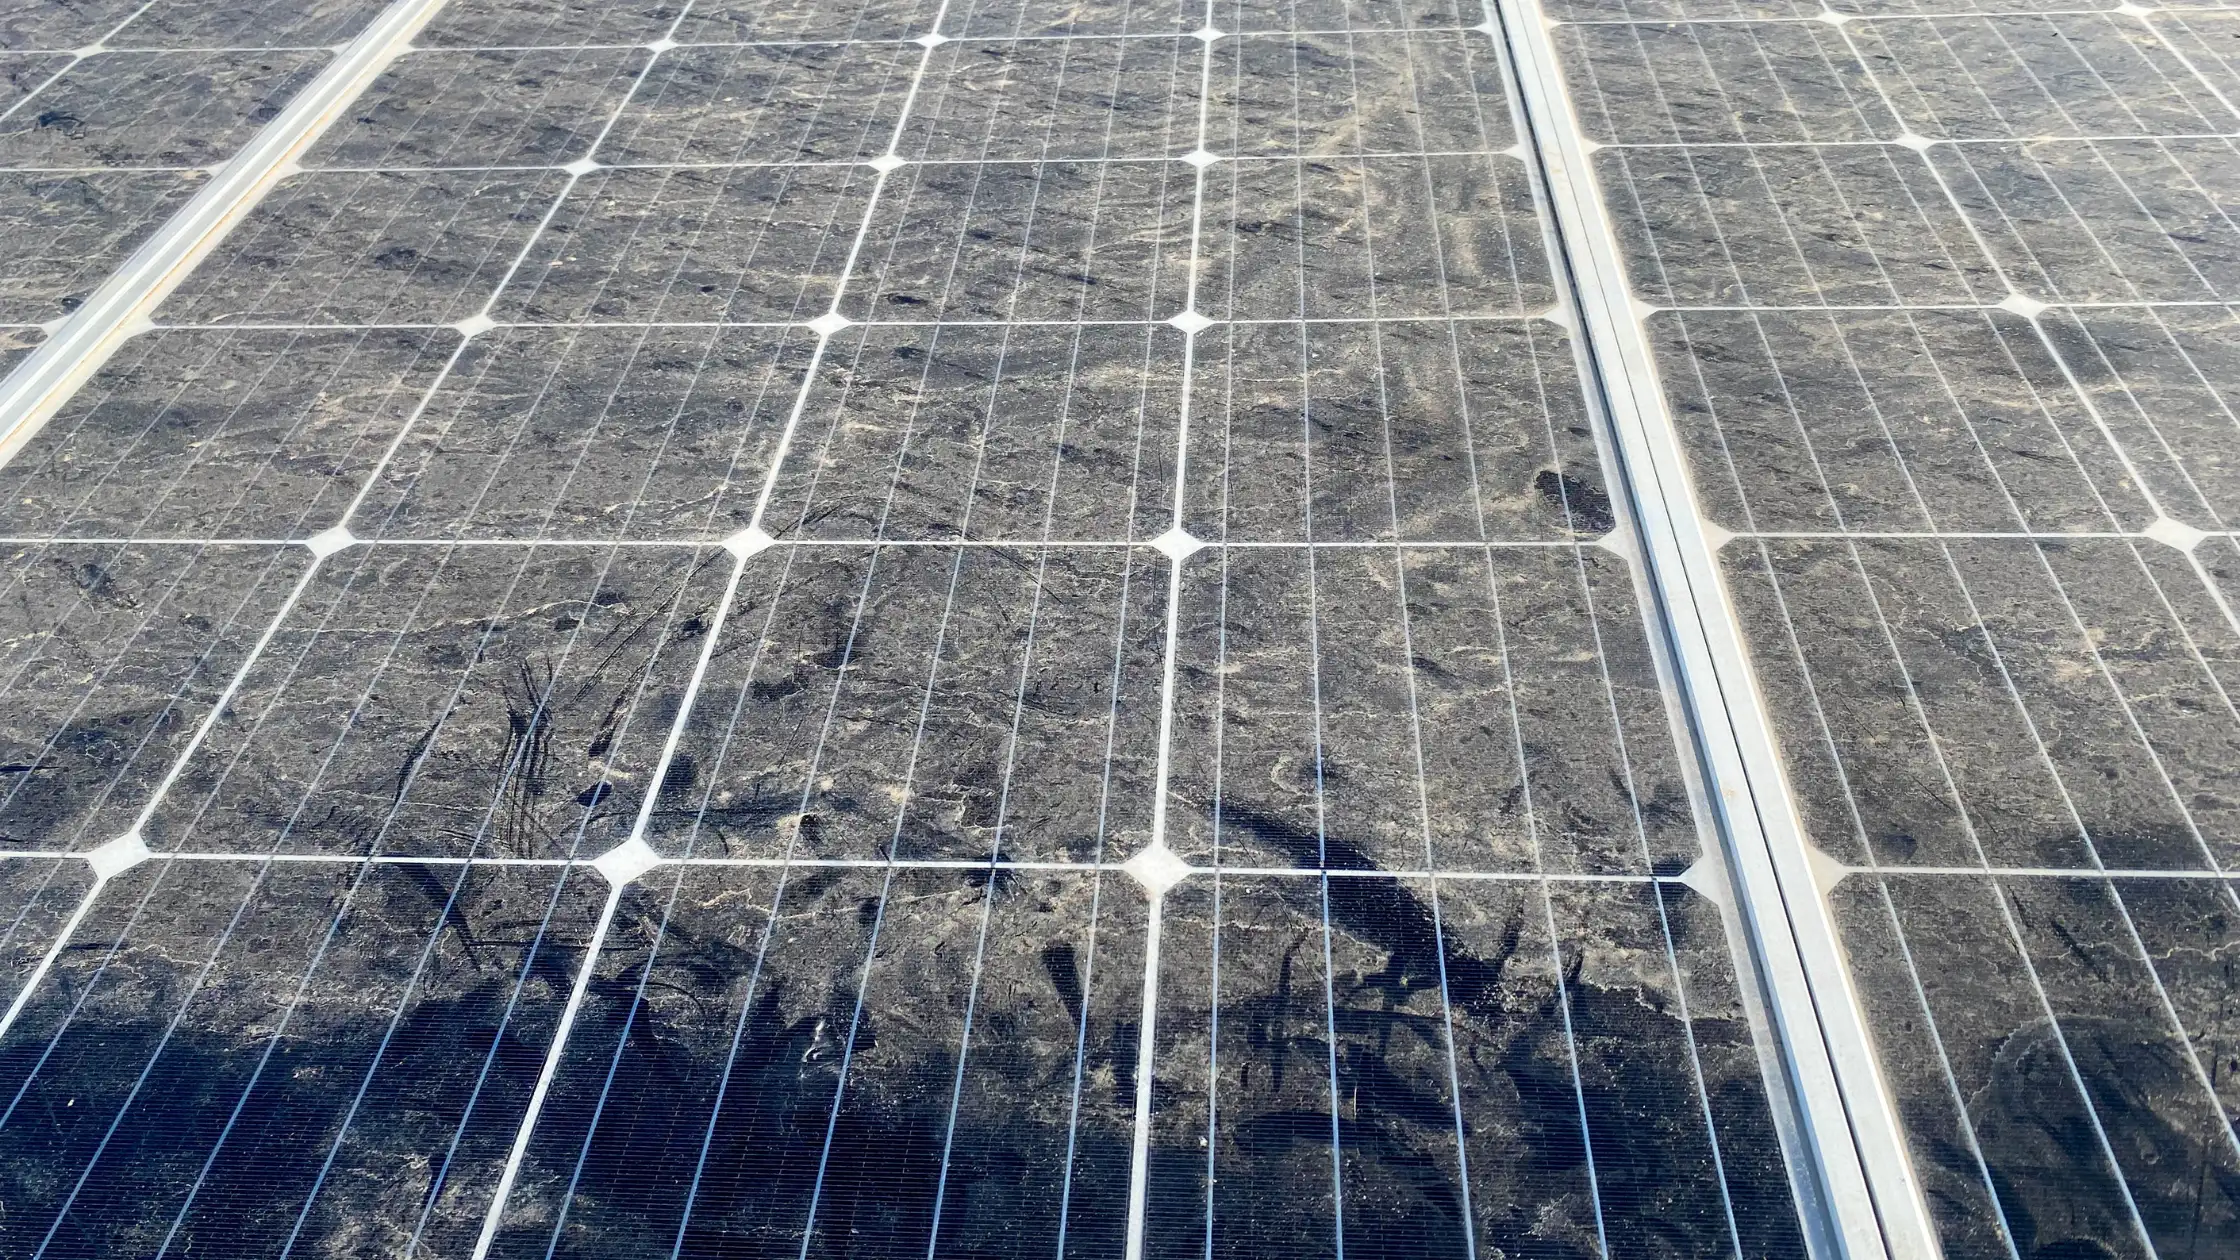
The primary hurdle for utility-scale O&M teams is that soiling and degradation often mask each other in aggregate SCADA data. As dust accumulates over weeks in arid corridors like Rajasthan or Gujarat, the gradual drop in current mimics the signature of aging silicon cells. At the 50 MW+ scale, relying on manual inspection or periodic manual cleaning makes this separation nearly impossible to calculate in real-time.
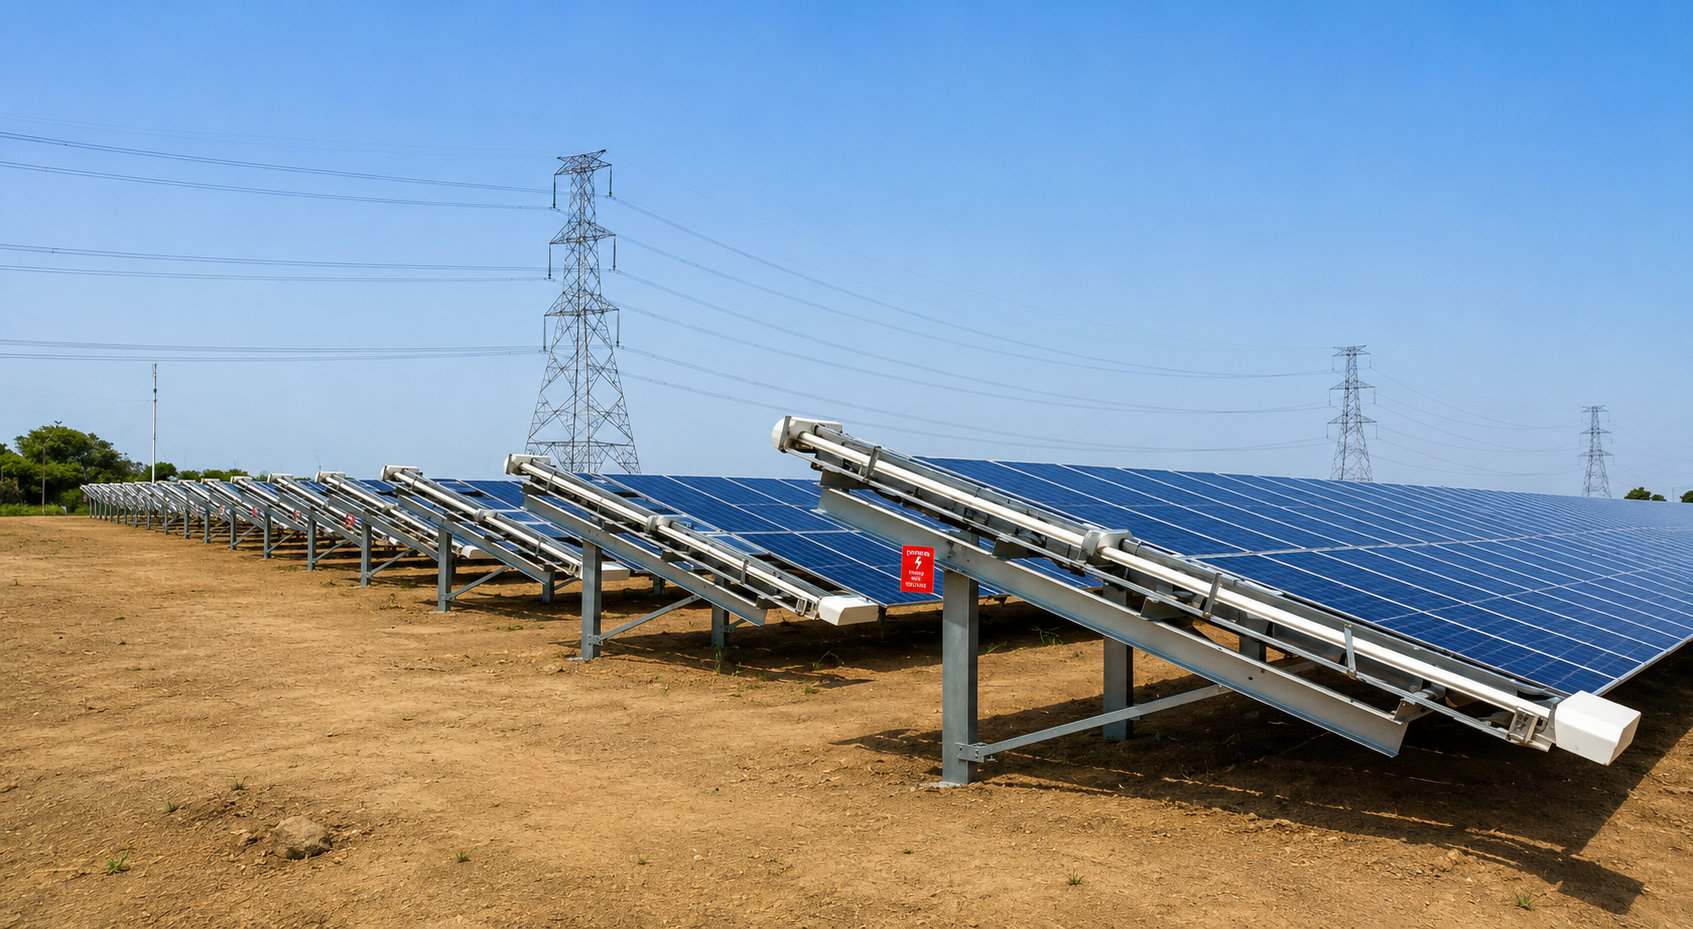
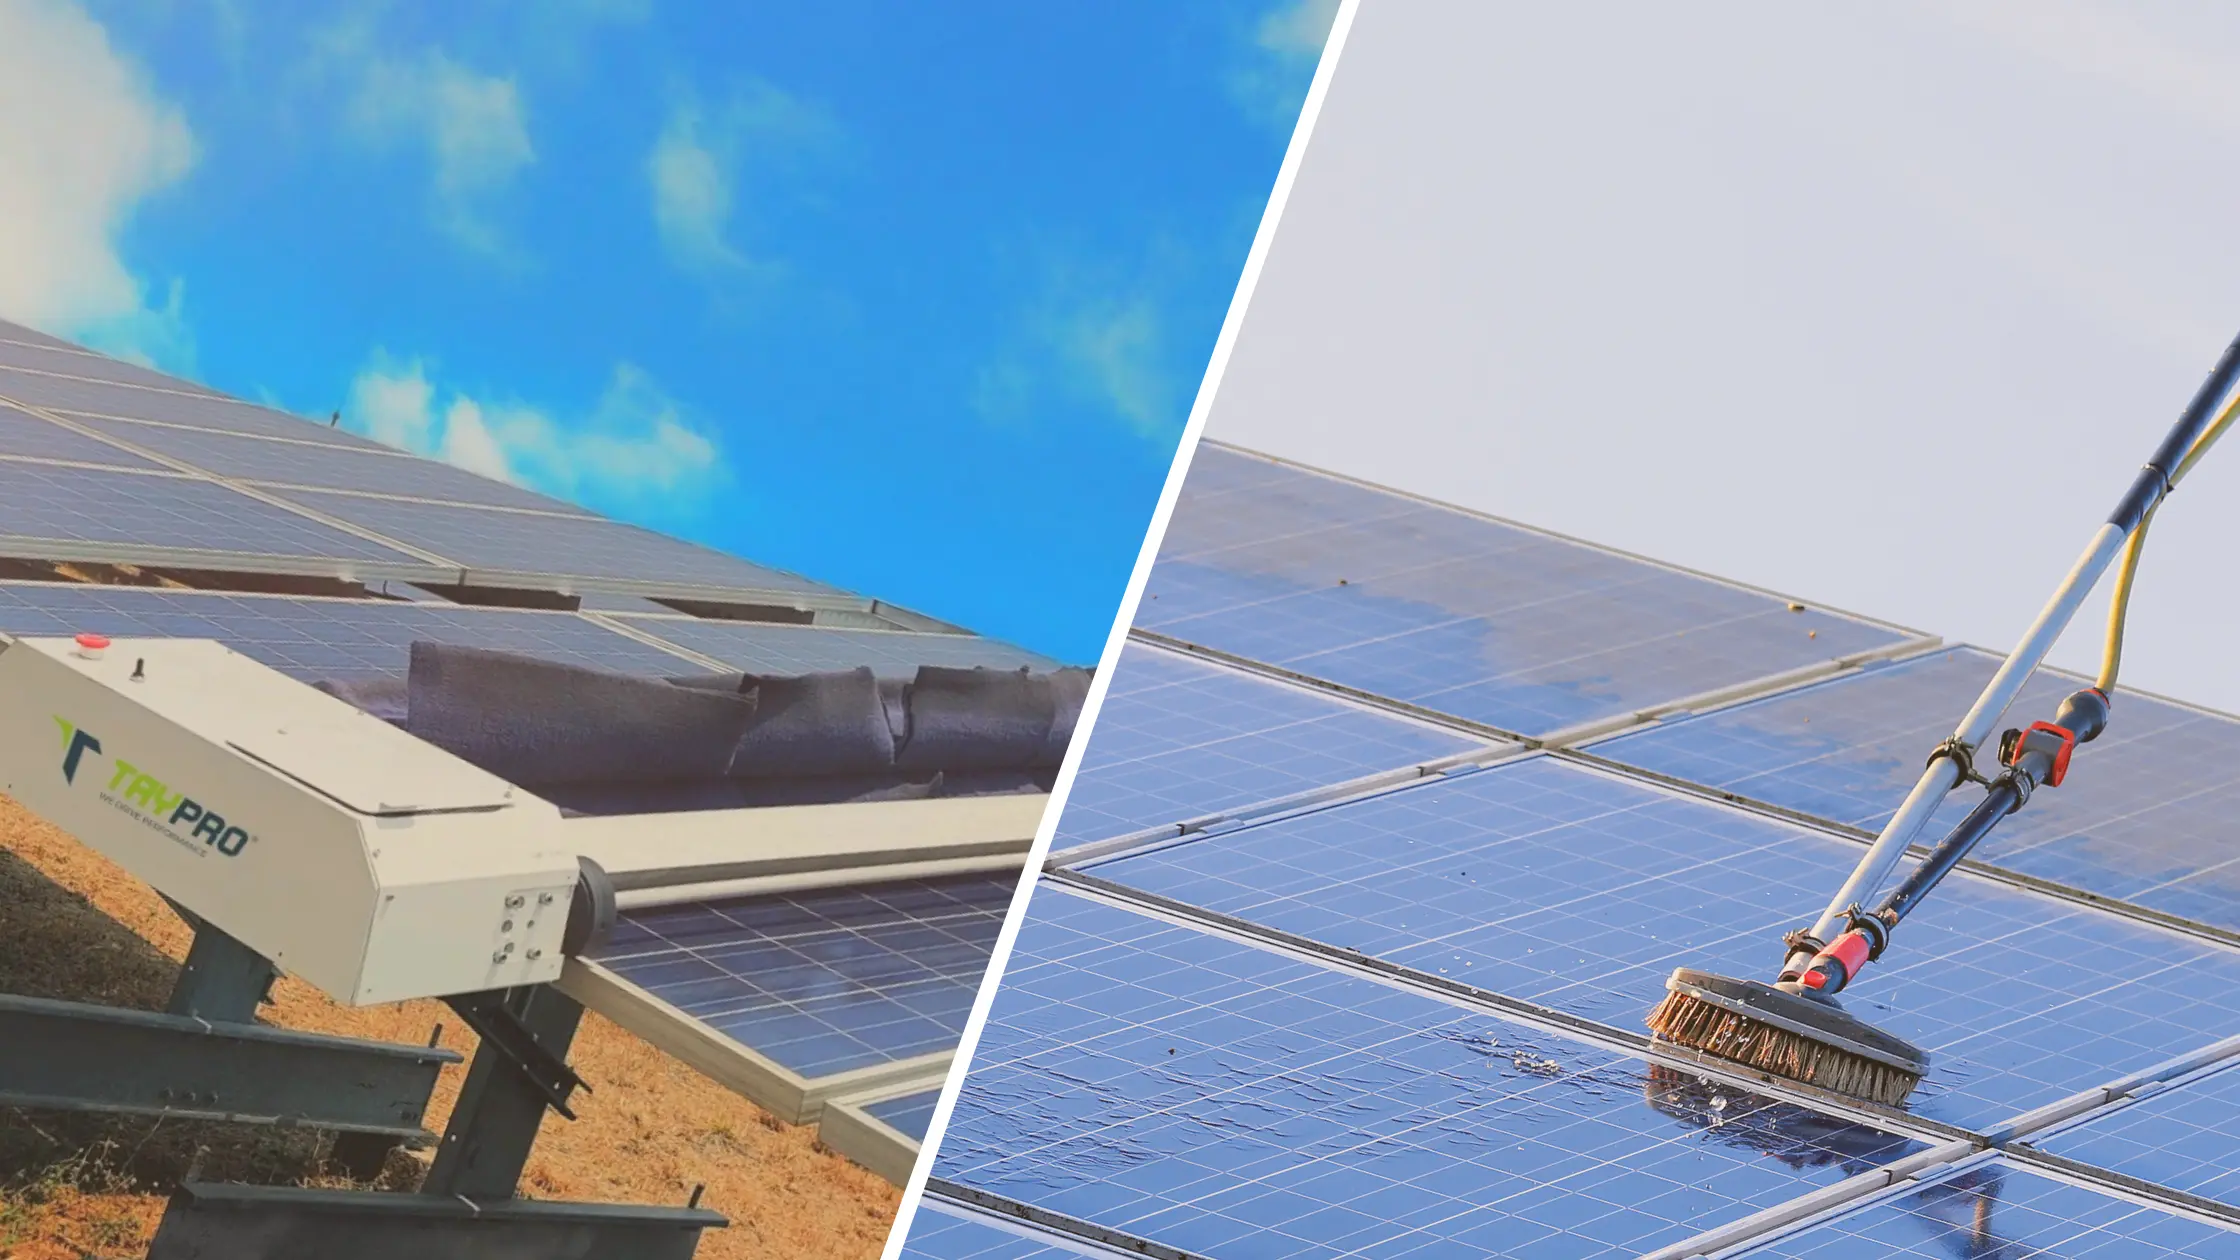
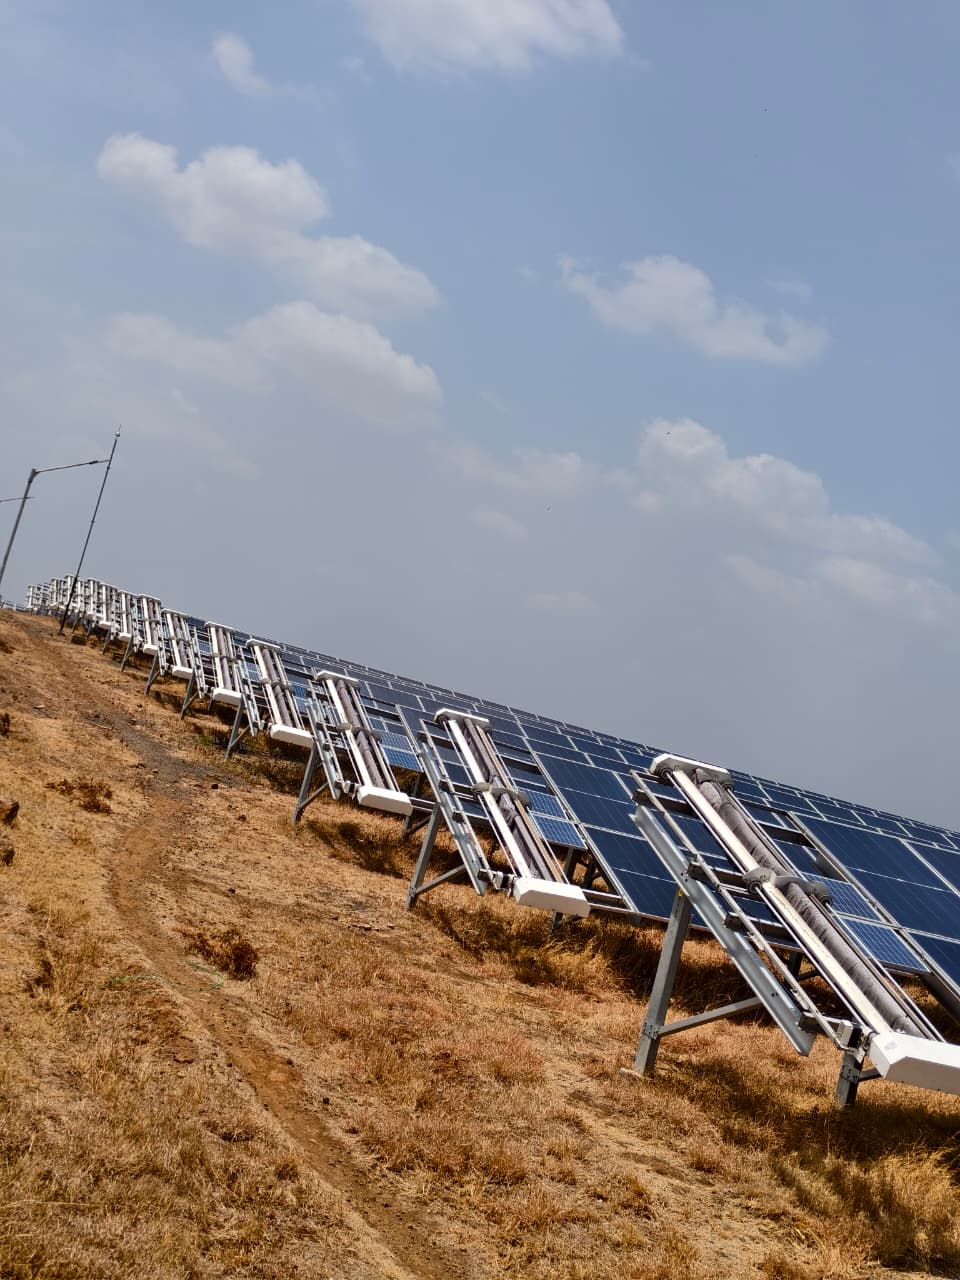
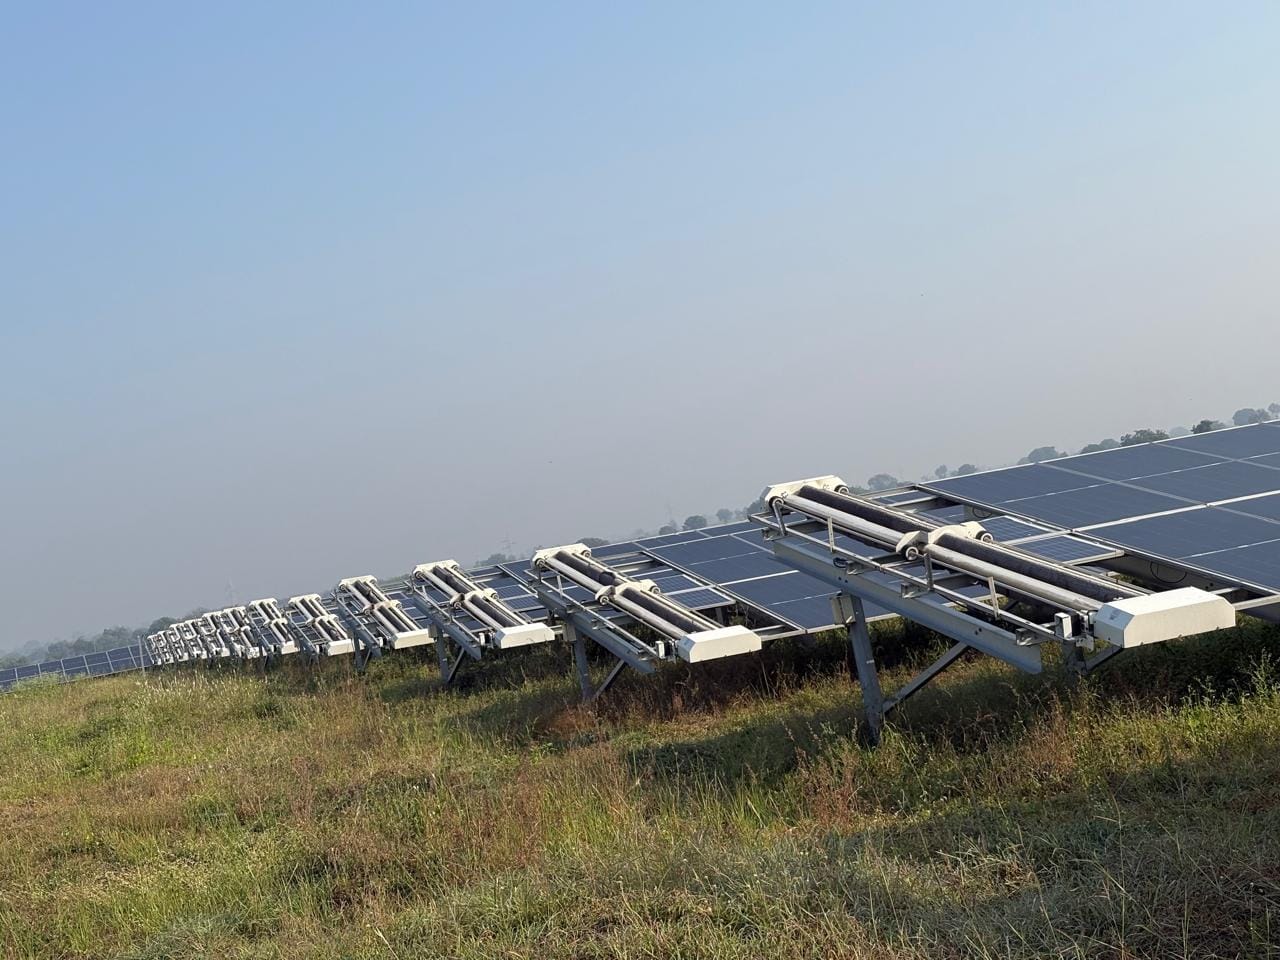
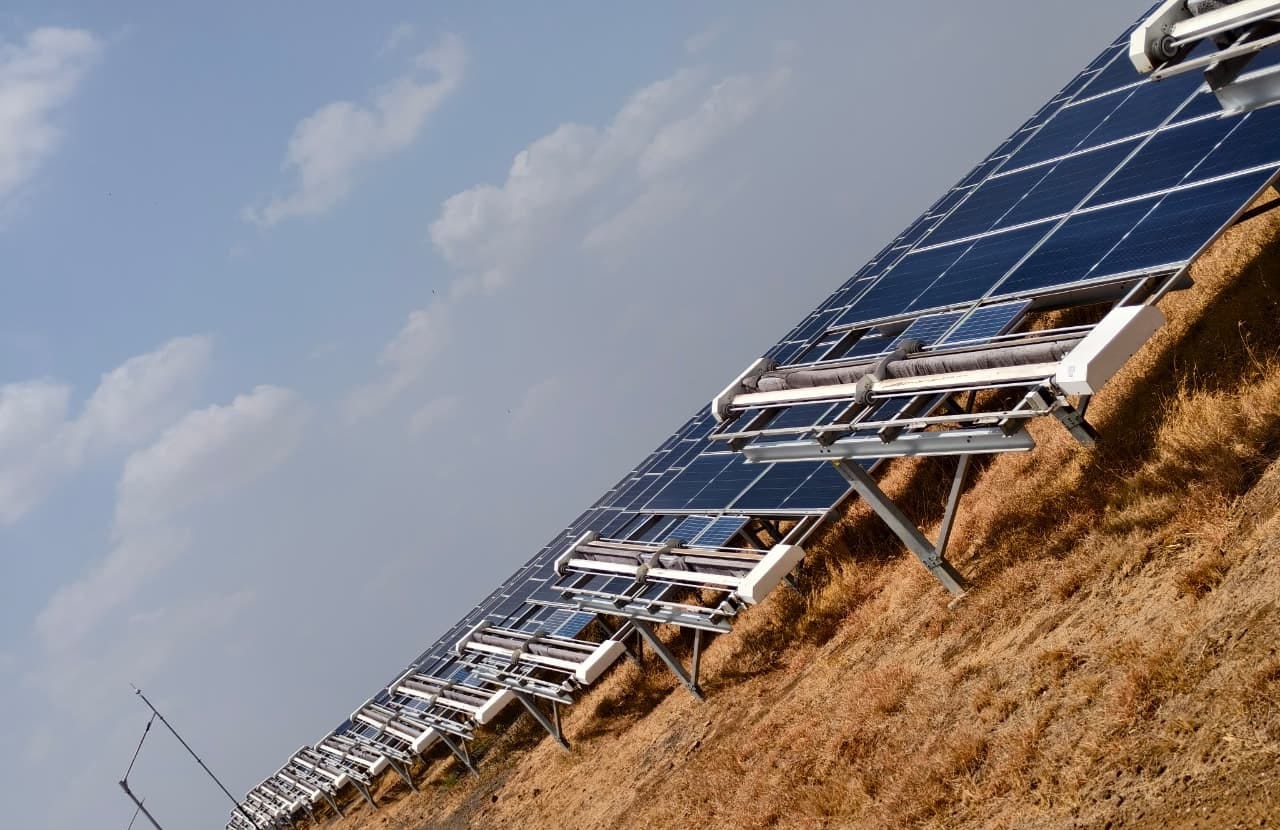
Separating the two requires a high-frequency data feedback loop. By utilizing autonomous cleaning systems that report per-row telemetry, you create a baseline for clear-sky conditions. When you compare this specific row data against the wider field-wide average, the 'noise' of uniform degradation is filtered out. This allows asset managers to see the exact delta created by local dust concentration versus the systemic performance decline of the modules across the entire site.
Comparative metrics: Soiling vs. Degradation
Distinguishing between these two performance killers requires a nuanced understanding of their operational signatures. While degradation is tied to the physical aging of the semiconductor materials and the slow breakdown of encapsulants, soiling is fundamentally an optical transmission issue. The following table highlights the core differences that O&M teams should use to triage performance alerts.
| Metric | Soiling Loss | Module Degradation |
|---|---|---|
| Recovery mechanism | Cleaning cycle or rain | None (permanent) |
| Trend over time | Cyclical saw-tooth pattern | Linear downward slope |
| Data correlation | High correlation with AQI/Dust index | Independent of weather variables |
| Repair requirement | Operational O&M cleaning | Warranty claim or replacement |
Advanced diagnostic variables
Beyond simple PR tracking, operators must account for the spectral response of the modules. Soiling frequently blocks specific wavelengths of light, particularly in the blue-ultraviolet spectrum, which can artificially inflate the degradation reading if you are using standard irradiance sensors. By cross-referencing your SCADA output with satellite-based irradiance data (like SOLCAST or PVGIS), you can normalize the expected output. If the measured PR is lower than the satellite-modeled expectation, you are dealing with a localized transmission loss (soiling) rather than a cell-level loss (degradation).
The role of sensor calibration in error mitigation
A frequent error in utility-scale monitoring is relying on a single reference cell to represent the performance of a 100 MW site. If that reference cell is cleaned more frequently than the rest of the array, your PR data will be fundamentally skewed. This mismatch creates a false impression of site-wide degradation. To accurately separate variables, you must implement a redundant sensor array.
Implementing differential monitoring
Install two reference cells at the center of your site: one cleaned automatically on the same cycle as your robotic units and one that remains uncleaned for 30 days. The delta between these two sensors provides a real-time 'soiling rate' that you can subtract from your total site PR. Once this soiling factor is removed from the equation, any remaining downward trend in your generation data is purely attributable to module degradation or electrical system faults. This methodology effectively isolates the two variables, allowing for precise O&M scheduling that respects your module supplier specifications.
Data analysis: identifying patterns in PR degradation
To distinguish between permanent degradation and transient soiling, you must map the Performance Ratio (PR) trend line against a normalized clear-sky model. Degradation follows a linear, slow decline over months, typically ranging from 0.5% to 0.7% annually for mono-crystalline modules. In contrast, soiling appears as a jagged saw-tooth pattern in your daily SCADA data, where PR drops progressively until a cleaning event triggers a sharp recovery.
You should calculate your daily PR using calibrated pyranometers and back-of-module temperature sensors. If your post-cleaning PR peak does not return to your rolling baseline from 90 days prior, you are likely witnessing module-level degradation or a permanent component fault. If the peak returns to your expected historical maximum, the loss is purely environmental. For teams managing utility-scale arrays, monitoring these cycles via regional soiling benchmarks is essential to avoid unnecessary O&M spend.
How do I determine if my plant needs a cleaning cycle or a warranty claim?
A cleaning cycle is warranted if your site-specific PR decay exceeds your economic threshold for energy loss, usually set at 2% to 5% of potential yield. A warranty claim investigation, however, should be initiated if the systemic PR deficit persists across the entire plant even after a deep-cleaning cycle. If your monitoring software indicates a uniform drop that matches the degradation curves provided by your module supplier specifications, the issue is likely cell-level fatigue rather than dust accumulation.
For assets located in arid high-dust corridors, you must cross-reference your PR drops with local AQI (Air Quality Index) or satellite aerosol data. If your generation drops align with high particulate matter days and recover post-cleaning, it is soiling. If your modules continue to underperform significantly after removing surface dust, perform an Electroluminescence (EL) imaging test on sample strings to identify potential PID or micro-cracking issues that masquerade as efficiency loss.
Managing the impact of soiling on long-term plant performance
Soiling does more than just reduce immediate revenue; it accelerates long-term degradation through chemical interactions with organic matter and abrasive particles. In arid regions, persistent dust that remains on the panel surface during high-temperature cycles can create hot spots, which permanently damage bypass diodes and cell integrity. By maintaining a region-specific cleaning schedule, you effectively extend the functional life of your module strings by preventing these localized thermal stress points.
Advanced asset management teams now treat cleaning as a preventative maintenance measure rather than an emergency response. By analyzing historical weather patterns in conjunction with smart postponement protocols, you ensure that cleaning cycles are timed to maximize yield recovery without exposing the glass to unnecessary mechanical cycles during peak humidity periods. This targeted approach preserves the anti-reflective coating on your PV glass, which is critical for maintaining performance over the 25-year asset lifecycle.
Decision checklist for asset managers
- Monitor daily PR against a normalized baseline using clear-sky irradiance models.
- Flag any PR deviation exceeding 2% as a potential soiling event before trigger-cleaning.
- Perform an EL test if post-cleaning performance does not recover within 1% of the baseline.
- Review monthly module cleaning logs to ensure mechanical wear on glass is within manufacturer limits.
- Use site-specific soiling data to adjust the cleaning frequency, especially before high-dust seasons.
What plant managers should do next
- Audit current cleaning logs for all 50 MW+ blocks to identify lingering performance gaps.
- Integrate real-time autonomous cleaning system data with your existing SCADA for faster fault identification.
- Establish a formal protocol for warranty claim verification before scheduling invasive module testing.
- Review current O&M contracts to ensure that soiling loss targets are clearly defined against actual PR data.
Sources and further reading
Frequently asked questions
Separating module degradation from soiling loss requires tracking your daily Performance Ratio (PR) against local weather and site-specific soiling thresholds. Degradation is a permanent, irreversible decline in module output, while soiling is a temporary loss caused by particulate accumulation.
In arid regions of India, soiling loss typically causes a 5%–15% monthly variance in PR. Operators should implement automated cleaning if the daily soiling accumulation leads to a PR decay exceeding 0.2% per day.
Deep cleaning should be scheduled based on your site-specific soiling thresholds. By tracking PR before and after cleaning events, you can determine if the output loss is reversible. If multiple cleaning cycles fail to return the PR to your established baseline, you should investigate for permanent system-level faults.
Yes, autonomous cleaning systems provide high-frequency row-level telemetry that creates a clear-sky baseline. By comparing this row-specific data against the broader field average, you can filter out the noise of variable soiling, allowing you to isolate and track the true, permanent degradation of your modules.