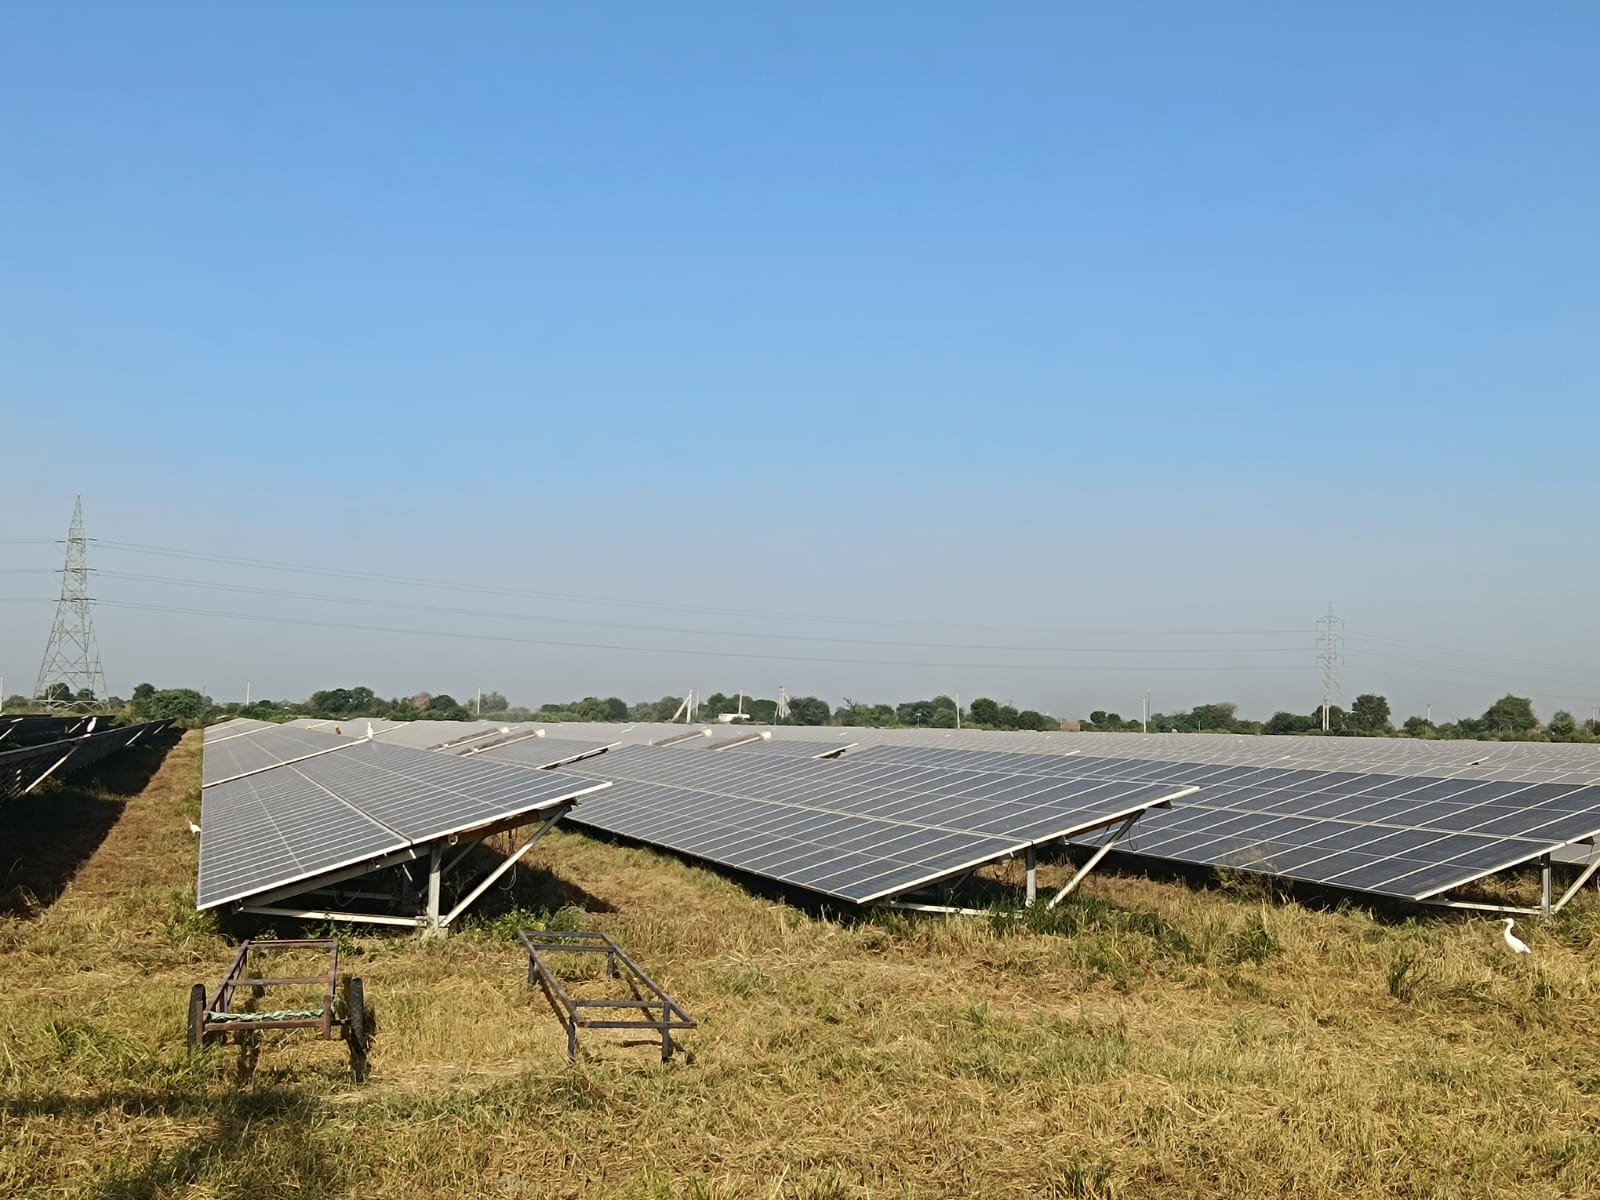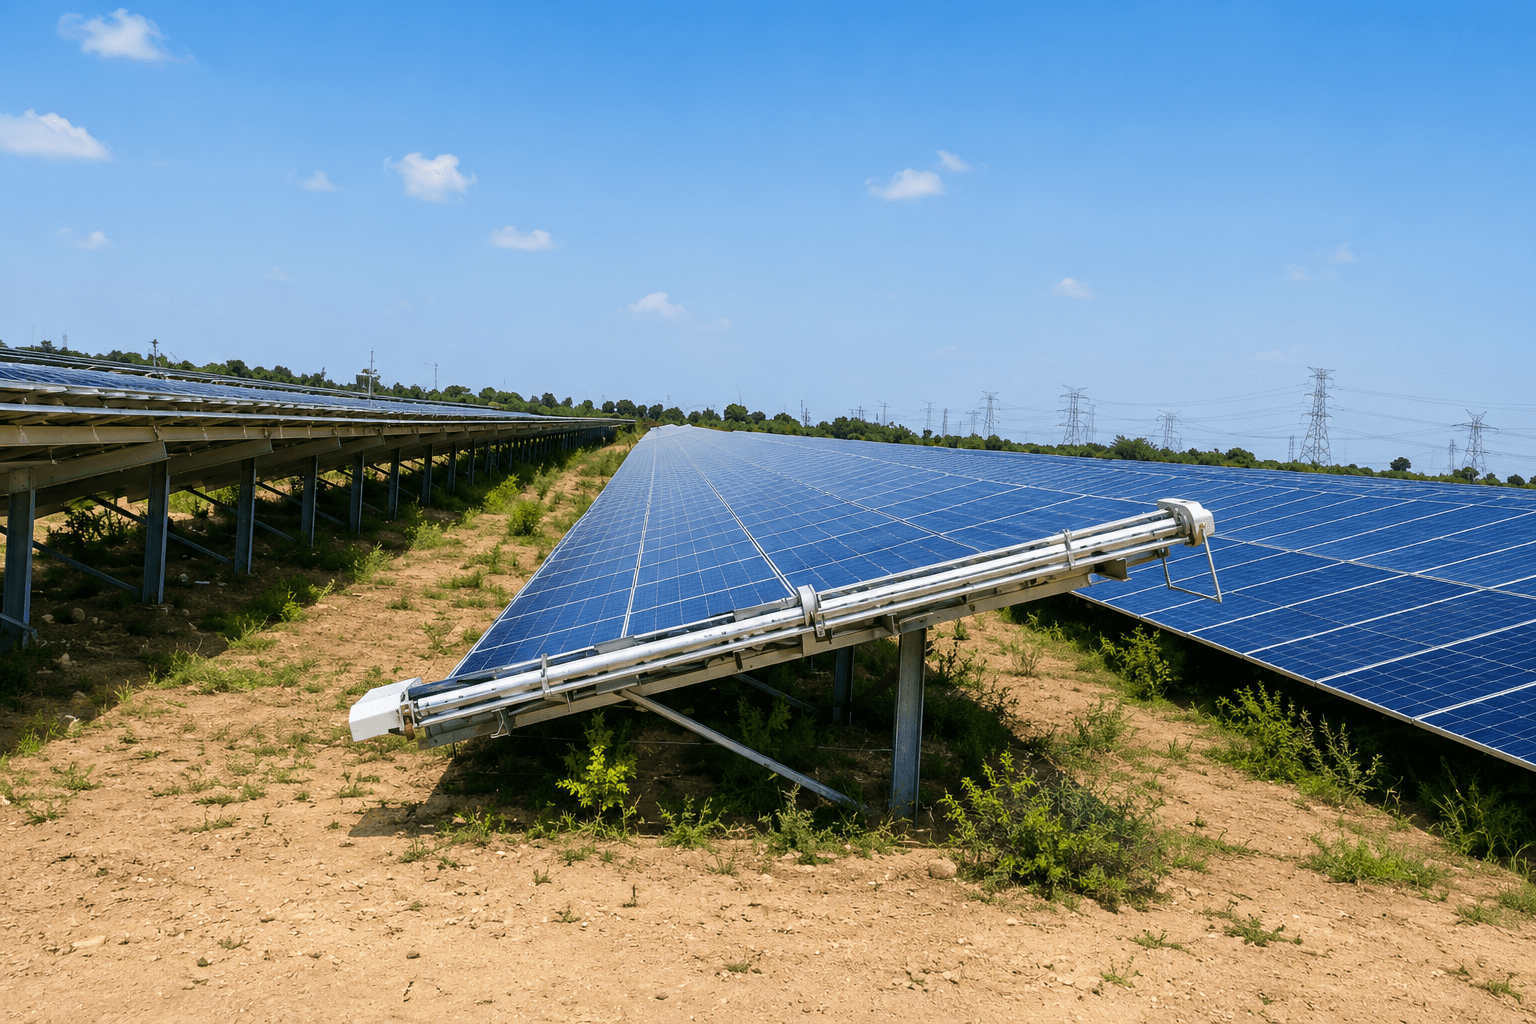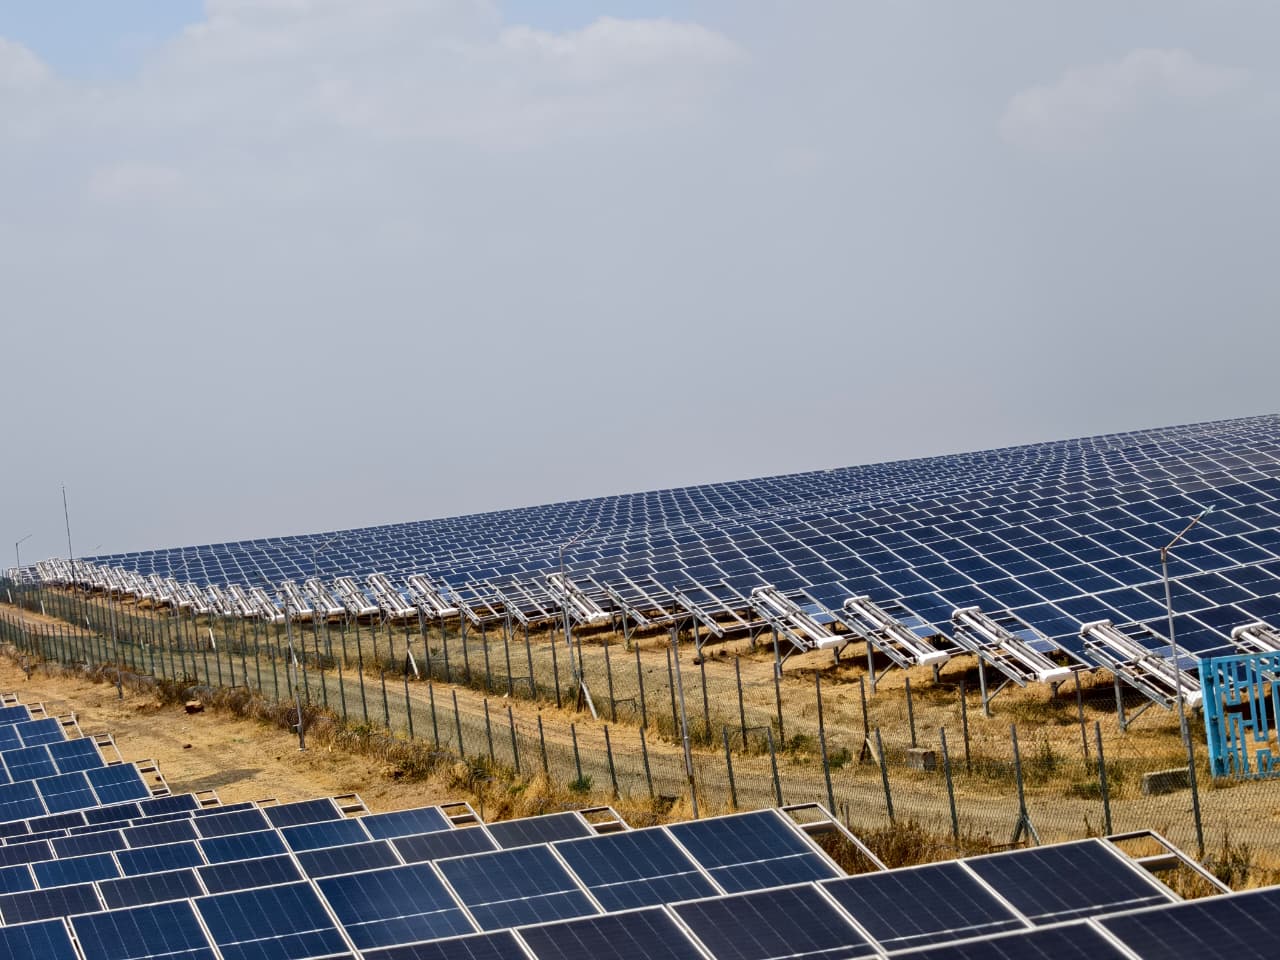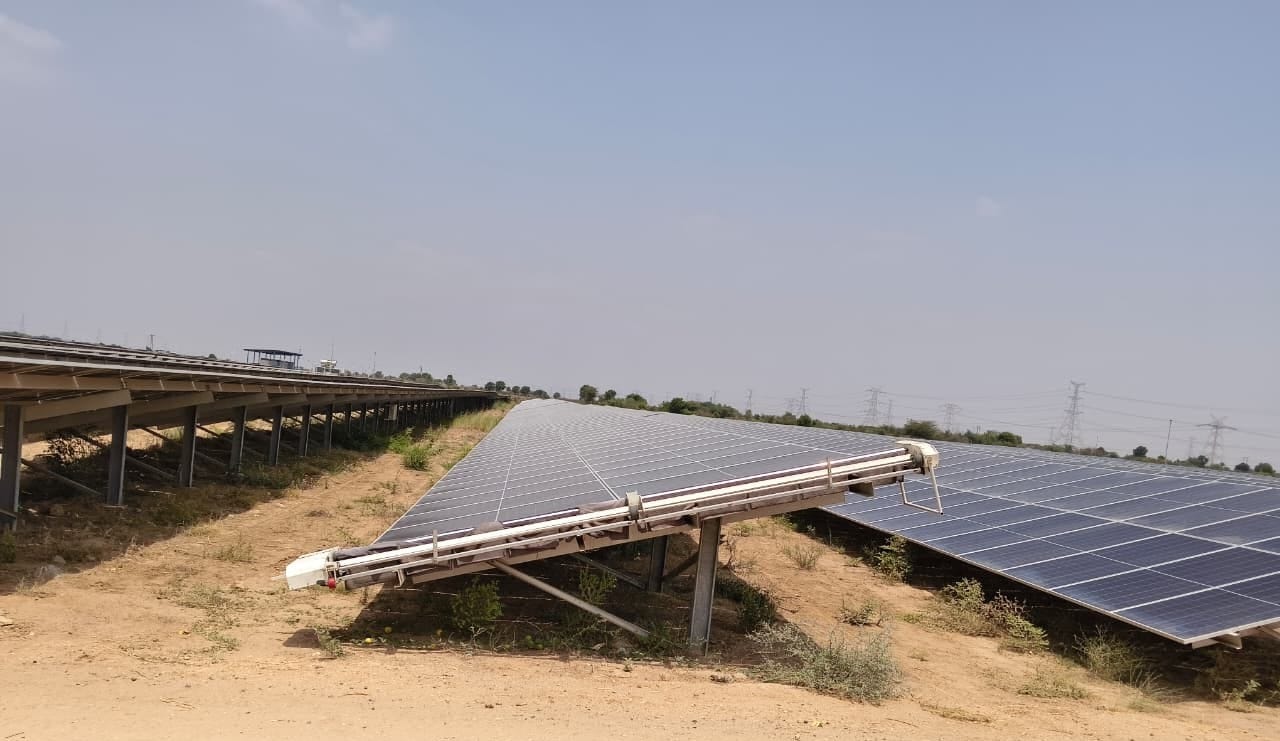
What the plant looked like: The visibility gap in daily O&M
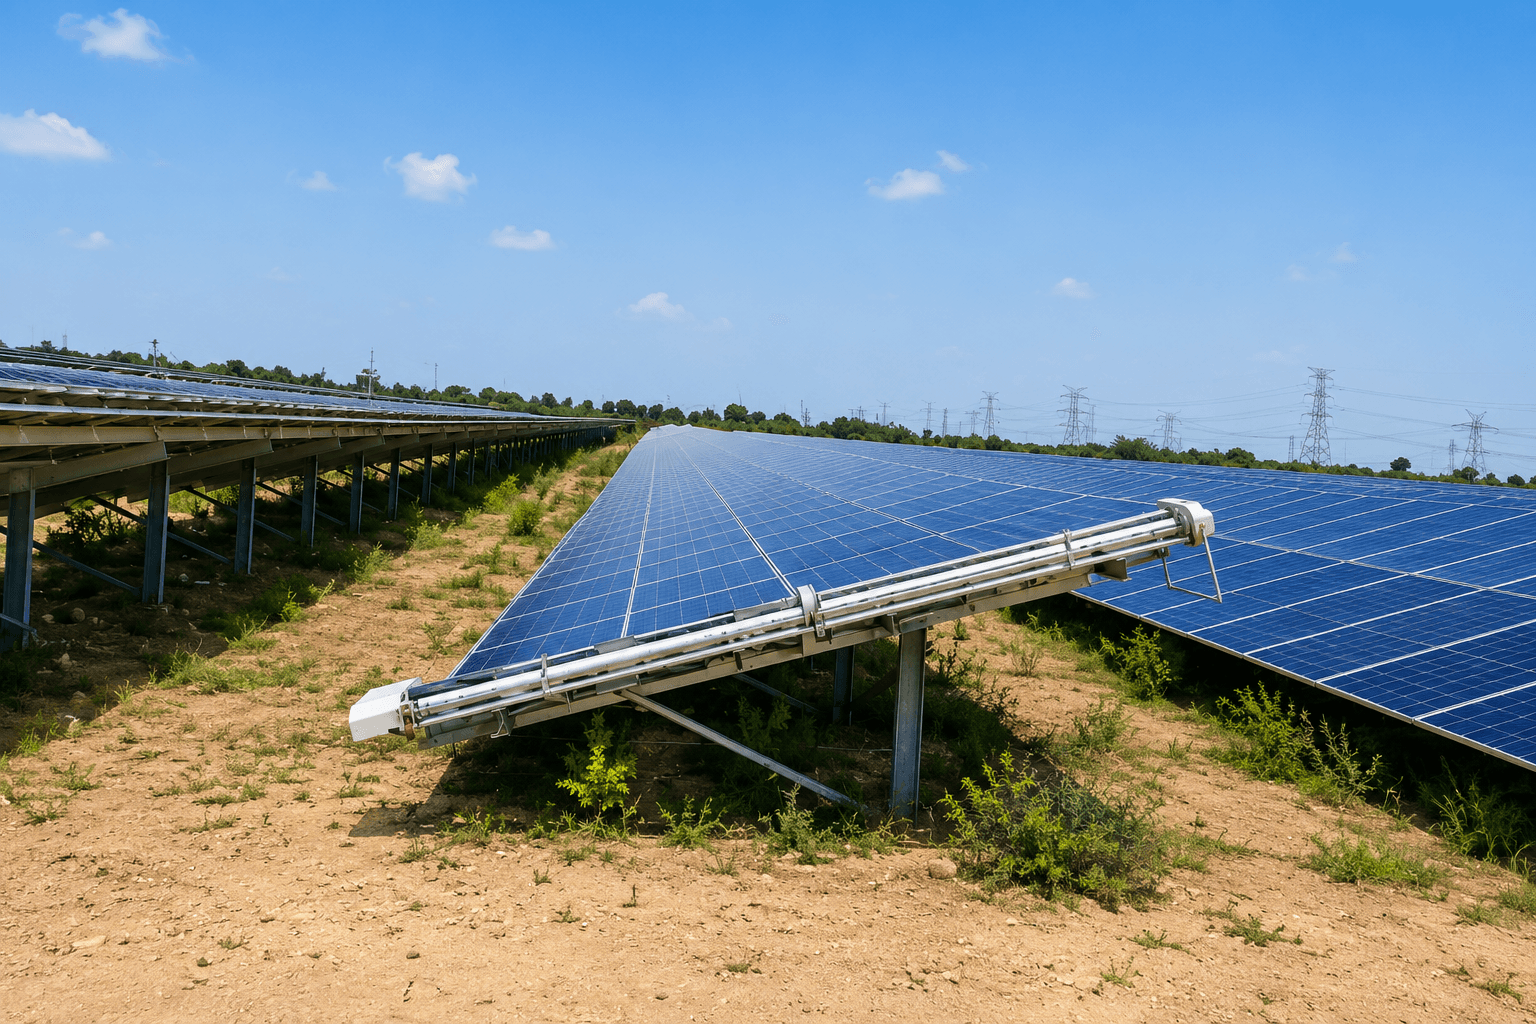
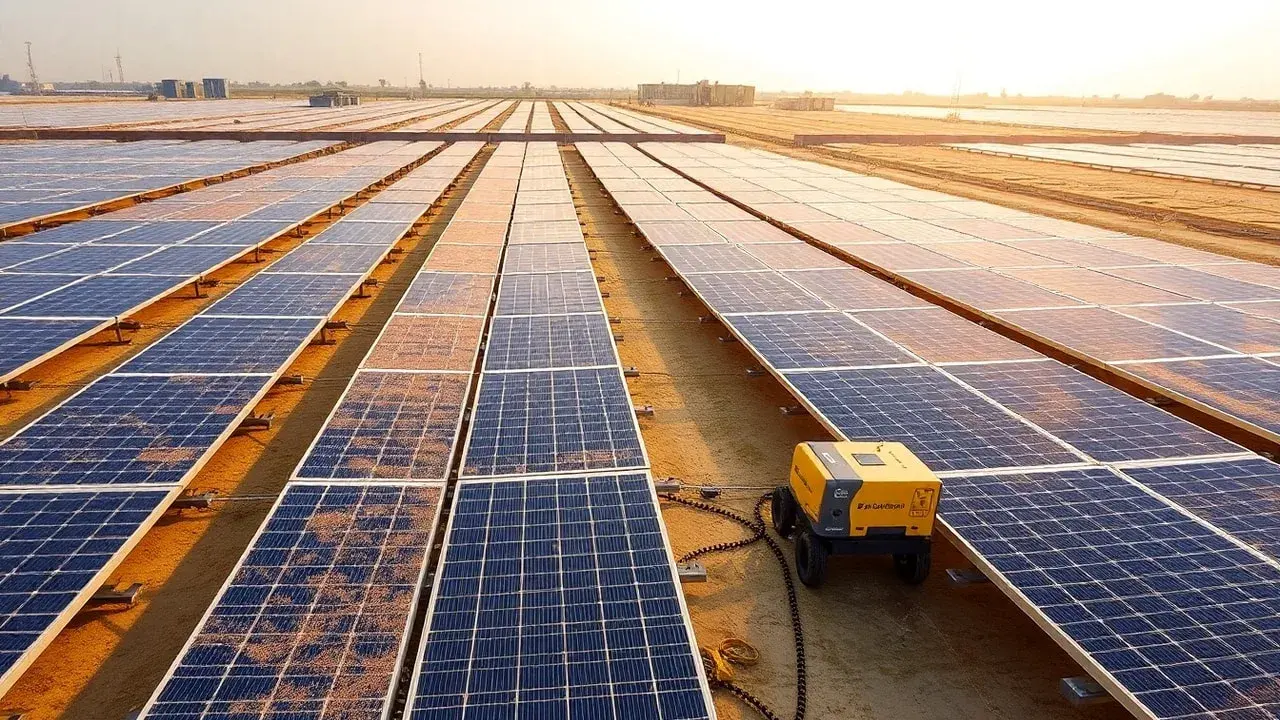
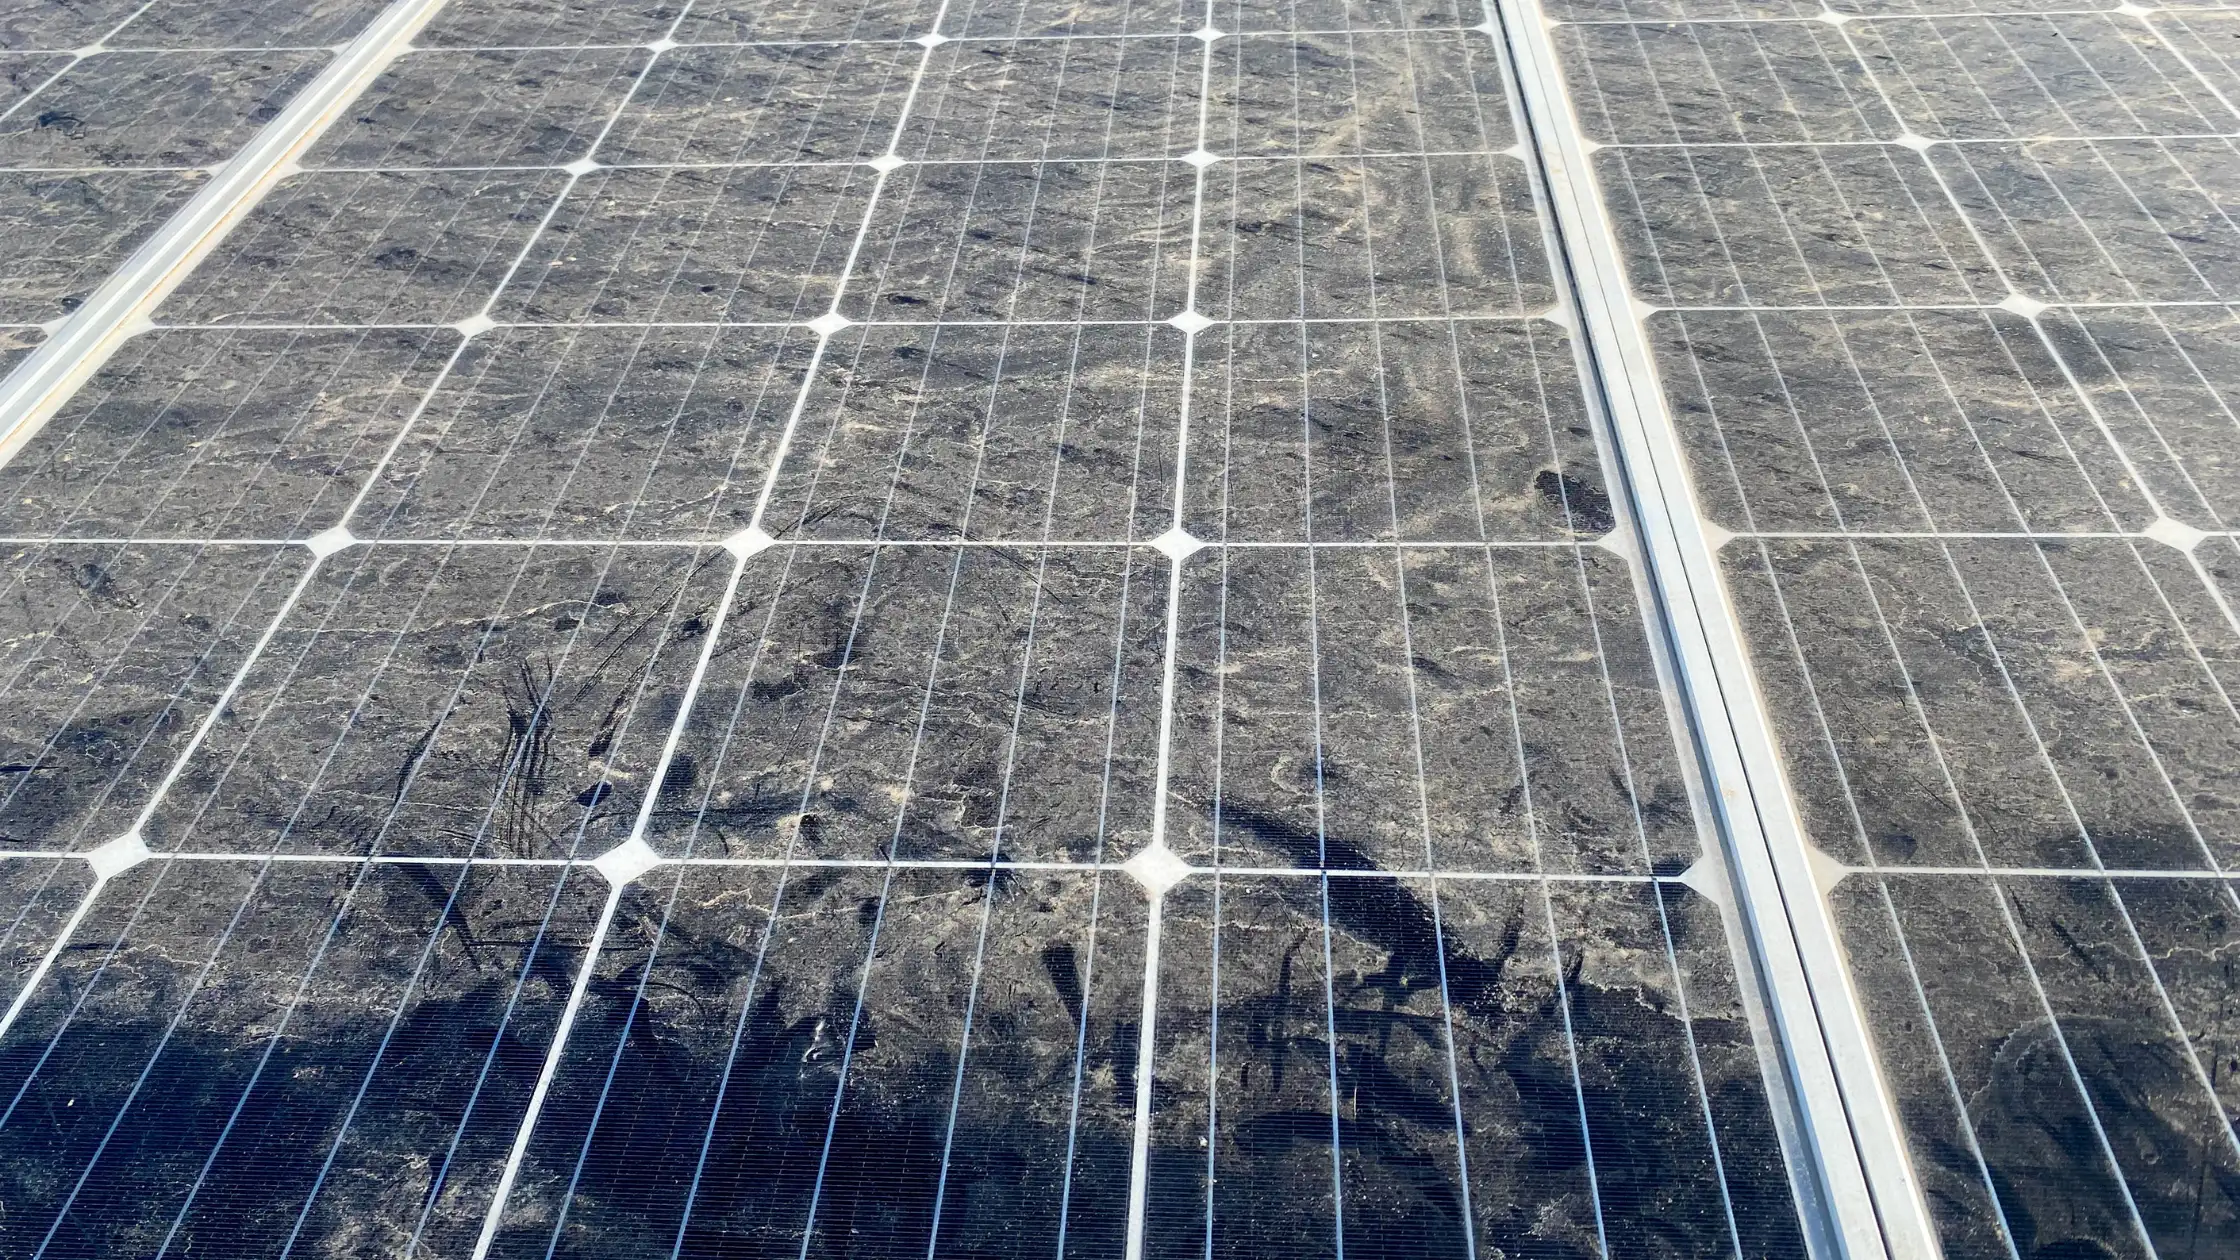
For utility-scale asset managers in India, the daily struggle of managing soiling often begins with a lack of visibility. Traditionally, teams rely on scheduled cleaning cycles or reactive fixes based on PR drops observed in the SCADA system, which often mask the exact nature of the accumulation. Without image-based data, operators essentially fly blind, unsure if a 3% performance dip is caused by bird droppings in one block or uniform dust deposition across 100 megawatts.
This visibility gap creates a significant risk for large-scale operators who must balance the cost of cleaning with the revenue recovered. When you cannot differentiate between localized organic soiling and regional dust, you often over-clean or under-clean, both of which erode the bottom line. Relying solely on manual inspection is impossible at this scale, where thousands of panels span hundreds of acres. The shift toward AI-based image recognition for soiling detection on solar plants replaces this guesswork with granular, actionable telemetry.
By integrating automated image capture, plant managers gain a visual record of their site health that standard SCADA sensors simply cannot provide. This allows for precise identification of which rows require intervention, reducing unnecessary labor costs and water consumption in water-scarce regions. Before implementing this technology, it is essential to understand that not all soiling is equal, and identifying the root cause via high-resolution imagery is the first step in optimizing your O&M strategy. Asset owners who have moved away from manual, periodic cleaning cycles toward data-driven, autonomous approaches frequently find that they recover energy previously lost to uneven soiling patterns. To learn more about how this operational shift affects your bottom line, refer to our guide on soiling revenue loss, which details why IPPs often undercount the impact of persistent dust on their energy yields.
How does AI-based image recognition for soiling detection plants work?
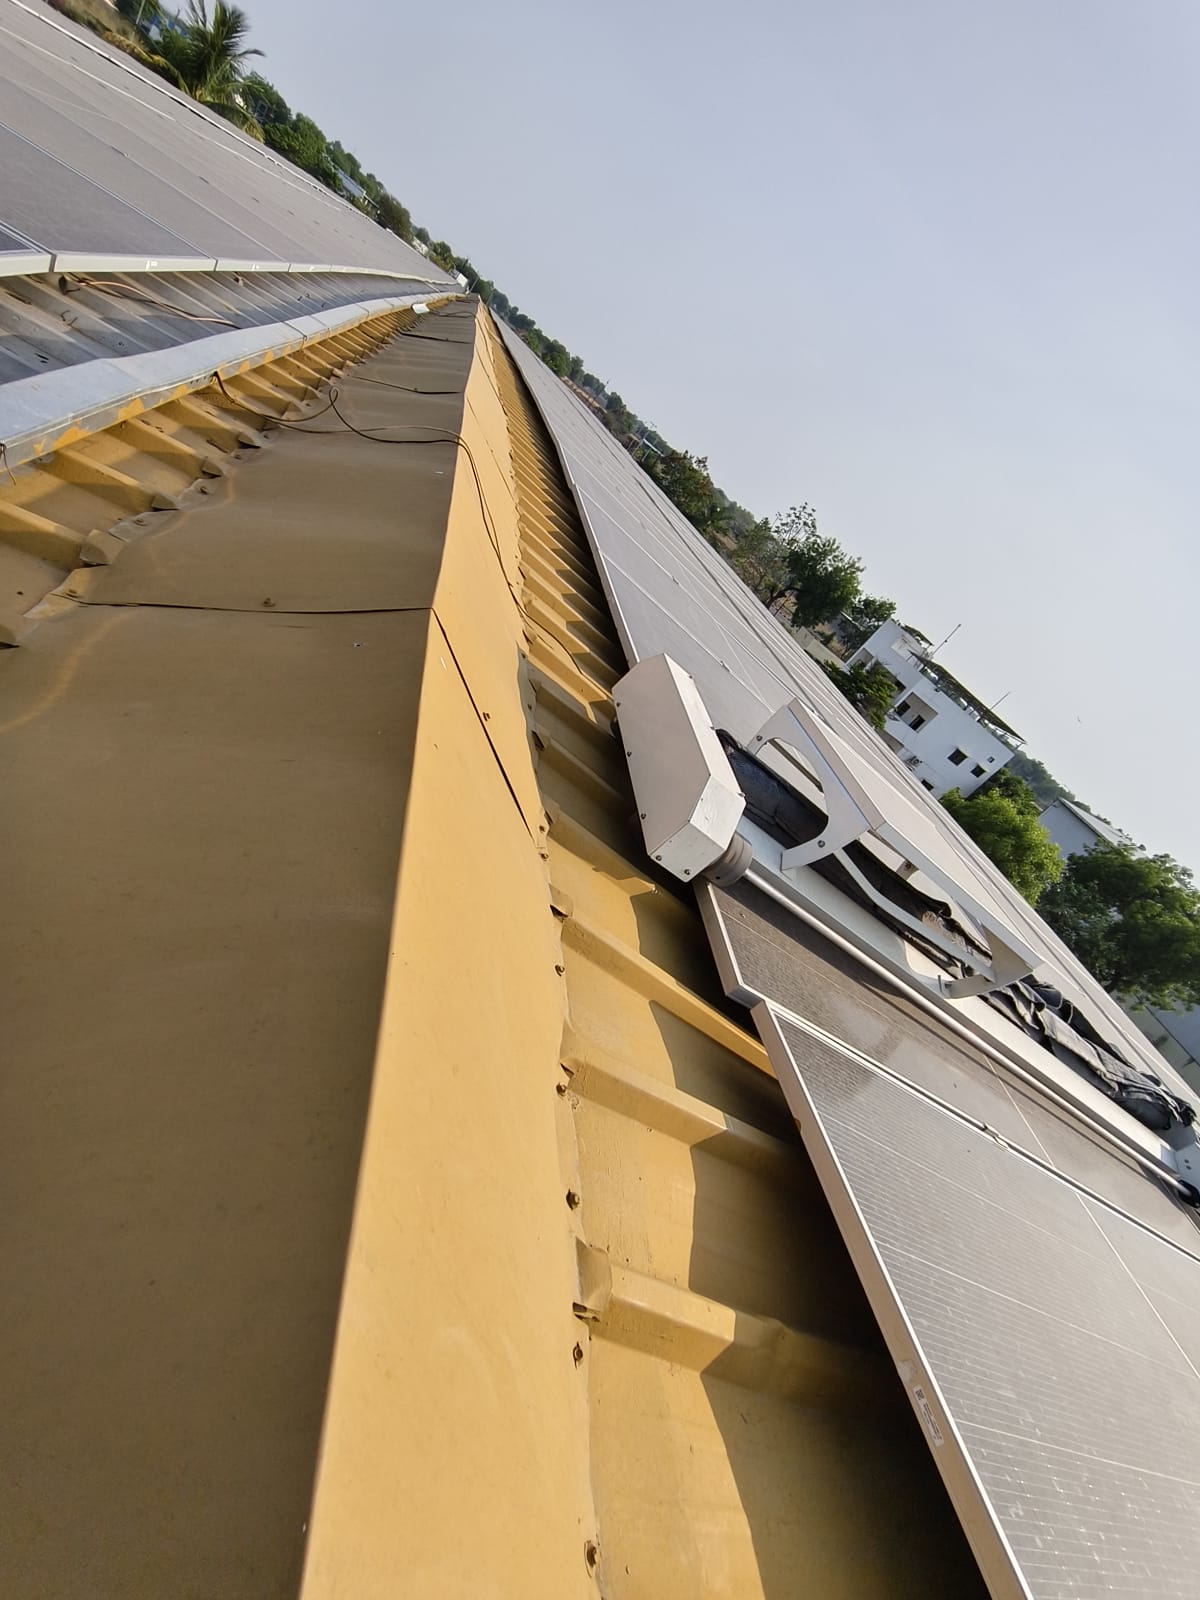
AI-based image recognition for soiling detection on solar plants operates by converting visual data into quantified performance loss metrics. The process begins with high-resolution image capture using drones or fixed cameras positioned across the site to monitor specific module blocks. These images are processed through convolutional neural networks (CNNs) trained to distinguish between different types of accumulation, such as industrial ash, bird droppings, or uniform soil buildup. Unlike traditional SCADA sensors which report aggregate voltage drops, this image-based approach identifies the spatial distribution of the soiling across the string.
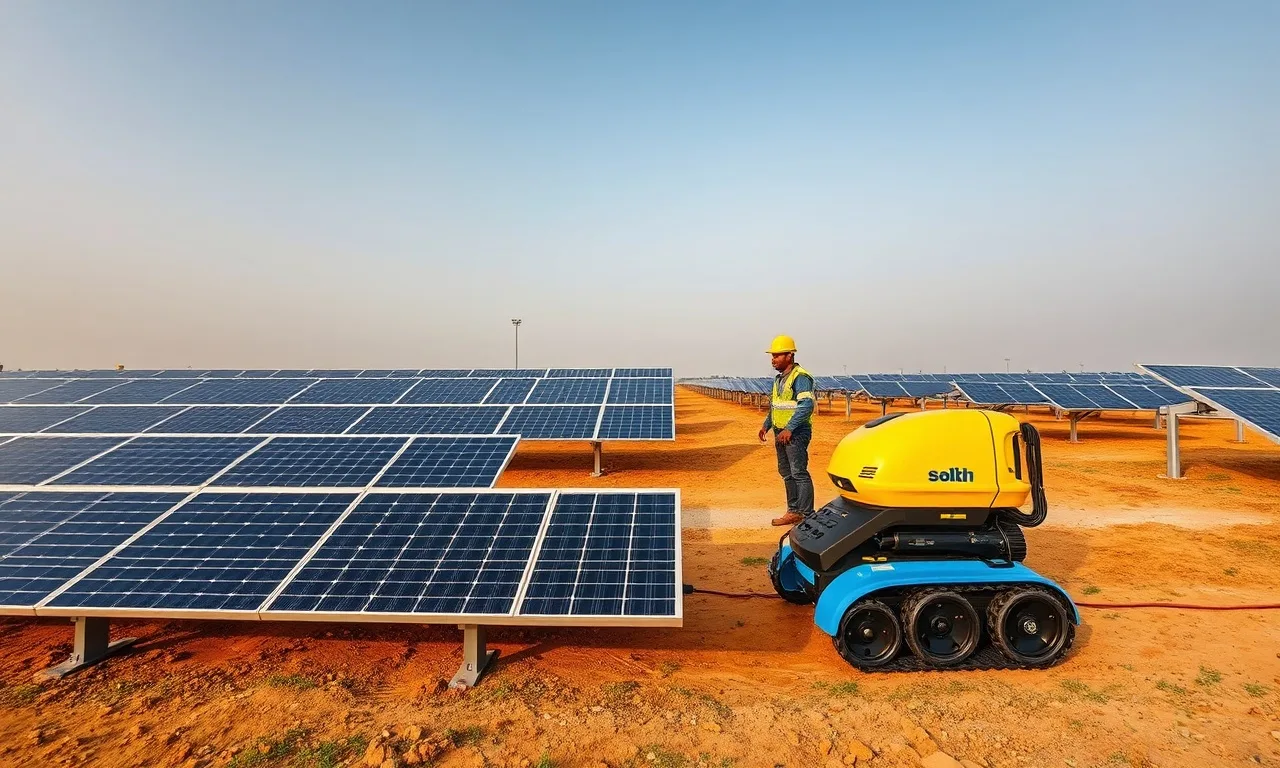
By classifying the soiling severity on a scale of 0 to 100%, the system correlates visual degradation with local weather data. This allows plant managers to distinguish between persistent soiling that requires cleaning and temporary phenomena like morning dew or shading from vegetation. Once the AI calculates the specific energy loss per row, it assigns a priority score. For utility-scale operators, this level of precision prevents the deployment of cleaning robots on rows that are only marginally affected, effectively extending the lifespan of your robotic fleet by limiting unnecessary cycles. This data-driven dispatch ensures that maintenance resources, such as the automatic solar panel cleaning systems, are only deployed when the incremental gain in energy yield outweighs the operational cost of the cleaning run.
Furthermore, this technology integrates directly into site operations by feeding diagnostic alerts into management platforms. When the AI detects a soiling index above a defined threshold, it automatically triggers a ticket for the maintenance team or commands the robot fleet to clean the affected zone. Asset owners should prioritize systems that offer edge-processing capabilities, as uploading high-resolution imagery for a 100 MW site can often strain standard site network bandwidth. For managers concerned with the integration of these systems into their existing workflows, our guide on solar O&M services provides detailed insights on how to align new diagnostic tools with standard site performance KPIs.
Step-by-step integration: From image capture to robot activation
Integrating AI-based image recognition into your O&M workflow requires a structured transition from data acquisition to automated field dispatch. The first step involves setting up high-resolution capture intervals, typically using drones for site-wide audits or fixed cameras on critical strings. For utility-scale plants in India, where dust accumulation patterns can vary significantly within a few hundred meters, imaging cycles should be aligned with the plant's soiling rate rather than a calendar schedule. You must ensure your telemetry system uploads this data in a compressed format to avoid network bottlenecks at the site.
Once the images are captured, the AI processes the visual data to identify soiling density. It classifies the soiling index on a scale, which is then mapped to the performance ratio (PR) impact. If the AI detects a soiling index that causes a drop in generation exceeding your predefined operational threshold, it triggers an intervention. For sites using automated fleets, this trigger signal is sent directly through the plant management software to the robotic system, such as those discussed in our guide to autonomous solar cleaning robots. This prevents manual intervention and ensures that cleaning occurs only on the specific rows or blocks that are underperforming.
To successfully integrate these tools into existing O&M routines, follow this deployment sequence:
- Baseline Mapping: Conduct a clean-panel audit to calibrate the AI model to your specific module technology and site environment.
- Threshold Configuration: Define intervention thresholds based on the cost of energy lost versus the incremental cost of a cleaning cycle.
- Automated Dispatch Integration: Connect the image-analysis output to your fleet management platform to automatically schedule robot deployment.
- Verification Loop: Use post-cleaning imagery to confirm the removal of soiling and update the AI model on the cleaning efficiency achieved.
By automating the decision-making process, plant managers can significantly reduce labor-related downtime. This approach is particularly effective when scaling operations, as shown in our analysis of fleet telemetry for Indian utility plants. By trusting the data-driven dispatch, you replace manual guesswork with surgical precision that optimizes your entire MW-scale portfolio.
Is AI-based image recognition for soiling detection plants accurate for Indian dust profiles?
AI-based image recognition for soiling detection is highly accurate for Indian dust profiles, provided the underlying machine learning models are trained on regional soil compositions. Indian utility-scale sites often face complex soiling profiles, ranging from fine cementitious dust in Rajasthan to coastal salt haze and organic residues from local vegetation. Standard generic models often struggle to differentiate between deep shading from nearby structures and uniform soiling layers; however, site-specific calibration allows AI to accurately classify these nuances. When deployed, these systems use visual patterns to identify the thickness and type of dust, allowing managers to predict performance loss with an accuracy often exceeding 90% compared to traditional manual inspections.
The efficacy of these systems is tied to the quality of image capture. In high-wind, high-dust regions like Gujarat and Rajasthan, frequent ambient particulate matter can degrade image clarity if cameras are not maintained or if drone flight paths do not account for atmospheric scattering. To maintain high accuracy, plant operators should implement a dual-stage verification loop where the AI-detected soiling index is validated against pyranometer and reference cell data. This cross-referencing ensures that the image recognition output is not misinterpreted as an electrical fault or degradation in the PV modules, as discussed in our guide to separating degradation from soiling loss. By combining visual data with physical performance metrics, you create a robust diagnostic tool that provides a true picture of site hygiene regardless of changing seasonal dust patterns.
Technical thresholds: When to trigger intervention
Setting the right intervention threshold is the bridge between unnecessary cleaning costs and lost revenue from performance degradation. For Indian utility-scale plants, relying on visual inspection alone leads to high variability in O&M execution. Instead, plant managers should define automated triggers based on a specific threshold of power output decline. A common industry-typical threshold is a 3% to 5% drop in the Performance Ratio (PR) compared to a clean, daily baseline. Once the AI system detects soiling levels crossing this percentage, it flags the row or block for an immediate cleaning cycle.
When establishing these thresholds for a 50 MW+ site, consider the following operational classification:
- Low Soiling (0–2% loss): No intervention required. Maintain the current cleaning schedule to preserve robot battery life and mechanical health.
- Moderate Soiling (2–5% loss): Schedule a cleaning cycle within the next 48 hours. This is the optimal window to recover generation before dust settles into harder-to-remove layers.
- High Soiling (>5% loss): Trigger an immediate deployment of autonomous cleaning assets. At this stage, the daily revenue loss often exceeds the daily amortized cost of running robotic systems, such as the fully autonomous robot fleets deployed in large-scale installations.
The sensitivity of these thresholds must be adjusted for site-specific conditions. For instance, in regions with high nocturnal humidity or dew, dust can solidify into crusts, making it harder to remove. In these scenarios, shorten the intervention threshold to a 3% loss to ensure that cleaning robots like those highlighted in our battery optimization guide can remove debris with a single or dual-pass cycle without requiring water. By linking your AI output directly to your dispatch platform, you ensure that you are only paying for the cleaning that directly protects your generation revenue. This surgical approach minimizes equipment wear while maximizing your PR recovery across the entire plant portfolio.
Operational costs and data infrastructure requirements
Integrating image-based soiling detection into a utility-scale O&M workflow requires more than just high-resolution cameras. For 50 MW+ plants in India, you need an edge-computing architecture capable of processing visual data locally before transmitting metrics to your fleet portal. Relying on raw image uploads from every row is bandwidth-prohibitive and creates unnecessary storage costs. Instead, deploy intelligent camera units that perform local pre-processing to filter out environmental noise, such as birds or glare, sending only the identified soiling index and metadata to your central system.
The cost structure for this implementation typically divides into three buckets. First, the capital outlay for sensor hardware and camera integration, which often ranges from 0.1% to 0.3% of the total plant cost. Second, the data processing layer, which includes the AI model subscription or on-site processing license. Third, the integration layer, where you connect your diagnostic outputs to autonomous cleaning dispatch platforms like NECTYR. By automating this link, you eliminate the manual dispatch delays that typically account for 10% to 15% of avoidable soiling revenue loss.
For optimal reliability, maintain a dedicated local network for your camera fleet that is independent of your plant SCADA system. This segregation ensures that high-bandwidth data transfers from your imaging sensors do not interfere with critical inverter communication or grid data packets. Furthermore, ensure your camera mounting systems are rated for the high-wind, high-heat conditions common in Rajasthan or Gujarat, as frequent replacement of damaged sensors will quickly negate the ROI of your detection system.
What plant managers should do next
- Conduct a site-wide soiling audit: Before investing in AI imaging, run a pilot program on one 5 MW block to calibrate your soiling thresholds against physical cleaning results.
- Audit your network capacity: Ensure your existing site-wide communication network can support real-time data transmission from localized imaging nodes without creating congestion.
- Standardize data inputs: Align your AI-based soiling reports with your existing performance ratio (PR) monitoring to verify that detected dust is the primary driver of generation drops.
- Schedule integration testing: Link your detection output to your robotic cleaning dispatch to ensure the system automatically prioritizes the most severely affected rows for service.
- Review local maintenance capability: Confirm that your on-site O&M team has the training to clean camera lenses and recalibrate sensor orientation as part of routine site maintenance.
Sources and further reading
Frequently asked questions
This technology replaces guesswork with granular telemetry by converting visual data into quantified performance loss metrics. It allows operators to identify specific rows requiring intervention, which optimizes cleaning cycles, reduces unnecessary labor costs, and minimizes water consumption by preventing over-cleaning.
Remote detection requires high-resolution image capture hardware, such as drones or fixed cameras positioned strategically across the site. These devices monitor specific module blocks to provide the visual record necessary for accurate soiling analysis.
While the frequency depends on site-specific dust deposition rates, automated image capture should be performed regularly to maintain a clear visual record of site health. Consistent data intervals ensure that operators can differentiate between localized organic soiling and uniform regional dust accumulation.
No, this technology is designed to complement existing workflows rather than replace them. By providing data-driven insights, it helps you direct your current manual or robotic cleaning teams to the exact locations that need attention, increasing the efficiency of your existing operations.