Summary for plant managers
In the evolving Indian solar landscape, cleaning data has become critical for institutional finance. Utility-scale operators must treat soiling logs as evidence for green bond compliance. They also serve the SEBI-mandated Business Responsibility and Sustainability Reporting (BRSR). By logging soiling loss and water use, managers provide the transparency needed to lower borrowing costs.
- Typical soiling loss: 10% to 30% energy yield impact depending on regional dust and seasonality.
- ESG Water Impact: Moving from water-based washing to dry robotic cleaning can cut water use by 90%.
- Compliance Threshold: Asset owners must track energy yield recovery and water use for SEBI BRSR and international green bond requirements.
- Reporting Frequency: Quarterly soiling audits and energy reviews satisfy investors that cleaning schedules are optimized for yield.
Without these metrics, plants face 'performance drift' where generation lags behind PPA commitments. This creates financial risk, as documented in Soiling Revenue Loss on Indian Utility Solar Plants. Integrating cleaning telemetry into your stack moves you beyond estimation. It ensures that lost generation is accounted for and water savings are documented. This approach helps maximize asset value while aligning with the Carbon Value of Lost Solar Energy for emission reporting.
The link between green bonds, ESG, and solar O&M data
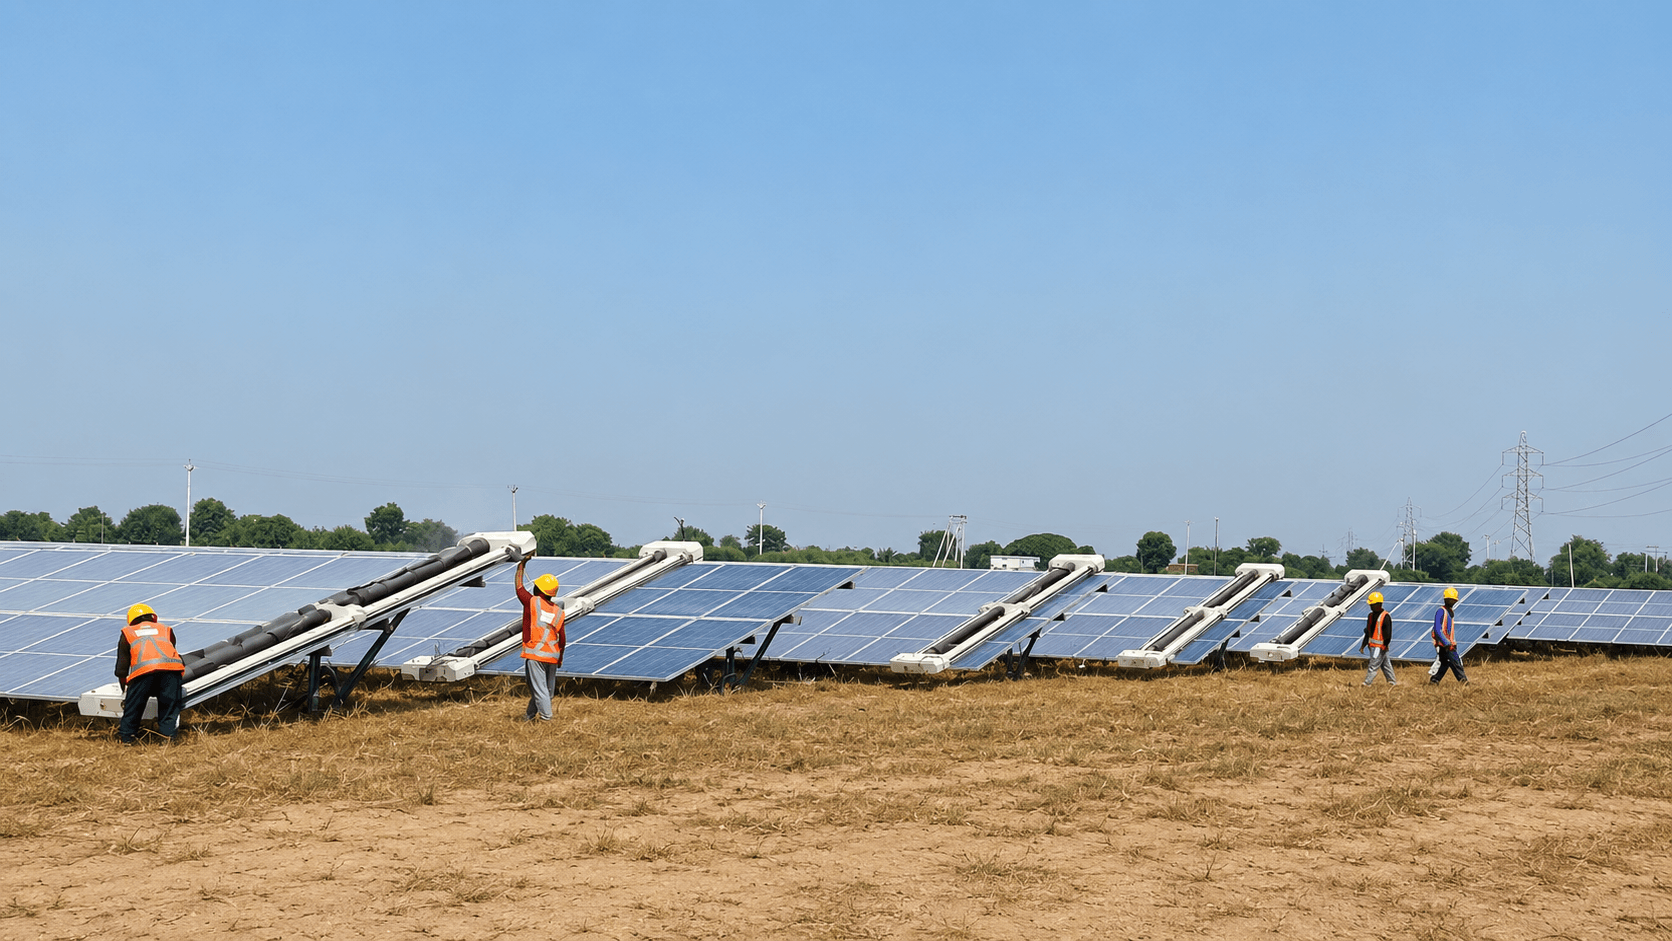
For utility-scale operators, green bonds represent a long-term commitment to transparency. Investors rely on plants to hit specific yield targets. If cleaning data is missing, the Performance Ratio (PR) degrades. This risks failing generation guarantees. Therefore, cleaning telemetry acts as a vital compliance document.
ESG reporting under the SEBI BRSR framework demands evidence of resource management. For a 50 MW plant in water-stressed regions, proving low water consumption is essential. Automated cleaning telemetry allows managers to report precise water-saving metrics. This transforms dry cleaning programs into a verifiable ESG contribution. This data connects technical performance to the non-financial mandates of green bond certification.
Integrating granular soiling logs removes the guesswork from PPA guarantees. A robust strategy tracking the link between dust storms and energy recovery defends against poor stewardship claims. This satisfies international climate finance requirements. It ensures every megawatt contributes to the 500 GW target through consistent, sustainable performance.
How does cleaning data support SEBI BRSR compliance in India?
SEBI BRSR mandates disclosures on resource efficiency, including water use. Manual water-based cleaning faces growing scrutiny. By tracking cleaning telemetry, you generate reports proving reduced freshwater withdrawal. This is a critical data point for the Environmental component of ESG disclosures.
Cleaning logs provide evidence for auditors. Instead of estimating water use, you provide precise data from autonomous cycles. This includes rows cleaned, deployment frequency, and PR recovery. This transforms raw data into environmental metrics to align with green bond goals. It demonstrates that the plant generates renewable energy with minimal operational impact.
This reporting structure involves three key data streams:
- Operational Water Metrics: Documenting the shift to waterless systems to show compliance with conservation mandates.
- Performance Recovery Logs: Linking cleaning events to real-time inverter yield data to show maintenance is optimized.
- Audit-Ready Documentation: Aggregating cleaning history into formats compatible with BRSR templates for transparency.
Digitizing these inputs transitions you from speculative reporting to a verified, data-driven narrative. This consistency is essential for answering investor queries about long-term portfolio health.
Quantifying environmental impact: Water use and energy yield
In water-scarce regions, automated dry cleaning provides a verifiable metric for green bond compliance. Manual cleaning uses 1 to 2 litres of water per module per cycle. For a project with 150,000 modules, this creates significant water footprint issues. Robotic cleaning eliminates this consumption, allowing a near-zero water footprint.
Energy yield recovery balances these resource-saving metrics. Indian utility plants see soiling losses between 10% and 30%. Automated cleaning can increase annual energy yield by 5% to 15%. This validates that the plant meets generation guarantees tied to interest rates. By correlating cleaning cycles with PR gains, managers satisfy rigorous international climate finance audits.
Reporting typically involves three core impact metrics:
- Water Displacement Ratio: Quantifying total freshwater saved by using robotic cleaning instead of tankers.
- Performance Ratio (PR) Delta: Using SCADA logs to confirm that cleaning cycles mitigate soiling losses.
- Annualized Emission Abatement: Translating recovered gigawatt-hours into avoided tCO2 metrics for ESG reporting.
This technical evidence creates a helpful feedback loop. When managers prove maintenance is efficient, they reduce the asset's risk profile. This stability is the core of transparent ESG reporting.
What specific cleaning metrics are required for green bond reporting?
Plant managers must shift from generation estimates to audited, granular cleaning metrics. Investors want proof that cleaning technology improves efficiency and energy yields. You must report data that links cleaning frequency to real-time soiling rates.
The following metrics are essential for green bond and BRSR reporting:
- Normalized Soiling Loss Percentage: Document energy lost between cycles compared to a clean reference.
- Water Intensity Per MWh: Track water volume used per megawatt-hour to show footprint reduction.
- Performance Ratio (PR) Recovery Index: Log the PR improvement after cleaning to confirm operational efficacy.
- Deployment Uptime and Fleet Health: Provide logs on robot availability to validate robust operations.
Integrating these KPIs into your disclosures provides a verifiable narrative. This transparency helps investors confirm your assets meet international standards.
A step-by-step process for integrating soiling data into ESG reports
Integrating cleaning data requires a structured aggregation of inputs rather than a system overhaul. Your goal is to move to audit-ready data streams. This aligns with your sustainability goals as discussed in soiling revenue loss analysis.
Follow these steps to meet institutional requirements:
- Establish Soiling Baselines: Use irradiance sensors to map dust accumulation over 30 days. This sets a threshold for cleaning triggers.
- Automate the Logbook: Use platforms like NECTYR to replace manual records. Automated logs provide an audit trail of every row cleaned.
- Correlate Cleaning with Revenue: Map cleaning cycles against energy generated. Calculate the avoided revenue loss to show economic value.
- Report Carbon Impact: Convert recovered MWh into avoided tCO2 using local grid factors. This supports your carbon value of lost solar energy reporting.
Following this approach turns raw maintenance data into a strategic asset. Documentation creates an ESG-compliant process that satisfies regulators and bondholders.
Key performance indicators (KPIs) for sustainable O&M
Plant managers must look beyond simple observations. Green bond compliance requires quantitative metrics that prove reliability. Focus on these indicators to provide the expected granularity:
- Water Intensity (L/MWh): Compare manual washing to waterless cleaning to show up to 90% in savings. This supports BRSR mandates.
- Energy Yield Recovery (MWh): Report the energy gained through optimized cleaning to prove active performance management.
- Soiling Rate vs. Cleaning Cadence: Track daily dust accumulation against frequency to show a proactive strategy.
- Avoided Carbon Emissions (tCO2e): Convert recovered MWh into avoided CO2 to satisfy climate impact reporting.
What plant managers should do next
ESG-aligned O&M requires a shift to digital management. Prioritize these actions to keep your assets attractive to green finance investors:
- Audit your data streams: Check if your SCADA or logs provide the data needed for audits.
- Evaluate waterless technology: Assess how moving to autonomous systems improves water intensity KPIs.
- Link telemetry with models: Work with finance teams to connect recovery data to revenue protection reports.
- Formalize reporting: Establish a quarterly schedule for reviewing soiling, water, and carbon KPIs.
Effective reporting proves the excellence of your solar portfolio. Treating cleaning data as a strategic asset protects your yields and ensures access to sustainable capital.
Sources and further reading
Frequently asked questions
In the evolving Indian solar landscape, cleaning data has become critical for institutional finance. Utility-scale operators must treat soiling logs as evidence for green bond compliance.
Transitioning from manual water based washing to dry robotic cleaning solutions can reduce operational water consumption by up to 90%. Documenting this reduction is essential for utility scale operators to demonstrate their commitment to environmental sustainability metrics under ESG frameworks.
Yes. Maintaining optimized cleaning schedules is critical because typical soiling losses in Indian utility plants range from 10% to 30% of energy yield. Quarterly soiling audits and energy performance reviews are recommended to satisfy bond investors that the plant is managed for maximum yield and transparency.
You should maintain granular, timestamped data on energy yield recovery and operational performance. Integrating cleaning telemetry into your reporting stack allows you to move beyond estimates, ensuring that every megawatt of generation lost to dust is accounted for and verified for SEBI BRSR and international green bond requirements.