Quick answer
- Daily soiling: 0.3 to 0.5% typical in west India dry season; up to 0.5% in storm months.
- 7 days uncleaned: roughly 3 to 5% generation loss; 90 days: 15 to 25%.
- Annual without systematic cleaning: 15 to 30% in Rajasthan desert belt; global average is 5 to 10%.
- Rajasthan: loose silica, good for dry-brush removal; Gujarat: mixed dust, salt, industrial cementation.
- Rain is not a reliable cleaning strategy on utility arrays in either state.
What Are the Average Soiling Losses for Solar Panels in Rajasthan and Gujarat?
India's highest-irradiance solar zones, Rajasthan and Gujarat, are also its most aggressive soiling environments. A plant that cleans on the wrong schedule in Barmer or Kutch doesn't just lose a few percentage points. It bleeds revenue every single day. This article consolidates peer-reviewed field measurements, NREL data, and utility-scale O&M observations to give you the actual numbers, and what to do with them.
Why Rajasthan and Gujarat Have India's Worst Soiling Problem
Both states sit in the arid and semi-arid belt of western India. Rajasthan covers the Thar Desert, one of the world's most dust-active regions. Gujarat's Kutch and Saurashtra districts experience persistent dry winds carrying fine silica particles, industrial aerosols from the petrochemical corridor, and seasonal dust storms (locally called andhi).
The dust composition in these regions is predominantly crustal, silica, metal oxides, and calcium salts, making it highly adhesive when combined with surface humidity at dawn and dusk. A study published in Solar Energy (Valerino et al., 2021) measuring soiling at Gandhinagar, Gujarat found that composition was greater than 95% crustal dust with no significant seasonal difference in particle chemistry. What changes is the rate of accumulation, and that changes dramatically.
Soiling Loss Numbers: What the Data Actually Shows
Daily Soiling Rate
Region / Study | Daily Soiling Rate | Source |
|---|---|---|
Gandhinagar, Gujarat (dry season) | 0.45 ± 0.10% per day | Valerino et al., Solar Energy, 2021 |
Gujarat field sites (2025) | Up to 0.47% per day | Nature Scientific Reports, 2025 |
Arid north India (general) | 0.1% – 0.3% per day | NREL / USPTO soiling measurement studies |
Rajasthan desert belt (worst case) | Up to 0.5% per day during dust storm months | TAYPRO field observations, 150 MW Chayan plant |
At 0.45%/day compounding over 60 dry days without cleaning, a plant loses approximately 23–25% of its rated output. At ₹3.50/kWh for a 100 MW plant generating 5 lakh units/day, that is ₹35–40 lakh in lost revenue per dry quarter, before accounting for cleaning costs.
Accumulated Loss Without Cleaning
Duration Without Cleaning | Estimated Generation Loss |
|---|---|
7 days | 3–5% |
30 days | 10–15% |
90 days (one dry quarter) | 15–25% |
One full year (without systematic cleaning) | 30–40% (with degradation compounding) |
Global average annual soiling losses are estimated at 5–10% (Ilse et al., 2018). India's western arid zone is consistently at the high end or above this range. IIT Delhi estimated that air pollution and dust alone cause 840 GWh of annual energy loss across India's solar fleet, and the concentration of that loss is heavily skewed toward Rajasthan and Gujarat, which host eight of India's ten largest solar parks.
What Makes Rajasthan Different from Gujarat
Both states are high-soiling environments, but the soiling character differs in ways that affect cleaning strategy.
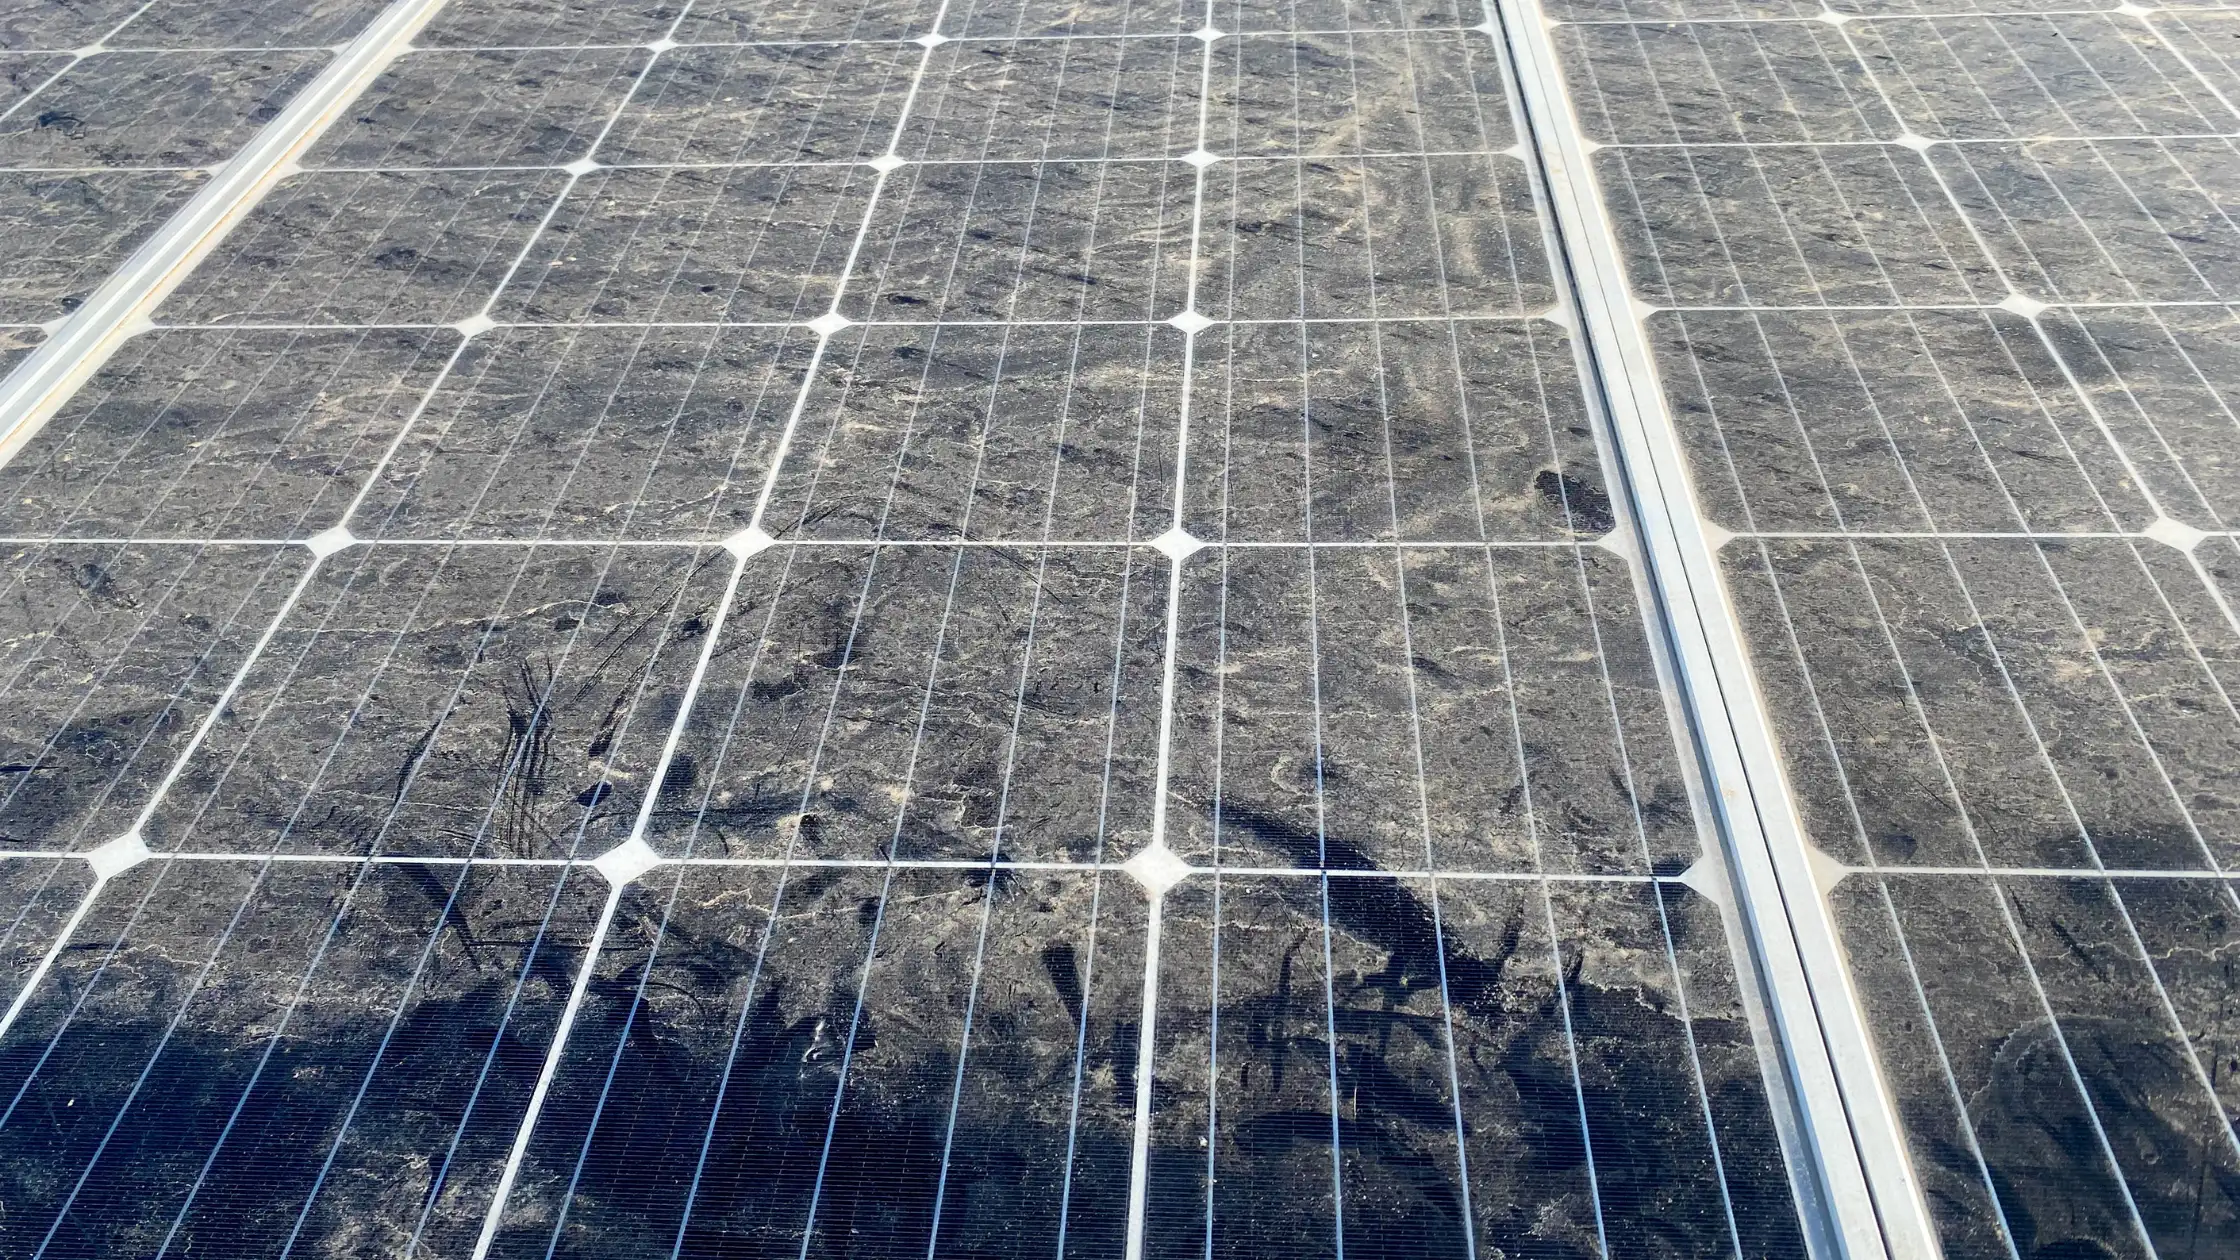
Rajasthan (Thar Desert belt, Barmer, Jodhpur, Jaisalmer, Bikaner): Extremely fine silica particles (PM2.5–PM10 range). Dry deposition dominates. Soiling is loose and brushable but accumulates faster due to high wind activity. Dust storms can load 5–10% additional soiling in a single event. The dry-cleaning advantage is highest here, microfibre systems remove fine silica effectively without water.
Gujarat (Kutch, Saurashtra, Banaskantha): Mixed soiling profile, desert dust combined with coastal salt aerosols and industrial particulate from the Jamnagar and Vadodara corridors. The Gandhinagar study found that monsoon humidity triggers cementation reactions on panel surfaces, forming calcium salt crusts and carbon-rich caking masses. These are harder to remove with dry brushing alone and represent a risk of permanent soiling if panels are not cleaned within 2–3 weeks of post-monsoon drying.
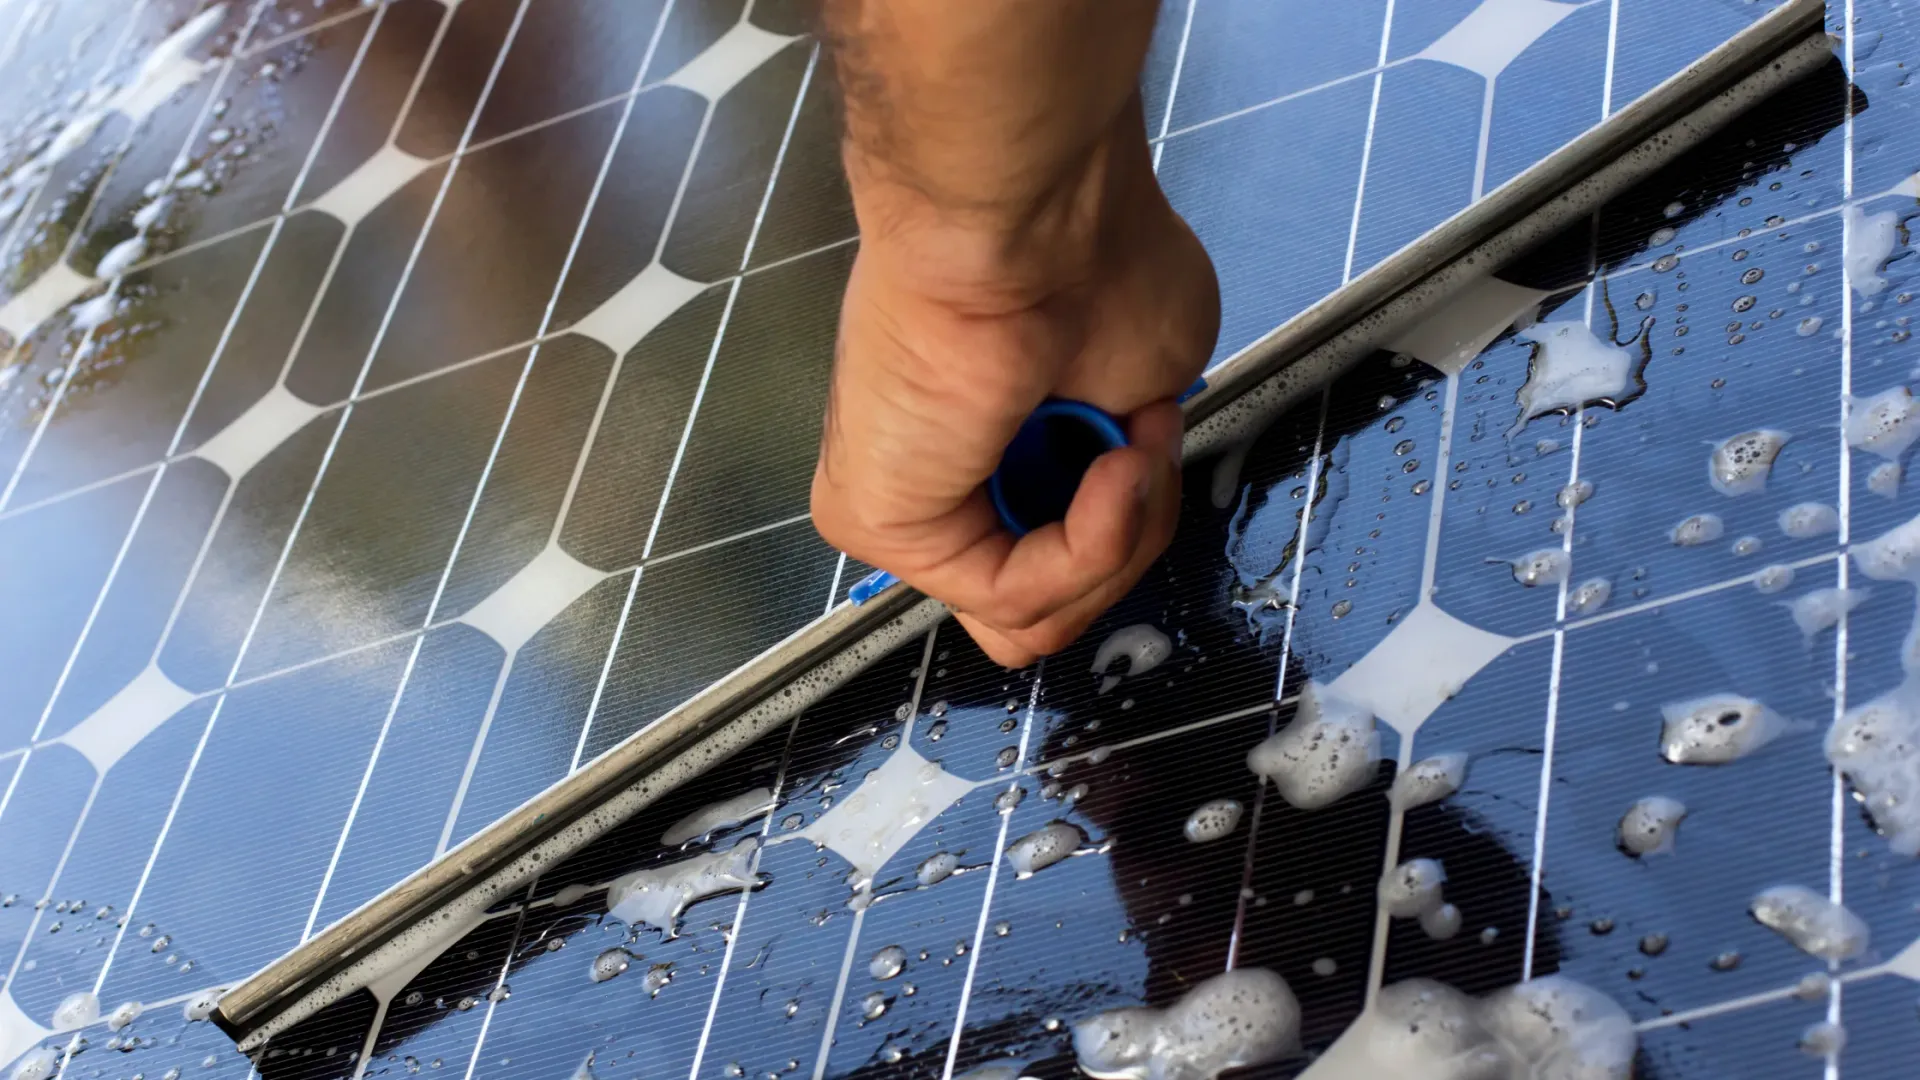
The Role of Rain: Why Monsoon Is Not a Free Cleaning Cycle
A common assumption in solar O&M is that the monsoon season effectively resets soiling. The data contradicts this. The Gandhinagar study found that while monsoon rains caused a 90% reduction in deposited PM10 mass, the mass of PM2.5 particles more than doubled after rainfall. Fine particles suspended in humid air deposit onto wet panel surfaces, bind more strongly, and are significantly harder to remove once dry.
Additionally, rain drives moisture into the mounting structure micro-gaps, promoting fungal growth that becomes visible on panel surfaces within 3 weeks of consistent humidity. This is not addressable with waterless dry cleaning and requires periodic wet intervention in high-humidity coastal zones of both states.
The net result: post-monsoon soiling in Gujarat requires aggressive cleaning in October–November, not a relaxed schedule. Pre-monsoon soiling in both states (April–June) is the most financially damaging period of the year.
How TAYPRO Quantifies and Addresses Soiling in These Regions
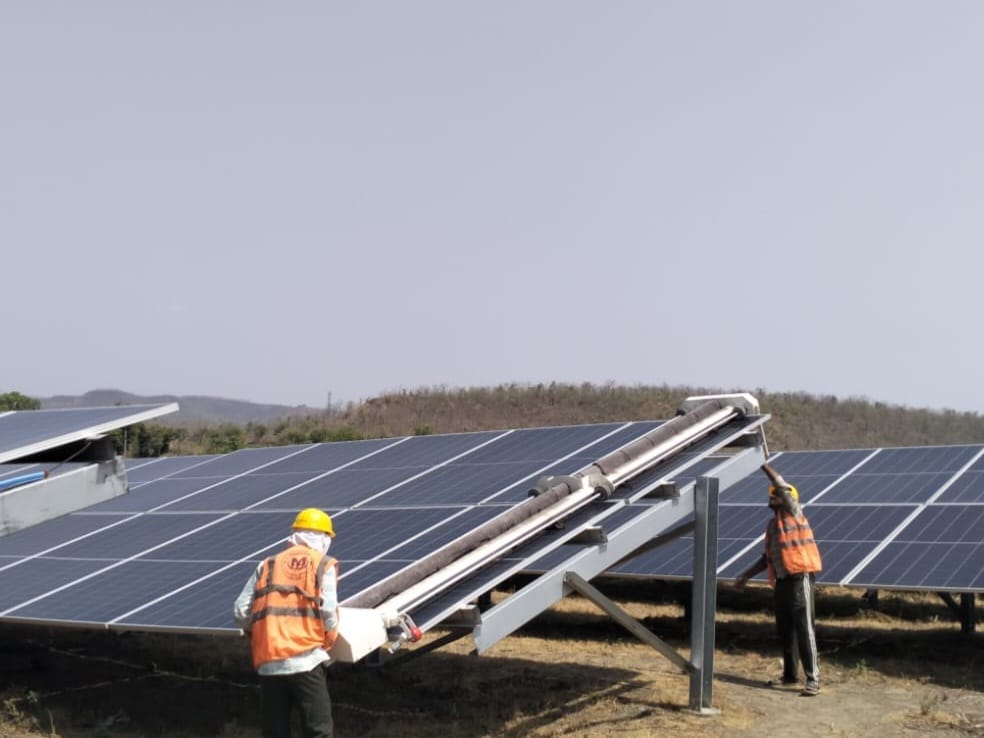
TAYPRO's GLYDE and GLYDE-X robots are deployed across utility-scale plants in Rajasthan and Gujarat, including a 150 MW site in Chayan, Rajasthan. Measured outcomes from that deployment: 6.75 million kWh of recovered generation, ₹27.2 lakh in saved labour costs, and 1.63 crore litres of water conserved in a single operating cycle.
TAYPRO's NECTYR fleet management software logs soiling-linked PR drops at string level, enabling site-specific cleaning frequency decisions rather than fixed calendar schedules. In Rajasthan desert-belt plants, NECTYR data consistently shows PR degradation beginning within 48–72 hours of cleaning in peak summer, pointing to an optimal cleaning interval of 3–4 days rather than the weekly schedules many operators default to.
The ORION AI layer (currently in development) is being designed to correlate soiling accumulation rate with satellite aerosol optical depth data and local wind speed, enabling predictive dispatch of the cleaning fleet before the soiling threshold crosses the economically optimal trigger point.
Key Takeaways for O&M Teams and Asset Managers
In Rajasthan and Gujarat, assume a baseline soiling rate of 0.4–0.5% per day during dry months (October–June), not the global average of 0.1–0.3%.
A plant cleaning once per week in these conditions is still losing 2–3% of generation per cycle compared to daily cleaning, roughly ₹7–10 lakh per MW per year at current tariffs.
Post-monsoon is not a low-priority window. PM2.5 cementation in Gujarat requires cleaning within 2 weeks of monsoon exit, typically September–October.
Soiling loss in these regions is not a maintenance line item, it is a revenue loss item. Model it as such in your asset P&L.
Waterless robotic cleaning at high frequency is economically optimal in both states. The water scarcity argument is secondary; the revenue recovery argument is primary.
Related resources
For procurement and O&M teams evaluating robotic cleaning in India:
- waterless vs water-based solar cleaning
- robotic vs manual solar panel cleaning
- solar panel cleaning robots in Rajasthan
Related reading
Frequently asked questions
Field data in Gujarat dry season shows daily soiling near 0.45 percent per day at Gandhinagar-class sites. Sixty dry days without cleaning can cost 23 to 25 percent of rated output. Rajasthan desert plants without systematic cleaning often see 15 to 30 percent annual loss; weekly cleaning can hold residual loss to 3 to 6 percent.
In Barmer, Jodhpur, and Jaisalmer desert belts, annual losses without systematic cleaning commonly range 15 to 30 percent of rated generation. With weekly cleaning, residual losses typically fall to 3 to 6 percent annually. Daily or near-daily robotic cleaning can keep residual loss below 2 percent in optimized programs.
Not exactly. Rajasthan is dominated by loose fine silica from the Thar Desert, which responds well to dry brushing. Gujarat mixes desert dust with coastal salt aerosols and industrial particulate, producing harder cemented films after humidity cycles, especially post-monsoon. Cleaning timing matters more on Gujarat coastal-influenced sites.
No for utility operations. Rajasthan desert rainfall averages below 300 mm annually, insufficient to rinse GW-scale arrays. Gujarat monsoon rain can reduce coarse dust but increases fine PM2.5 deposition and cementation on modules. Neither state should rely on rainfall as a primary cleaning mechanism.
Model daily soiling rate, electricity tariff, and per-cycle clean cost. At roughly 0.45 percent per day soiling and ₹3.50 per kWh, daily or every-other-day cleaning is often economic above 10 MW. Use reference modules or soiling stations to calibrate rather than fixed calendar dates alone.