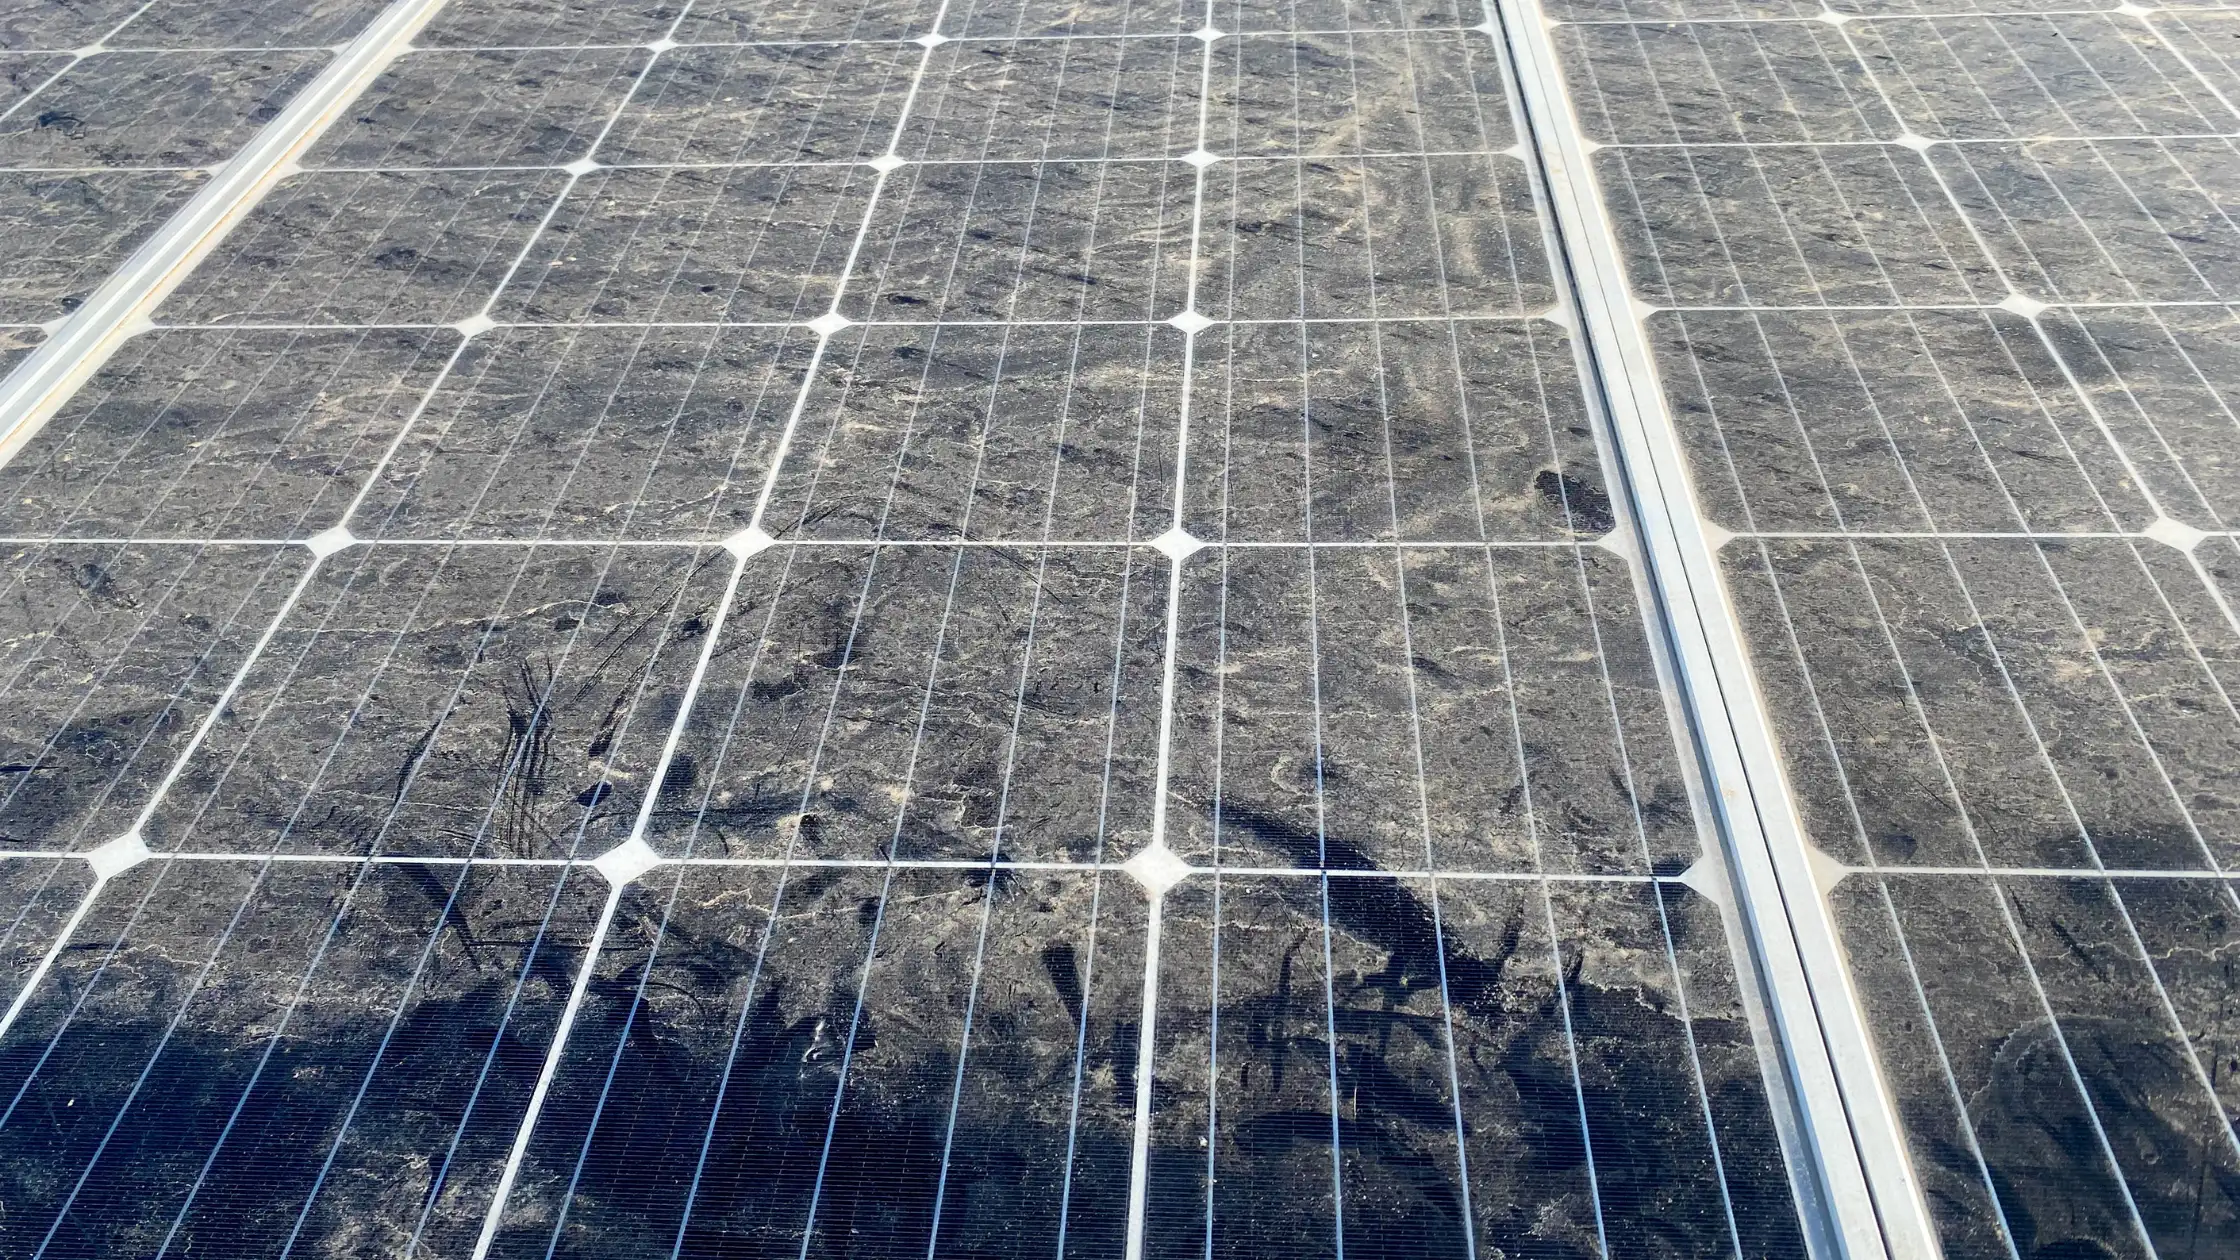
Carbon pricing and ESG reports often ignore a simple operational leak: dust on modules. For Indian utility portfolios selling green power or reporting avoided emissions, soiling is both a performance ratio problem and a carbon accounting gap between modeled and delivered MWh.
This article gives plant managers and sustainability leads a worksheet to translate soiling loss into tCO2 language, then fold that into capex decisions for cleaning, robots, and waterless programs. Finance still signs cheques in rupees. Carbon framing helps O&M compete fairly with other abatement spends in board packs.
Quick answer
- Lost MWh from soiling equals lost avoided emissions at your grid factor.
- Translate PR loss to tCO2 so cleaning competes with offsets and efficiency projects.
- Use consistent factors (CEA, GHG Protocol market-based where applicable).
- Pair carbon narrative with ₹/MWh. Both metrics should clear hurdle rates.
- Document cleaning in sustainability reports as performance integrity, not greenwash.
From dust to tCO2: a utility worksheet
Example structure for a 50 MW plant in Rajasthan:
- Baseline expected MWh (P50 or annual budget)
- Actual MWh shortfall attributed to soiling (reference modules or PR attribution model)
- Grid emission factor (tCO2/MWh) per corporate policy
- Foregone avoidance = shortfall MWh × factor
- Optional: multiply tCO2 by internal carbon price (₹/tCO2) for capex ranking
| Soiling loss | Approx. annual MWh lost (50 MW illustrative) | tCO2 at 0.7 t/MWh factor | Internal carbon value at ₹1,500/tCO2 |
|---|---|---|---|
| 3% | ~1.2 GWh | ~840 tCO2 | ~₹12.6 lakh |
| 5% | ~2.0 GWh | ~1,400 tCO2 | ~₹21 lakh |
| 8% | ~3.2 GWh | ~2,240 tCO2 | ~₹33.6 lakh |
Numbers are illustrative. Use site-specific yield and your approved factor. The point is magnitude: soiling is material in carbon language, not just PR charts.
Worked example: dual hurdle for a cleaning robot pilot
A 30 MW fixed-tilt block runs at 4.5% soiling loss through dry season. Annual budget generation is roughly 48 GWh.
- Soiling shortfall: ~2.16 GWh
- At 0.71 tCO2/MWh (illustrative CEA-class factor): ~1,530 tCO2 foregone
- PPA revenue loss at ₹3.50/kWh: ~₹7.56 crore
- Proposed waterless robot program: ~₹1.2 crore annual fully loaded cost
- Expected loss reduction to 1.5%: recover ~1.44 GWh (~₹5.04 crore revenue plus ~1,020 tCO2)
Revenue test passes clearly. Carbon test passes if the organization values avoidance above ~₹1,200/tCO2 on the incremental abatement. Use cleaning ROI tools with your tariff and soiling curve.
Why sustainability teams should care about O&M
Boards set internal carbon prices for capex ranking. Cleaning and waterless robotic programs clear hurdles faster when:
- Offtakers contract on delivered green MWh, not nameplate capacity.
- REITs and infrastructure funds report intensity metrics to global investors.
- Banks link DSCR to performance vs energy model assumptions that included cleaning.
- Corporate buyers audit Scope 2 avoidance claims tied to supplier renewable output.
Operations is where sustainability meets cash. A dust layer is invisible in a glossy annual report until someone reconciles modeled vs metered MWh.
Carbon pricing vs cleaning economics: dual test
Run both tests for any project:
| Test | Pass condition | Typical data source |
|---|---|---|
| Revenue test | Recovered PPA value > fully loaded cleaning cost | SCADA, PPA tariff, O&M invoices |
| Carbon test | Foregone avoidance value > incremental O&M | Emission factor, internal carbon price |
| Water / ESG test | Waterless option reduces stress metrics in disclosed zones | Water logs, state withdrawal rules |
Winning projects pass at least one test strongly; best pass all three. See cleaning robot price guide India and 10 MW cost comparison for the cost side.
Reporting without greenwashing
Disclose in sustainability packs:
- Method to attribute loss to soiling vs curtailment vs equipment faults
- Cleaning frequency, methods, and coverage logs
- Water use where water-stress zones apply
- Reference module or sensor calibration dates
Avoid claiming extra carbon credits for cleaning. Report restored performance integrity and recovered avoided emissions against your baseline.
How does soiling compare to other plant carbon leaks?
| Leak type | Character | Preventability |
|---|---|---|
| Soiling | Continuous, seasonal | High with cleaning program |
| Inverter downtime | Episodic | Medium with spares and analytics |
| Curtailment | Policy / grid driven | Low at plant level |
| Tracker faults | Row-level shadows | High with maintenance discipline |
For many dusty Indian fleets, soiling is the largest preventable gap between modeled and actual avoided emissions. Technical context: soiling losses in Rajasthan and Gujarat and why cleaning matters on utility plants.
Integrating carbon language into O&M contracts
Asset managers can add optional clauses:
- Monthly soiling attribution report in MWh and tCO2
- Cleaning SLA tied to PR recovery, not calendar dates alone
- Water disclosure for wet methods in stressed districts
- Post-storm response windows with financial consequences for missed thresholds
This aligns contractor incentives with both PPA revenue and ESG narratives without inventing new credit instruments.
Board pack template: soiling as carbon leakage
One slide asset managers can reuse monthly:
- Metered MWh vs budget MWh (gap)
- Gap attributed to soiling via reference modules (MWh)
- Grid emission factor applied (tCO2)
- Internal carbon price applied (₹)
- Cleaning spend month to date (₹)
- Net: restored avoidance vs incremental O&M
This format connects operations to sustainability without inventing new credit products. Pair with revenue impact of soiling for dual currency storytelling.
Waterless cleaning and carbon narratives together
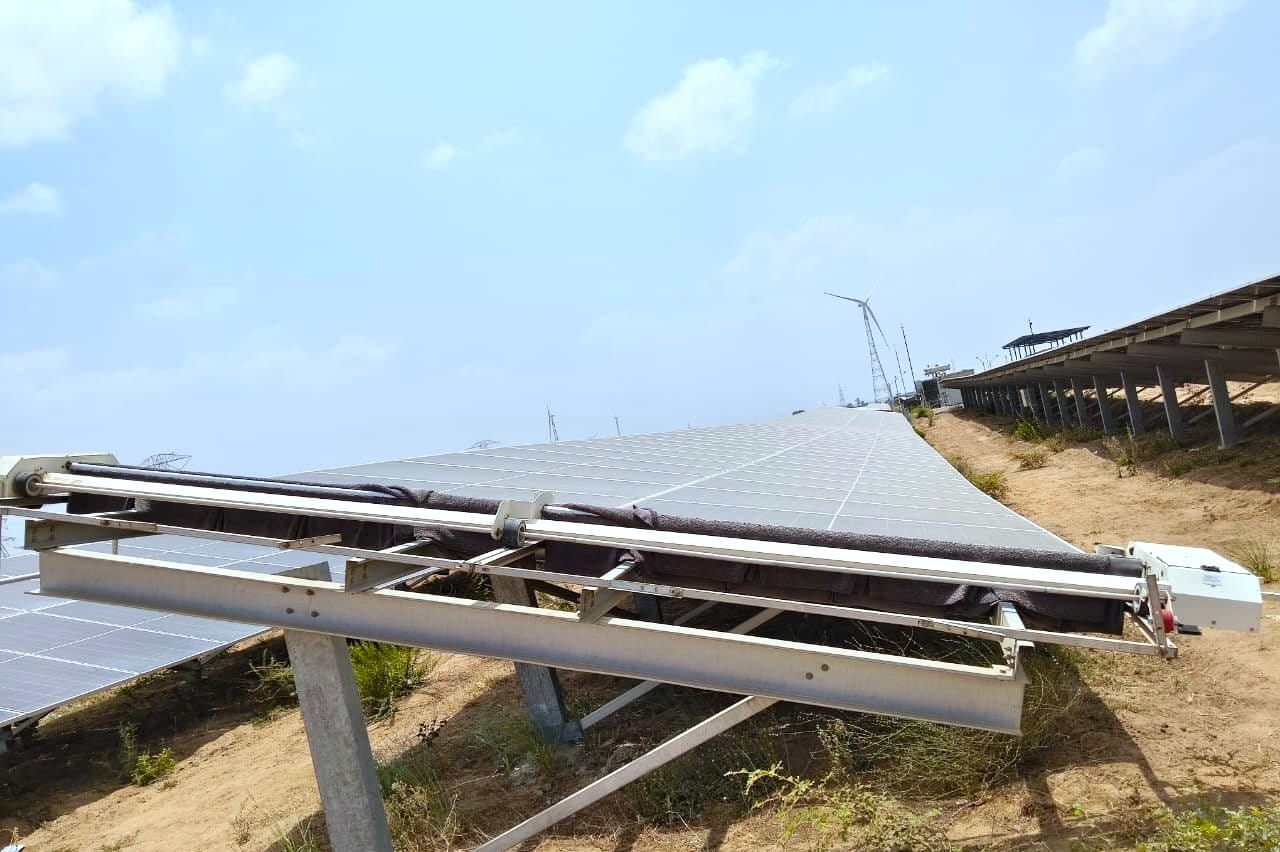
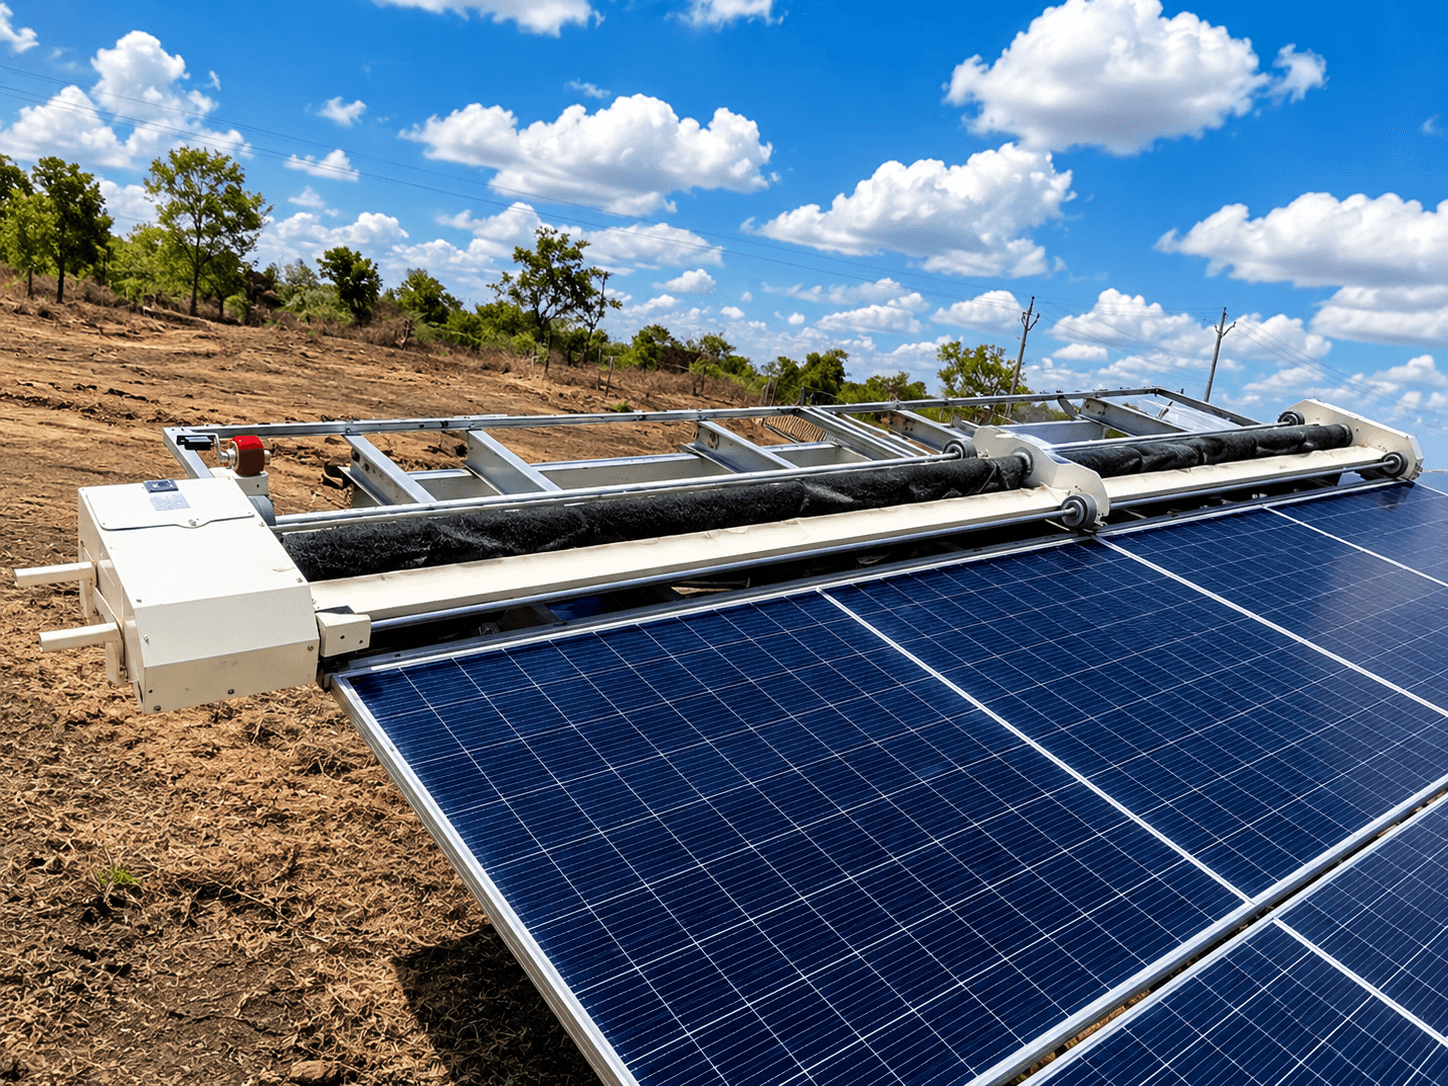
Waterless robotic programs score on two ESG axes: restored MWh (avoided emissions) and reduced freshwater withdrawal in stressed districts. When internal carbon prices alone do not clear robot capex, combined water and carbon disclosure sometimes tips portfolio committees, especially for funds with explicit water intensity targets.
Read water and O&M savings from waterless cleaning and method comparison for the operational side of the same story.
Scope 2 and market-based reporting context
Indian corporate buyers reporting Scope 2 may use location-based or market-based grid factors. Soiling loss reduces delivered renewable MWh regardless of method. When your offtaker contracts on delivered green power, dust creates a delivery gap that shows up in supplier scorecards before it shows up in carbon registries.
Translate that gap into tCO2 using the same factor your buyer uses. Misaligned factors between seller and buyer create audit friction in annual sustainability reviews.
Portfolio rollup example
Three-plant portfolio, 150 MW total, blended 4% soiling loss on two dusty Rajasthan assets and 1.5% on a Karnataka asset:
- Combined foregone MWh: roughly 4-5 GWh illustrative annual
- At 0.7 tCO2/MWh: roughly 2,800-3,500 tCO2 foregone avoidance
- At ₹1,500/tCO2 internal price: roughly ₹42-52 lakh carbon-equivalent value
- Centralized robot program costing ₹2 crore/year may clear both revenue and carbon hurdles if loss reduction holds
Roll up MWh first at plant level, then aggregate. Average soiling across portfolios hides the dusty assets that need surge spend.
FAQ for sustainability committees
Are we creating new carbon credits by cleaning? No. You are restoring the avoided emissions you already promised when you financed the plant. Should we use carbon value instead of PPA value? Use both; finance approves on rupees, ESG committees often want tCO2. What if our factor differs from the offtaker? Align in contract or show both in monthly packs to prevent year-end surprises.
Share monthly soiling attribution with sustainability and finance in the same report so both teams argue from one MWh number, not parallel spreadsheets.
Key takeaways
- Quantify soiling in MWh first, tCO2 second.
- Use carbon framing to unlock O&M budget, not to replace ROI math.
- Align factors with corporate reporting standards across the portfolio.
- Treat cleaning as delivering contracted green output.
Include soiling-related MWh loss in carbon narratives only when backed by metered data. Estimated losses undermine ESG credibility with sophisticated offtakers.
Related reading
Frequently asked questions
Soiling reduces renewable MWh, which may be replaced on the grid by fossil generation in marginal dispatch scenarios. The avoided emissions you forgo scale with lost solar output and the grid emission factor used in your reporting.
Multiply lost MWh by your approved grid emission factor (e.g., CEA or corporate factor). On a 50 MW plant, 5% annual energy loss can represent thousands of tCO2 equivalent in foregone avoidance if those MWh would have displaced thermal power.
Yes when internal carbon prices or offtaker ESG clauses value avoided loss. Compare cleaning capex and opex to carbon value of recovered MWh plus direct revenue, whichever governance metric your board uses.
No. Generation credits and certificates reflect produced MWh. Soiling talk is about MWh you failed to produce because of dust, an operations leakage line, not a new credit type.
Many use Central Electricity Authority grid factors for location-based reporting, or market-based factors if your offtaker contract specifies them. Consistency across the portfolio matters more than picking the highest factor for optics.
Frame cleaning as performance integrity: restoring contracted green MWh and avoided emissions. Avoid claiming new carbon credits for cleaning itself. Disclose water use in stressed districts alongside tCO2 restored.