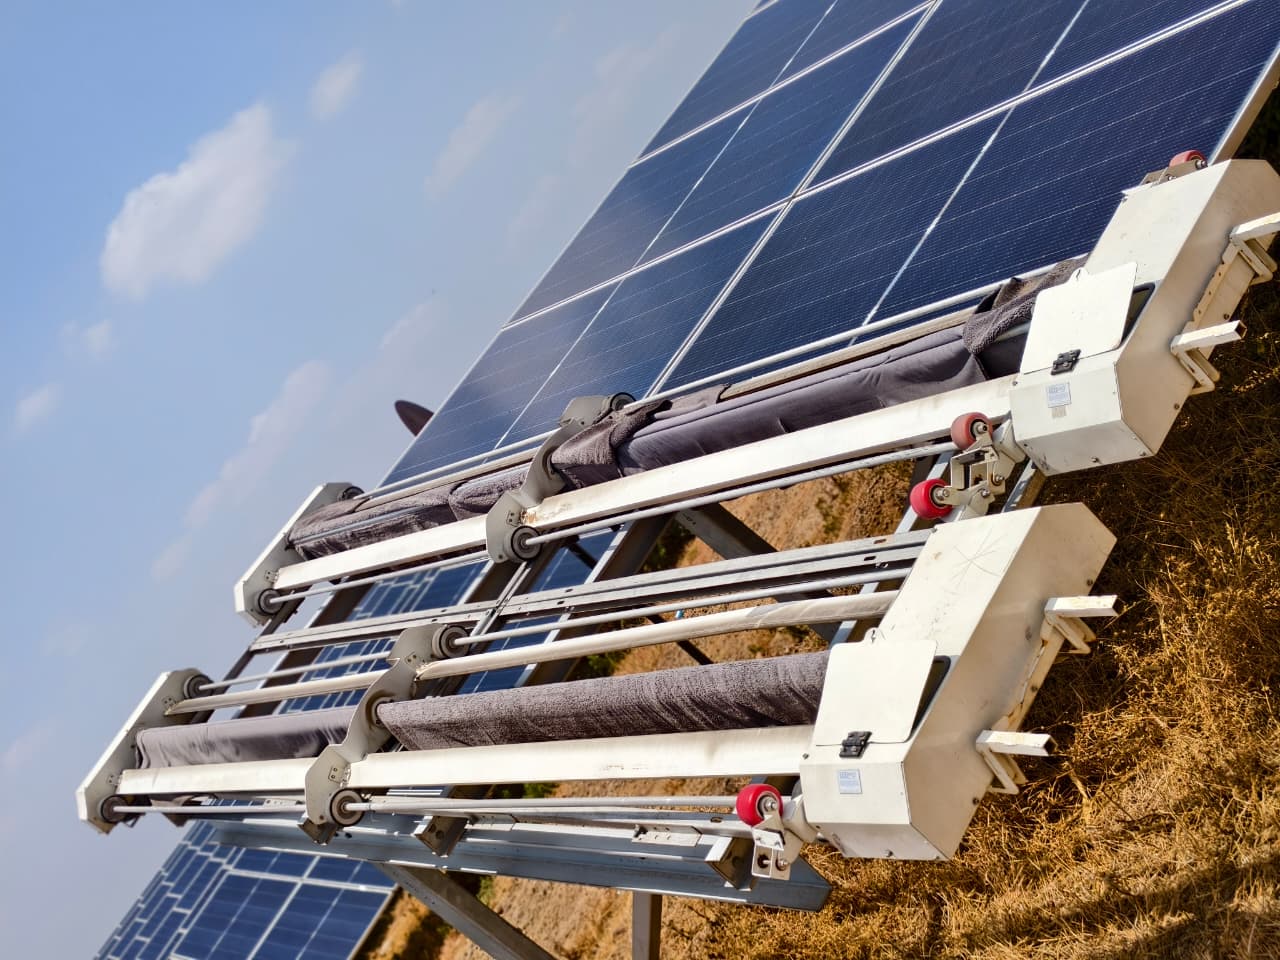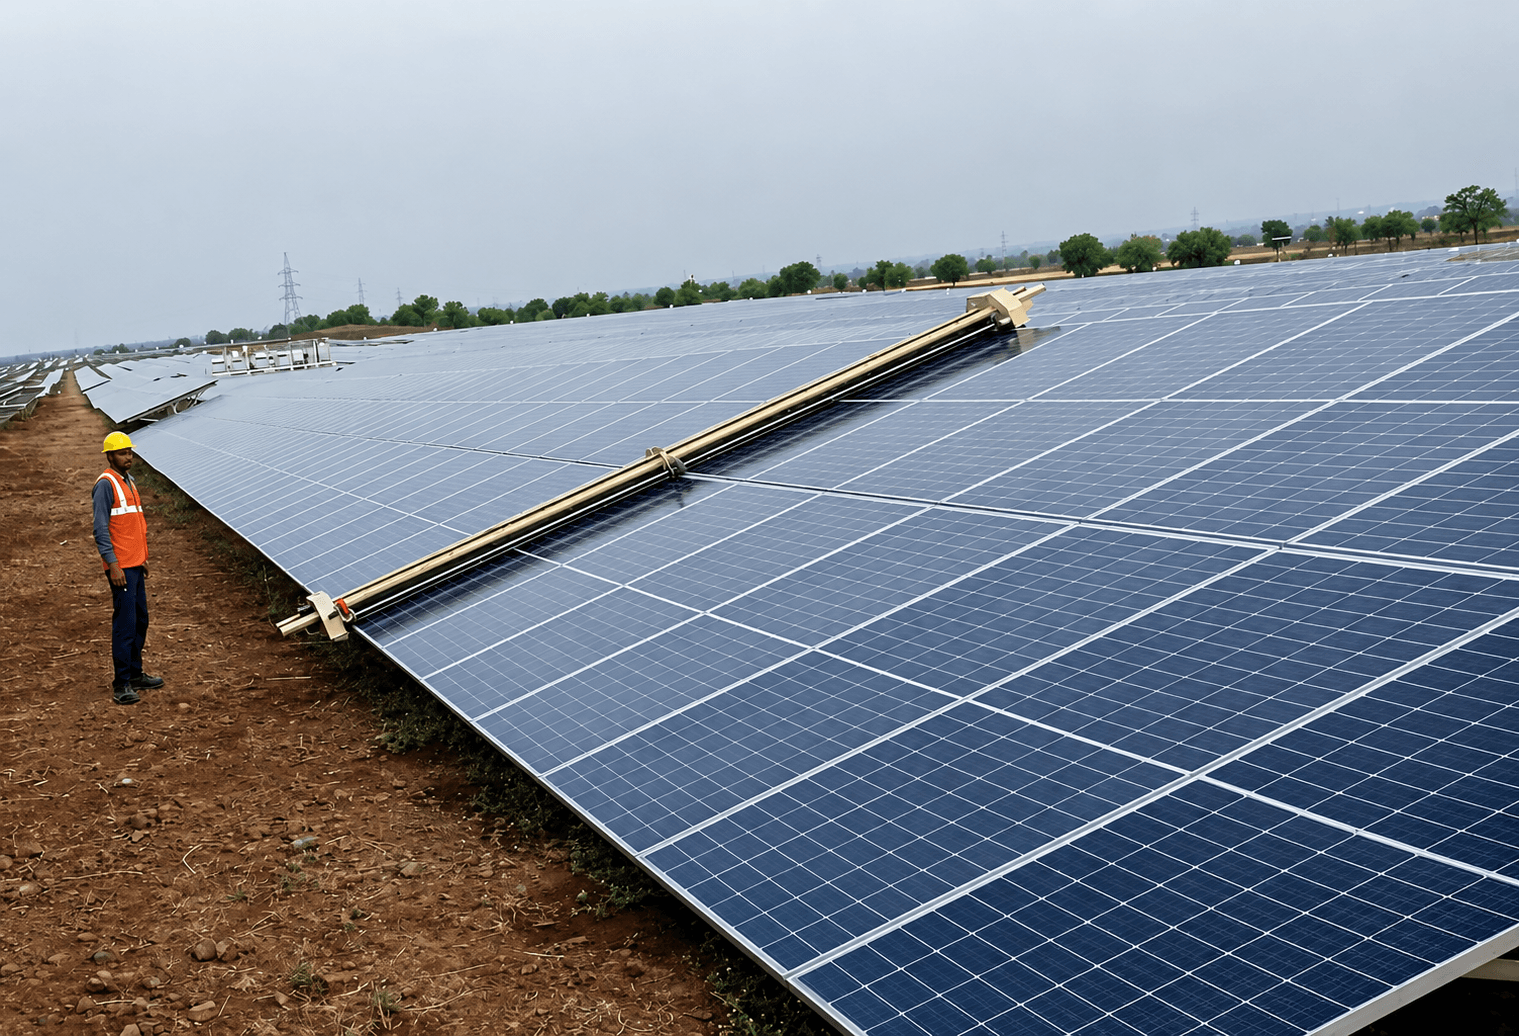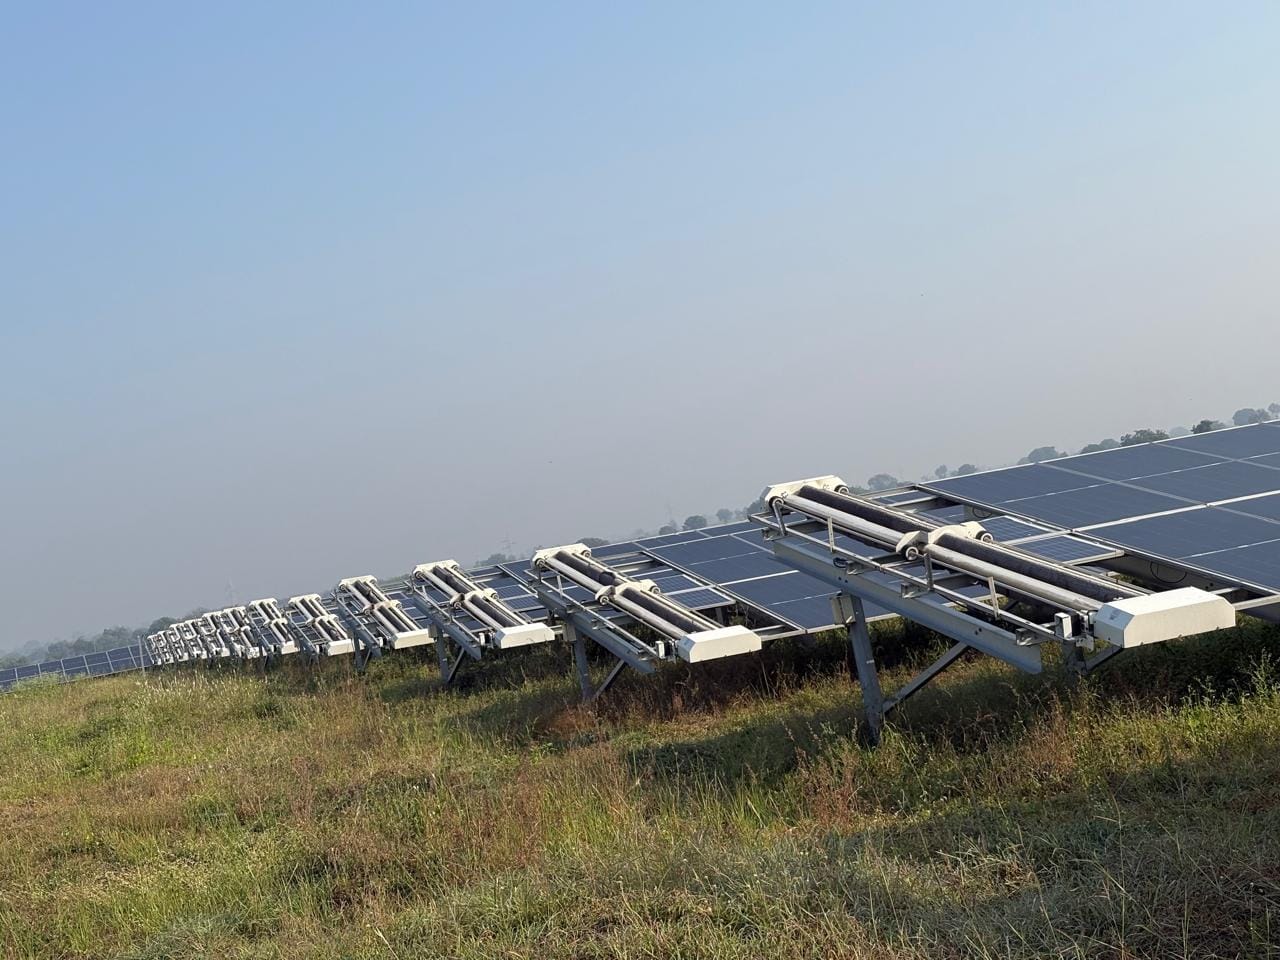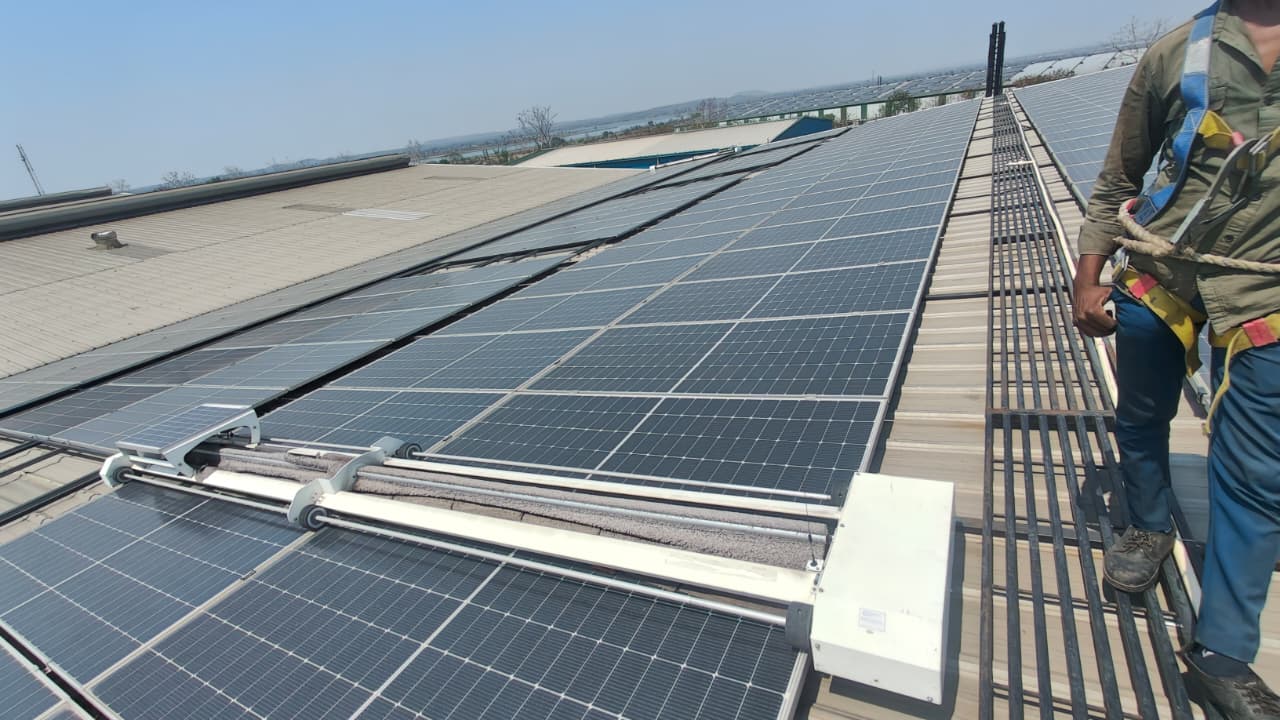
The Mid-Summer Yield Gap: A 5-MW C&I Rooftop Scenario
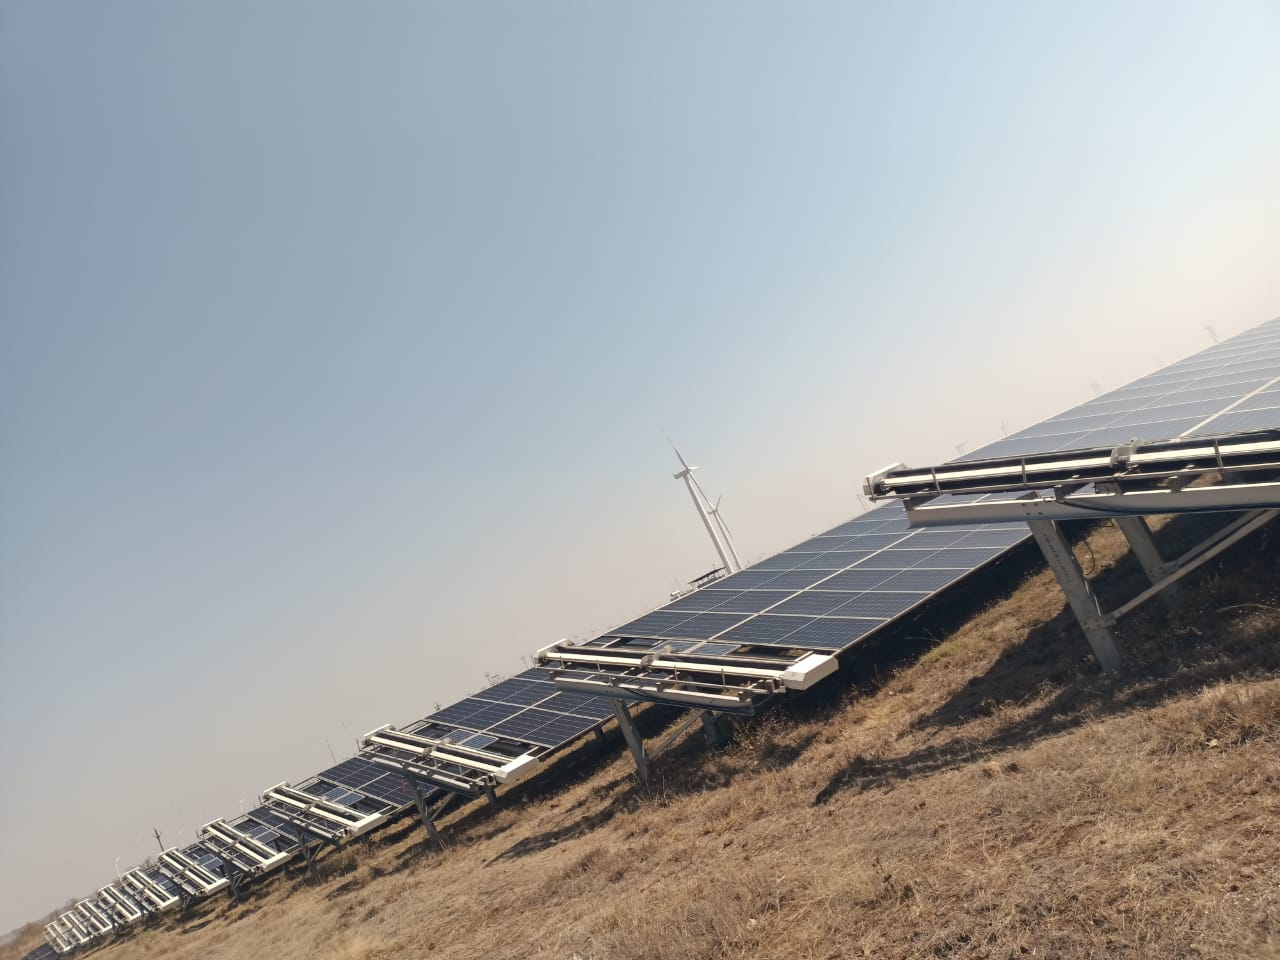
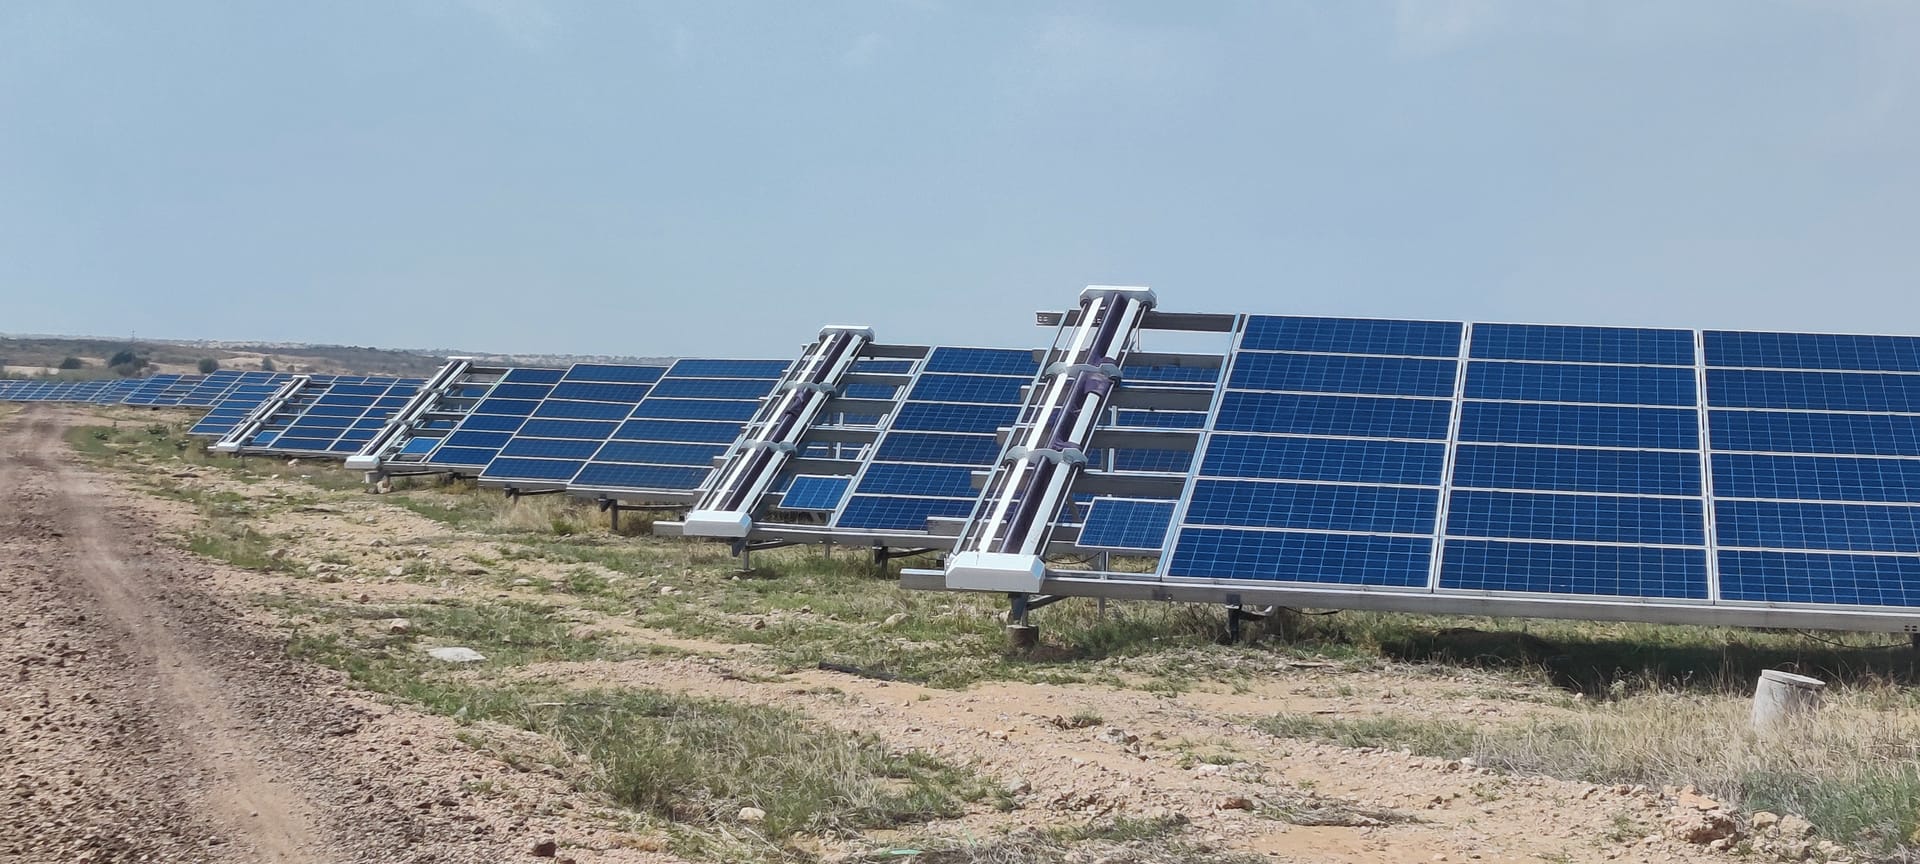
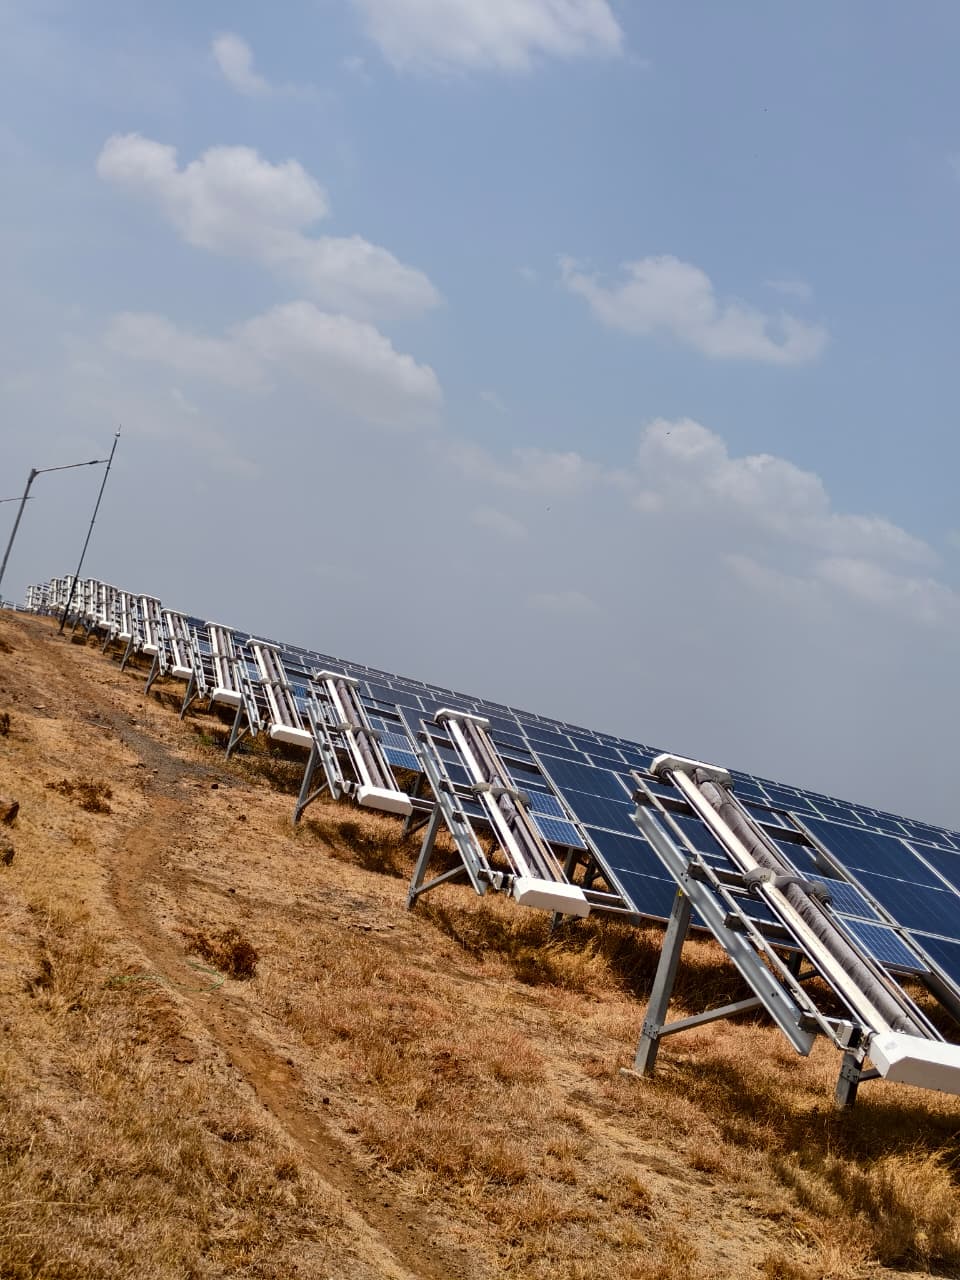
For a 5-MW commercial and industrial (C&I) rooftop plant in a region like Maharashtra or Uttar Pradesh, soiling is rarely a uniform occurrence. In high-dust industrial corridors, operators often observe soiling losses of 0.39% per day during the peak dry months from March to June. Across a standard 5-MW installation, this accumulates into a significant revenue deficit if left unmanaged for the duration of a typical monthly cleaning cycle. By the end of a 30-day period without intervention, cumulative soiling losses can reach 10% to 15%, directly eroding the plant performance ratio (PR) and impacting the return on investment (ROI) that the initial capital expenditure (CAPEX) was modeled to deliver.
Understanding the gap between theoretical yield and actual generation requires site-specific monitoring. When evaluating the economics of a rooftop array, plant managers must account for the specific pitch and mounting height of the canopy, as these factors dictate both the severity of dust accumulation and the logistical difficulty of manual intervention. Unlike ground-mount utility systems, rooftop assets present unique safety and access constraints that elevate the cost of traditional cleaning methods. These logistical hurdles are a primary factor that leads IPPs to look beyond manual labor toward more predictable, data-backed O&M models. For deeper insights into managing these operational expenses, you can review our guide on solar cleaning OPEX pricing. Properly balancing these O&M commitments is essential for maintaining the performance ratio that justifies the initial procurement of PV modules, as discussed in our analysis of long-term O&M costs.
Rooftop vs. Ground-Mount: Navigating Access and Safety Constraints
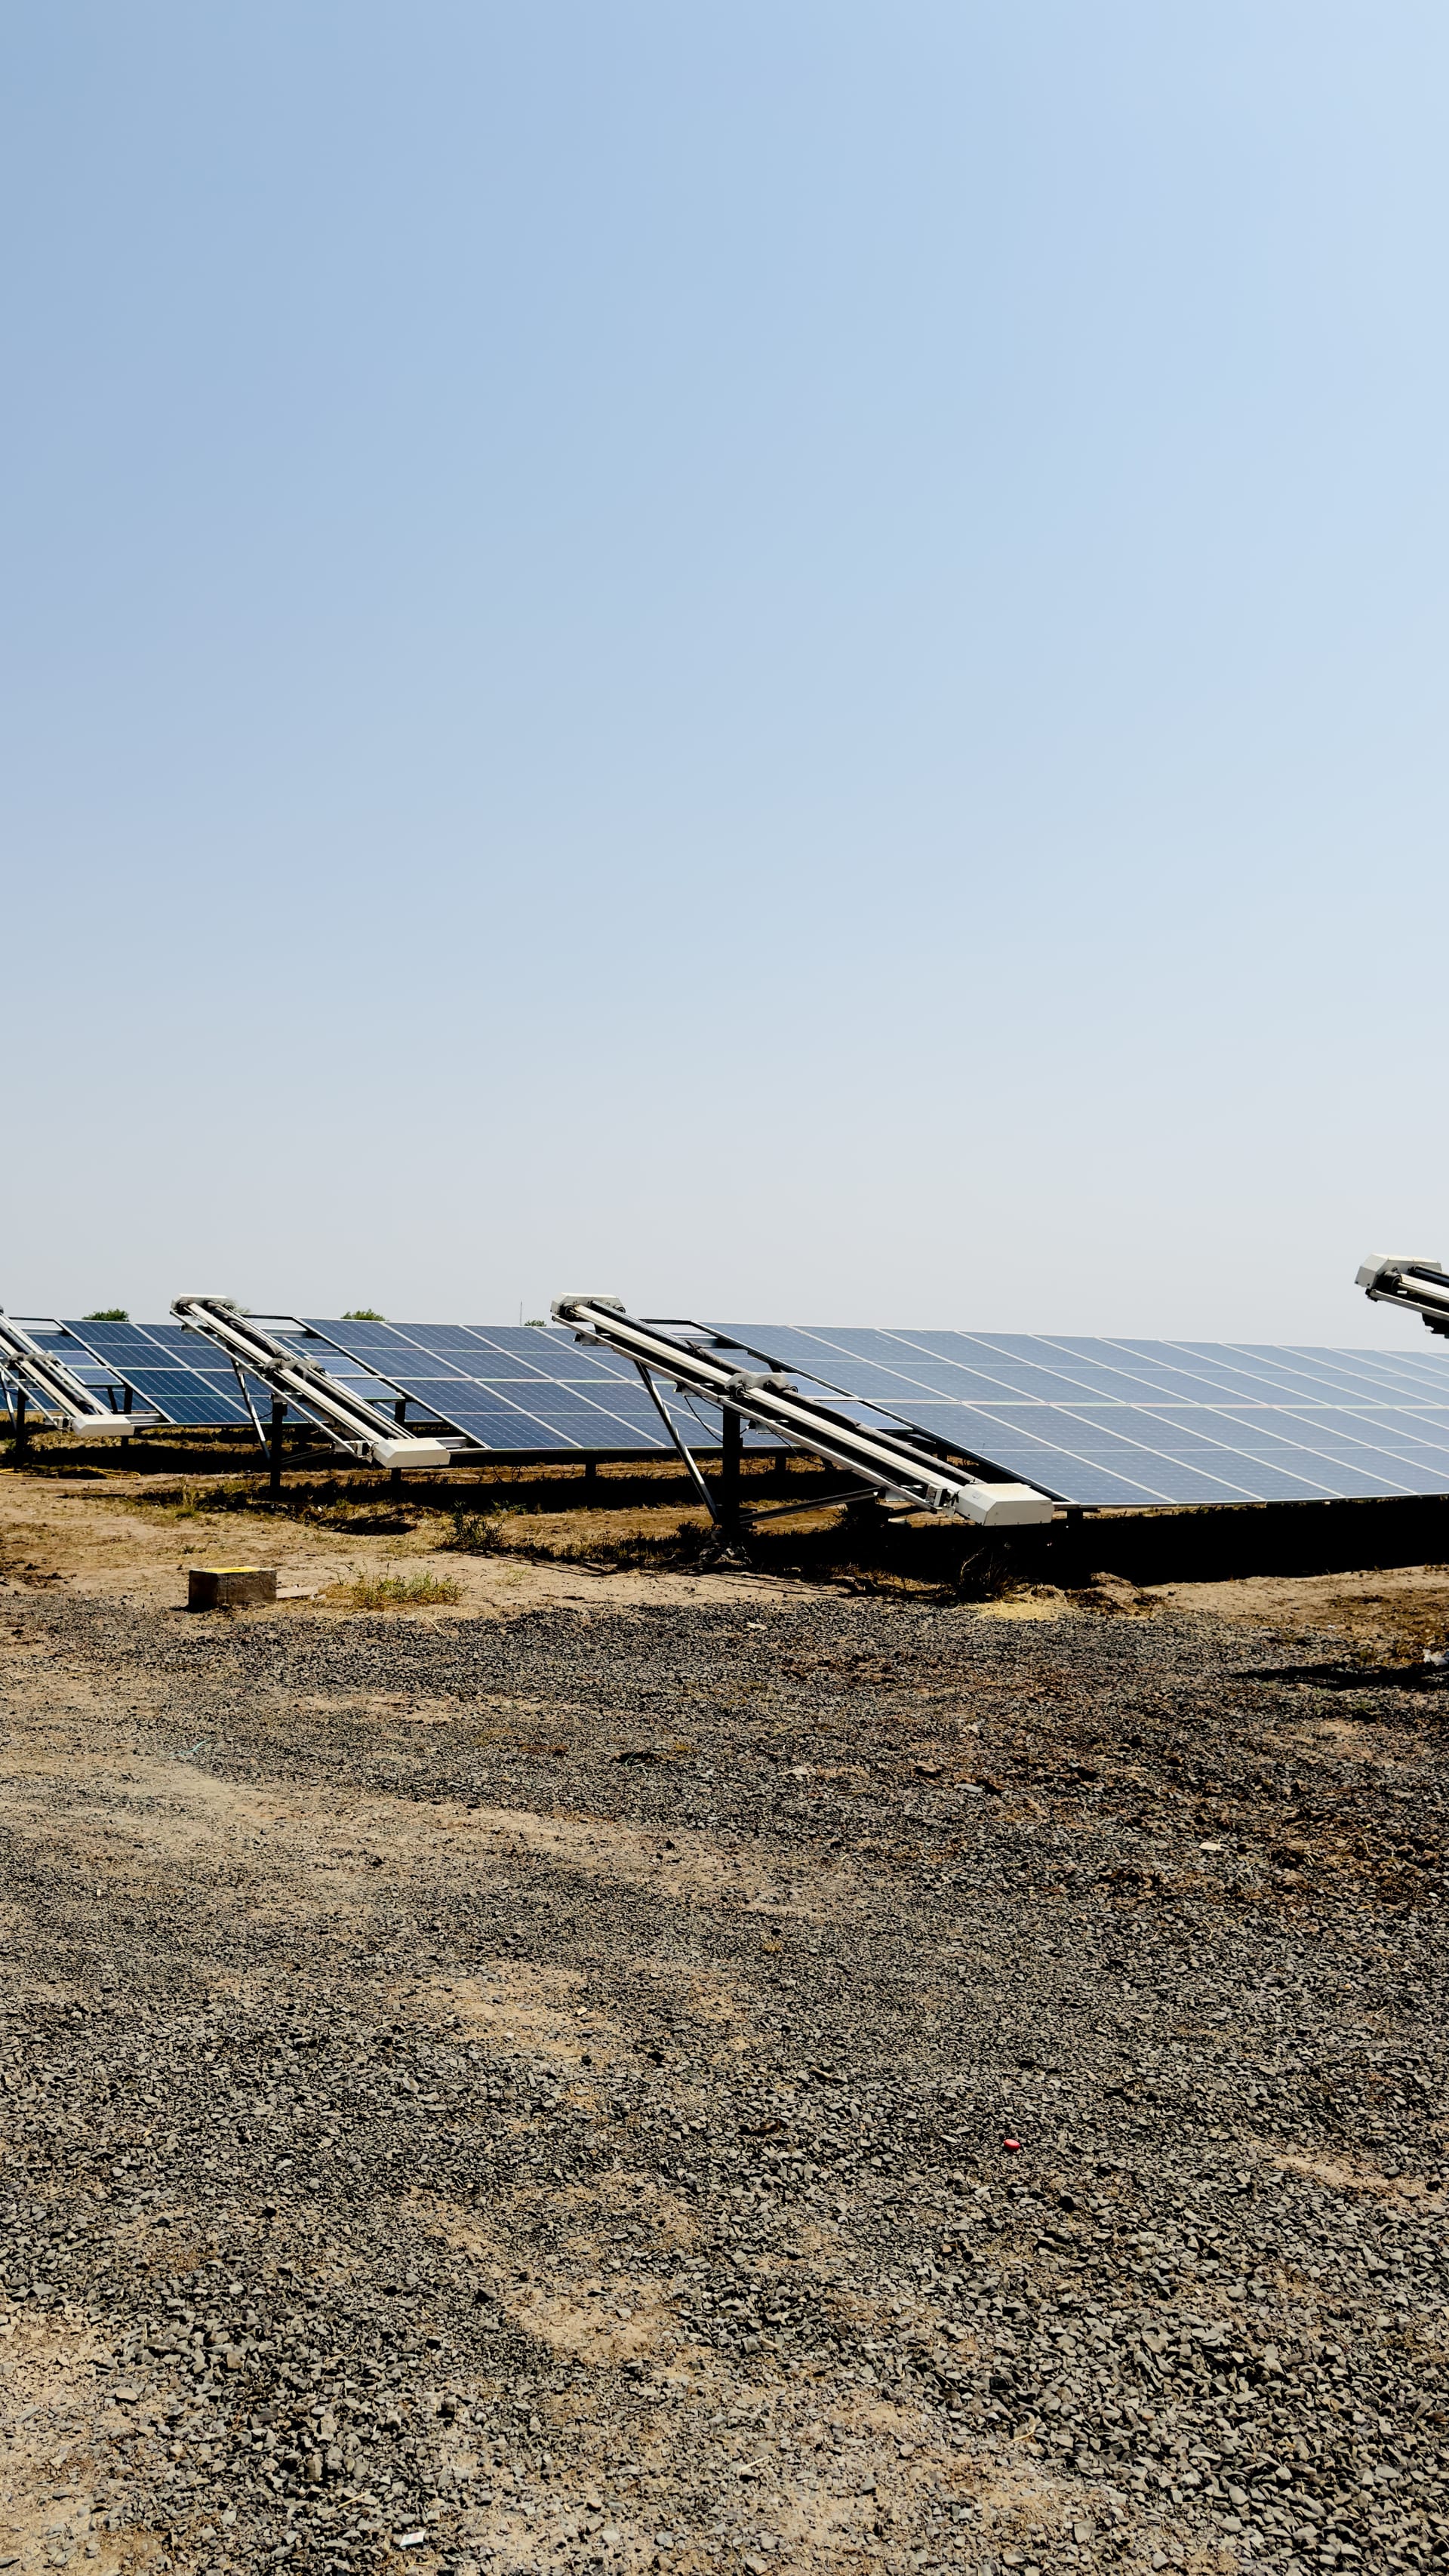
Rooftop solar arrays present a significantly higher risk profile and greater logistical complexity than ground-mount utility plants. For a typical C&I rooftop installation, the physical constraints of the roof pitch, perimeter safety railings, and the limited weight-bearing capacity of the structure dictate the maintenance methodology. While ground-mount systems allow for high-speed robotic deployment and easy access to row ends, rooftops often require specialized fall-prevention equipment, engineered lifelines, and complex navigation around roof-mounted HVAC or other industrial infrastructure.
Operations and Maintenance (O&M) teams in India must also contend with the high density of commercial arrays. Rooftop systems often lack the generous inter-row spacing found in utility-scale land-based projects, which restricts the movement of manual cleaning teams and limits the size of equipment that can be safely transported across the roof surface. Furthermore, the height of these structures often requires the use of harnesses or static safety cables, which adds significant time and overhead to every cleaning cycle. When planning a maintenance schedule, asset owners should conduct a structural safety audit to determine if the array can support the weight of heavy, traditional manual cleaning equipment or if it is better suited for a lighter, autonomous cleaning solution that minimizes the need for personnel to be positioned near roof edges.
These access limitations are a critical factor in the rooftop cleaning ROI. Each minute spent setting up safety equipment or navigating around obstacles on a rooftop array increases the cost-per-panel of a manual cleaning operation, often making it more expensive than a comparable ground-mount project of equal size. Asset managers should refer to our guide on rooftop cleaning robots to understand how modern hardware is specifically designed to work within these space-constrained environments without compromising safety or module integrity. By reducing the reliance on human movement across the rooftop surface, operators can improve both the safety of their O&M program and the consistency of their generation, protecting the asset from the recurring costs associated with manual labour constraints.
The Technical Threshold: When Does Soiling Cost More Than Cleaning?
Identifying the precise point where soiling-induced generation loss exceeds the cost of a cleaning cycle is the fundamental financial calculation for any Indian C&I operator. Industry-typical data indicates that solar panels in composite Indian climate zones face a maximum daily soiling loss of approximately 0.39%. In arid regions like Rajasthan or semi-arid belts in Maharashtra, monthly losses often accumulate to between 10% and 15% during peak dry seasons. For a 5-MW rooftop plant, a 10% drop in energy yield translates into significant revenue leakage that far outweighs the cost of a scheduled cleaning intervention.
To calculate your specific threshold, plant managers must monitor the Performance Ratio (PR) drift against the localized daily soiling rate. When the cumulative energy loss exceeds the cost-per-panel of the chosen cleaning method, delaying the maintenance cycle becomes a net-negative decision for the asset. This requires a shift from fixed calendar-based schedules to dynamic maintenance, where interventions are triggered by real-time telemetry from the plant SCADA system or fleet monitoring tools like automated monitoring platforms. Balancing these factors is critical for maintaining the efficiency targets discussed in our insights on managing soiling losses in high-dust regions.
Asset owners should prioritize cleaning interventions when the projected generation loss over the next 15 days is expected to exceed the cost of the cleaning service by more than 20%. This buffer accounts for the volatility of seasonal dust storms and varying local pollution levels. By treating the cleaning threshold as a dynamic financial trigger rather than a fixed operational cost, plant managers can optimize their operational expenditure and ensure that their rooftop solar investments achieve the expected return over their 25-year lifecycle.
How often should C&I rooftop solar be cleaned for optimal ROI?
For commercial rooftop installations in India, there is no one-size-fits-all schedule, as cleaning frequency is dictated by the interaction between local environmental dust loads, array tilt, and the specific site's proximity to pollution sources like construction or industrial exhaust. On a standard commercial plant with a 10-degree to 15-degree fixed tilt, operators should target a cleaning interval that triggers when the performance ratio drops by 2-3 percentage points, which often correlates to a 15-day to 30-day cycle during the dry, dusty months of March through June.
In practice, plant managers should move away from arbitrary 30-day rotations and instead utilize a data-led approach that monitors daily generation against theoretical models. In high-dust regions like Gujarat or Maharashtra, where cumulative monthly soiling losses can reach up to 10-15%, waiting a full month often results in substantial revenue leakage that exceeds the cost of a mid-cycle cleaning intervention. Conversely, during the monsoon season when natural precipitation provides periodic rinsing, manual or robotic cleaning frequency can be reduced or suspended entirely to save on operational expenditure and prevent unnecessary mechanical wear on the modules.
To establish a sustainable baseline, operators must evaluate the following:
- Daily Soiling Rate: In composite Indian climate zones, expect up to 0.39% daily loss during peak spring periods, which mandates tighter frequency monitoring.
- Economic Break-even: Calculate your cleaning cost-per-panel against the current market-linked PPA tariff; if the lost energy value exceeds the cleaning cost by more than 20%, immediate intervention is financially justified.
- Regional Variability: Sites in arid industrial belts require significantly higher frequency compared to coastal locations where sea breezes may help prevent heavy dust accumulation.
By integrating fleet monitoring tools like automated monitoring platforms, plant managers can accurately forecast the revenue impact of soiling before the next maintenance cycle. This data-driven strategy ensures that the operational expenditure remains aligned with the actual energy yield, helping operators navigate the complexities of long-term asset management, as discussed in our deeper look into managing soiling costs on Indian sites.
Developing an Automated Cleaning Schedule: A Step-by-Step Process
For a utility-scale or large C&I rooftop site in India, shifting from manual cleaning cycles to an automated schedule requires precise coordination between plant telemetry and site access logistics. Asset owners should first establish a baseline using 15-day moving averages of the Performance Ratio (PR) to identify exactly when soiling-related generation losses cross the threshold of economic viability. By installing localized irradiance sensors and dust accumulation monitors, O&M teams can transition from calendar-based maintenance to trigger-based interventions that protect output during peak dry seasons.
Implementation should follow these distinct operational phases to ensure system reliability and asset longevity:
- Baseline Calibration: Conduct a site-specific soiling audit over 30 days to measure the daily accumulation rate. In high-dust zones like industrial Maharashtra, expect loss rates between 0.25% and 0.39% per day during spring, requiring a more aggressive intervention strategy.
- Infrastructure Verification: Confirm that the rooftop layout meets the Central Electricity Authority (CEA) safety guidelines for maintenance pathways. Ensure that array rows have enough clearance for autonomous robots to traverse without risk of module damage or cable entanglement.
- Integration with NECTYR or Fleet Monitoring: Connect your cleaning assets to a centralized monitoring platform. This allows site managers to remotely schedule cleaning passes based on real-time weather forecasts, ensuring that robots do not operate during high-wind events or periods of heavy rainfall where natural rinsing is active.
- Automated Trigger Setting: Define a clear financial gate for your cleaning schedule. For instance, if the energy value of the lost generation exceeds the cost-per-panel of a robotic cleaning cycle by more than 20%, the system should automatically signal the next available cleaning window. This dynamic approach prevents the revenue leakage typically associated with static, monthly service contracts.
By digitizing the decision-making process, plant managers can ensure consistent performance monitoring, effectively turning cleaning from a reactive expense into a data-backed tool for maximizing yield. This methodology aligns with broader O&M strategies aimed at optimizing the long-term cost of ownership for commercial rooftop assets across India.
Water Scarcity and Maintenance: Comparing Methods for Indian Roofs
For commercial rooftop solar plants in India, water availability and the cost of water logistics often dictate the O&M strategy. While wet cleaning provides a thorough removal of stubborn grime, the operational burden of transporting water to rooftops via cranes or manual hose systems is often prohibitive for large-scale C&I arrays. In regions facing extreme water scarcity, such as parts of Rajasthan and Gujarat, shifting to waterless cleaning technologies is no longer an optional upgrade; it is a critical requirement for maintaining sustainable OPEX targets.
When comparing cleaning methods, plant managers must evaluate the lifecycle costs against the inherent water waste of traditional manual methods. Manual cleaning typically consumes between 1 and 2 litres per panel per cycle, a volume that scales rapidly when managing a multi-megawatt portfolio. By contrast, waterless robotic systems utilize specialized microfibers or PBT brushes to achieve high-efficiency cleaning without external water supplies. This shift preserves critical local water resources while mitigating the risk of structural roof load issues associated with stored water tanks or heavy cleaning equipment. Implementing a waterless cleaning strategy also simplifies maintenance scheduling, as operators no longer need to coordinate water tanker logistics, which are frequently subject to local shortages and price volatility.
Furthermore, the choice between methods impacts the long-term integrity of the solar modules. Consistent, high-pressure water use can degrade panel seals and anti-reflective coatings over time, particularly in arid climates where rapid evaporation leaves mineral deposits. Robotic waterless systems, when calibrated for consistent pressure and speed, offer a gentler and more predictable alternative. For asset owners looking to optimize their long-term cleaning OPEX, integrating waterless automation reduces the reliance on seasonal labor, ensuring that performance ratios remain high even during the dust-heavy months of the Indian summer.
What plant managers should do next
For IPPs and O&M leads operating commercial solar assets in India, moving from reactive cleaning to a predictive strategy is the most effective path to protecting yield. Begin by conducting a site-specific soiling audit to identify your actual baseline loss, rather than relying on generic industry averages. This data serves as the foundation for selecting the right intervention frequency and technology stack.
- Benchmark Your Current Losses: Deploy local pyranometers and soiling sensors across your MW-scale array to establish the precise PR (Performance Ratio) degradation curve. If your daily loss exceeds 0.39% in peak dry seasons, manual cleaning intervals are likely insufficient, and automated intervention is required to maintain your PPA yield guarantees.
- Evaluate the Financials: Use an ROI calculator to run a five-year model comparing the TCO of existing manual labor against automated waterless systems. Factor in not just labor costs, but the hidden expenses of water procurement, logistics, and potential structural damage caused by repeated high-pressure wet cleaning.
- Select the Right Technology Architecture: Match your cleaning hardware to your layout constraints. For fixed-tilt C&I roofs, ensure your chosen system addresses physical access limits and avoids structural overloading. For tracker-heavy sites, prioritize systems like dedicated tracker robots that handle inter-row movement without manual interference.
- Integrate Fleet Intelligence: Transition from manual spreadsheets to a centralized fleet monitoring platform. Connecting your cleaning assets to a real-time dashboard allows your O&M team to respond to dust storms or regional smog events within hours, rather than weeks, effectively future-proofing your asset against escalating soiling challenges in the Indian market.
By implementing these steps, asset owners can ensure their C&I portfolio remains at peak efficiency. For those managing utility-scale portfolios, moving toward a data-backed cleaning OPEX model will provide the consistent performance needed to optimize energy delivery and long-term asset value in India's competitive renewable landscape.
Frequently asked questions
Case studies for a 5-MW commercial rooftop installation show that soiling losses can reach 10% to 15% over a 30-day period without intervention. By implementing a data-driven cleaning schedule, operators avoid this revenue deficit, ensuring that the plant performance ratio stays aligned with the initial financial model for CAPEX recovery.
In high-dust industrial regions like Maharashtra or Uttar Pradesh, operators typically observe soiling losses of 0.39% per day during peak dry months. If left unmanaged for a standard monthly cycle, these losses accumulate to significant levels, drastically reducing total energy yield.
Automated cleaning is often preferred for C&I rooftops because manual labor faces significant logistical hurdles. Issues such as roof pitch, limited weight-bearing capacity, and site-specific safety constraints make manual cleaning unpredictable and expensive compared to consistent, data-backed automated O&M models.
Rooftop assets present higher risk profiles than ground-mount systems due to limited perimeter safety railings, roof pitch, and structural weight-bearing capacity. These factors necessitate specialized maintenance methodologies that prioritize worker safety and equipment protection, which are distinct from the simpler access models used in utility-scale ground-mount projects.