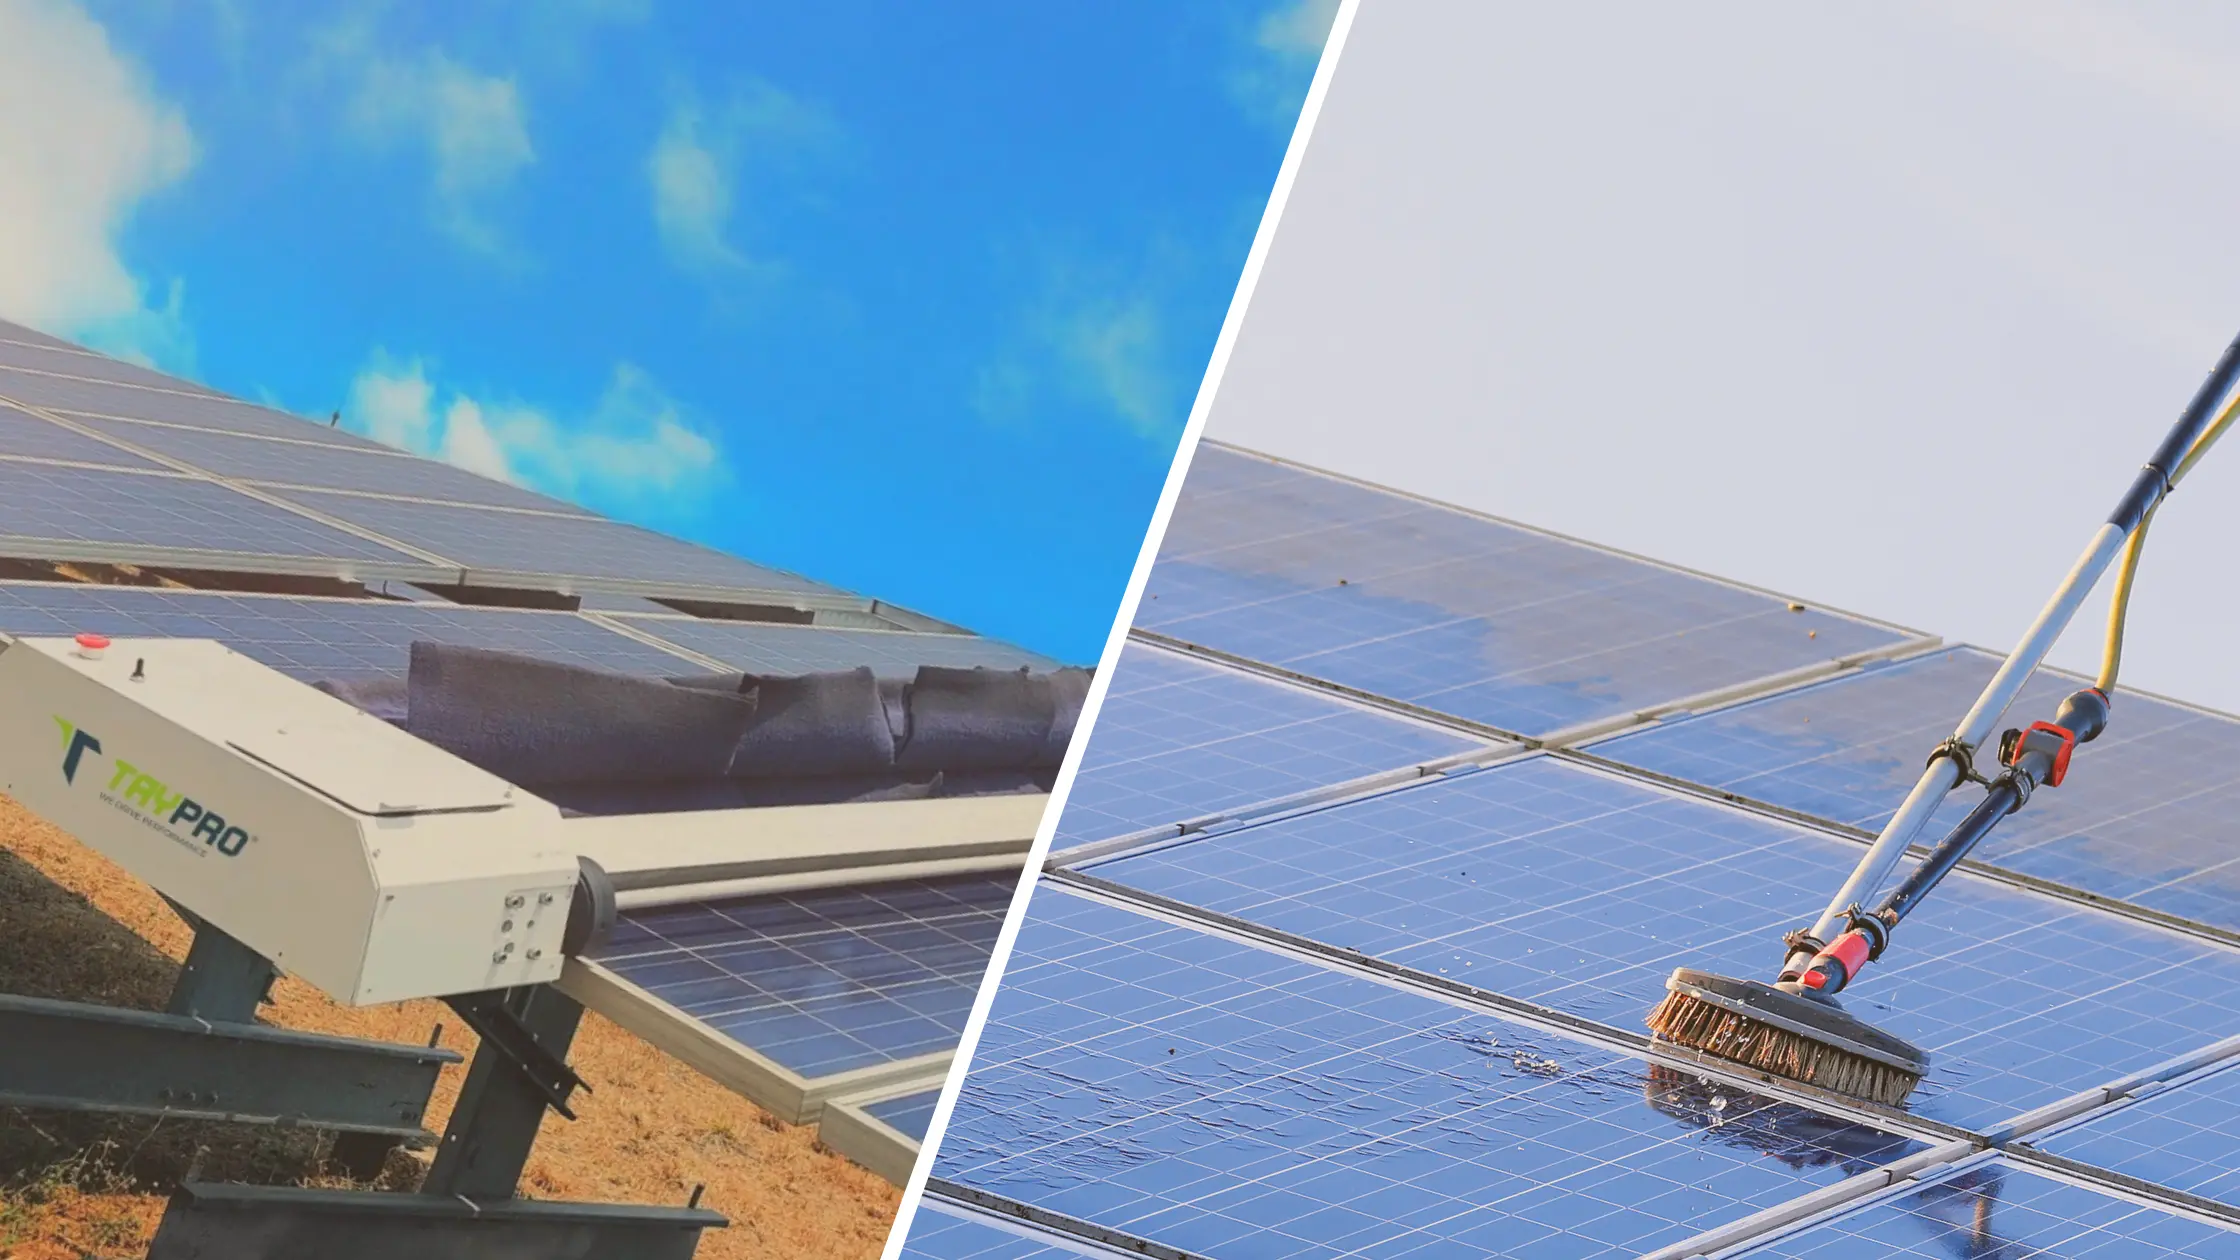
Indian utility owners rarely choose between traditional and robotic cleaning in the abstract. They choose between losing MWh to dust while waiting for tankers and crews, or financing a fleet that can pass rows at night when May storms leave modules chalky by noon. The comparison that matters is five-year, fully loaded, on your blocks, at your PPA tariff.
This article compares manual wet cleaning and autonomous waterless robots the way finance and O&M teams should: throughput after dust events, litres per MW, PR recovery, and tracker geometry, not demo-day shine.
Quick answer
- Traditional wet: low capex, high recurring labour and water; scale limits appear on 50 MW+ sites in dust belts.
- Waterless robots: higher capex, potential for more frequent passes, minimal water, and pass logs for audits.
- Compare on ₹ per recovered MWh over 5 years, not robot list price vs one cleaning invoice.
- Trackers often tilt economics toward robots when manual row times exceed storm-recovery windows.
- Pilot on dirty reference blocks before portfolio rollout.
What counts as traditional on Indian MW plants
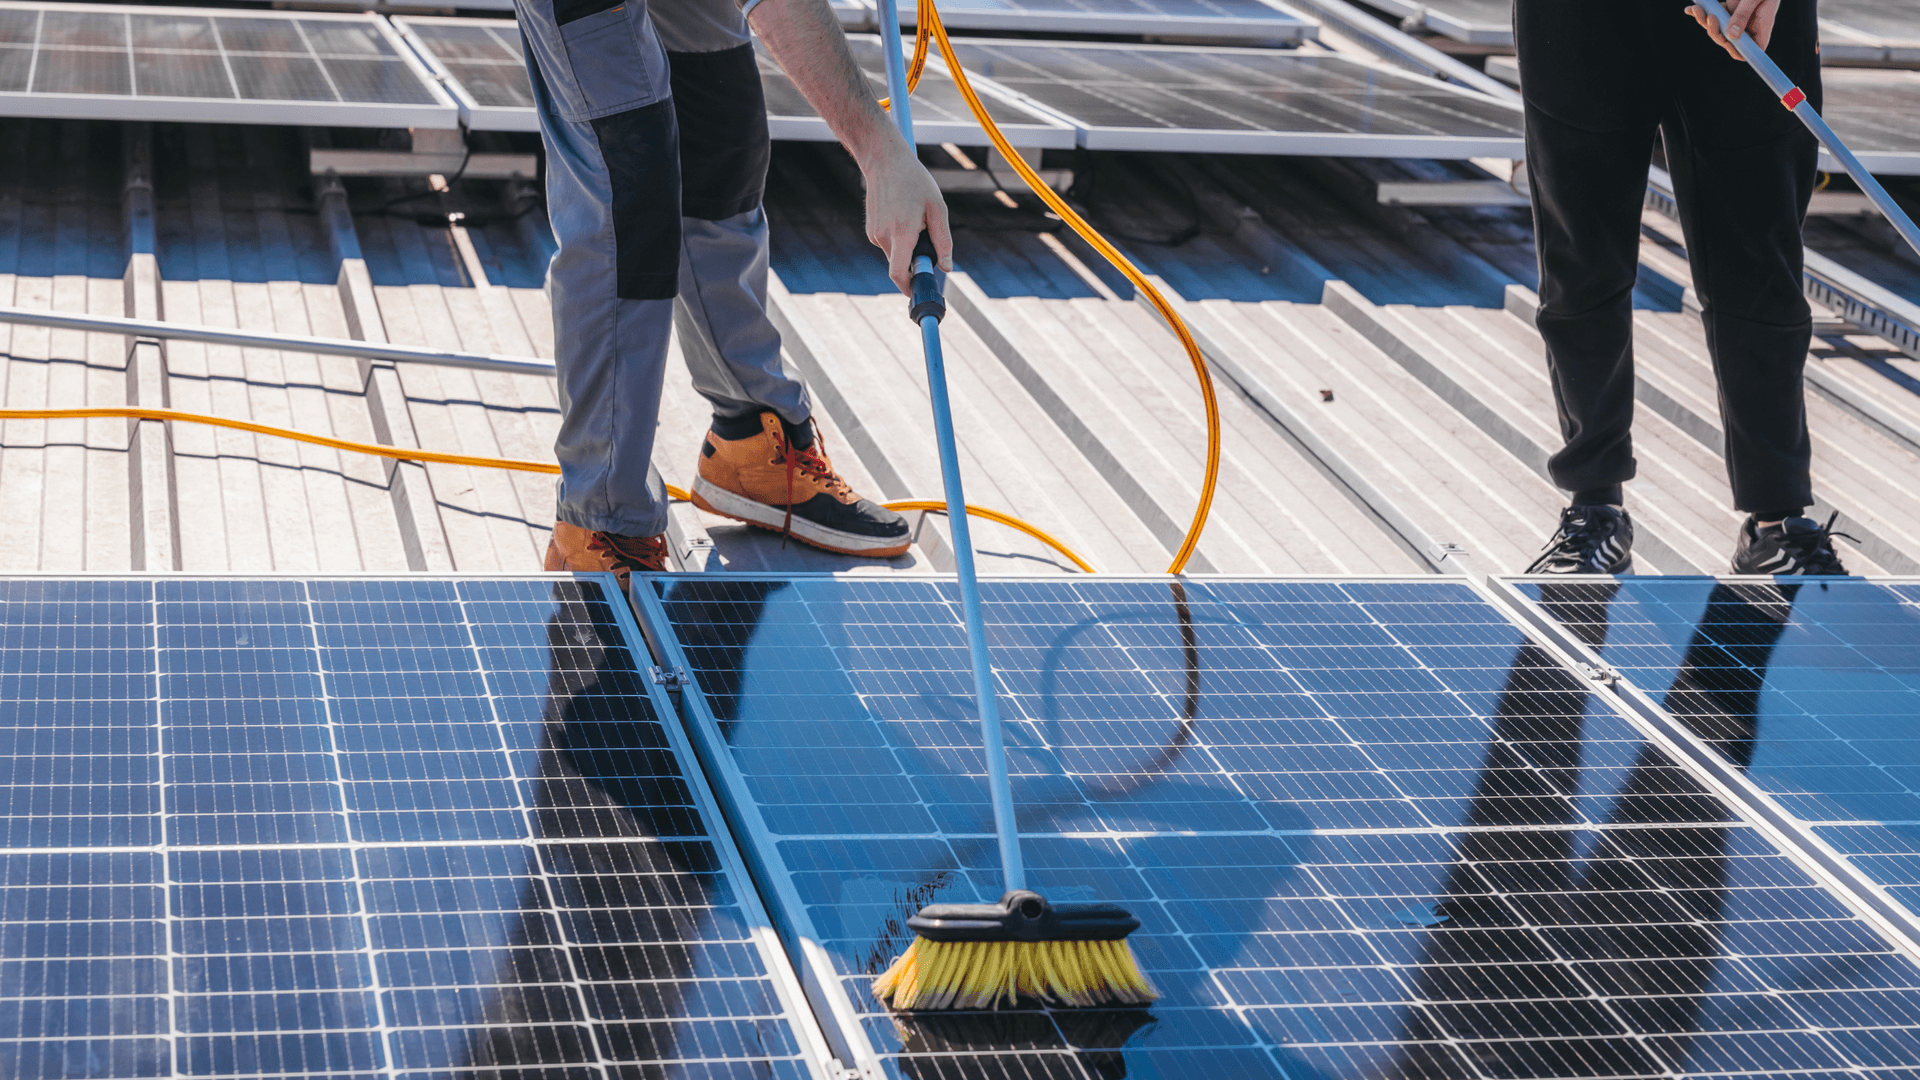
Traditional programs usually mean contracted brush crews with water-fed poles or tractor-mounted brushes on fixed-tilt tables. Some sites use sprinkler rinse systems designed at EPC stage. Labour arrives in waves: mobilization, zone cleaning, demobilization. In Rajasthan and Gujarat, tanker queues and worker availability often stretch a weekly plan into ten-day full-plant cycles while PR bleeds on untouched blocks.
Traditional methods remain valid where dust is moderate, water is cheap, and geometry is simple. They struggle when the soiling curve outruns crew throughput, exactly the regime many GW clusters now operate in.
What waterless robotic cleaning changes
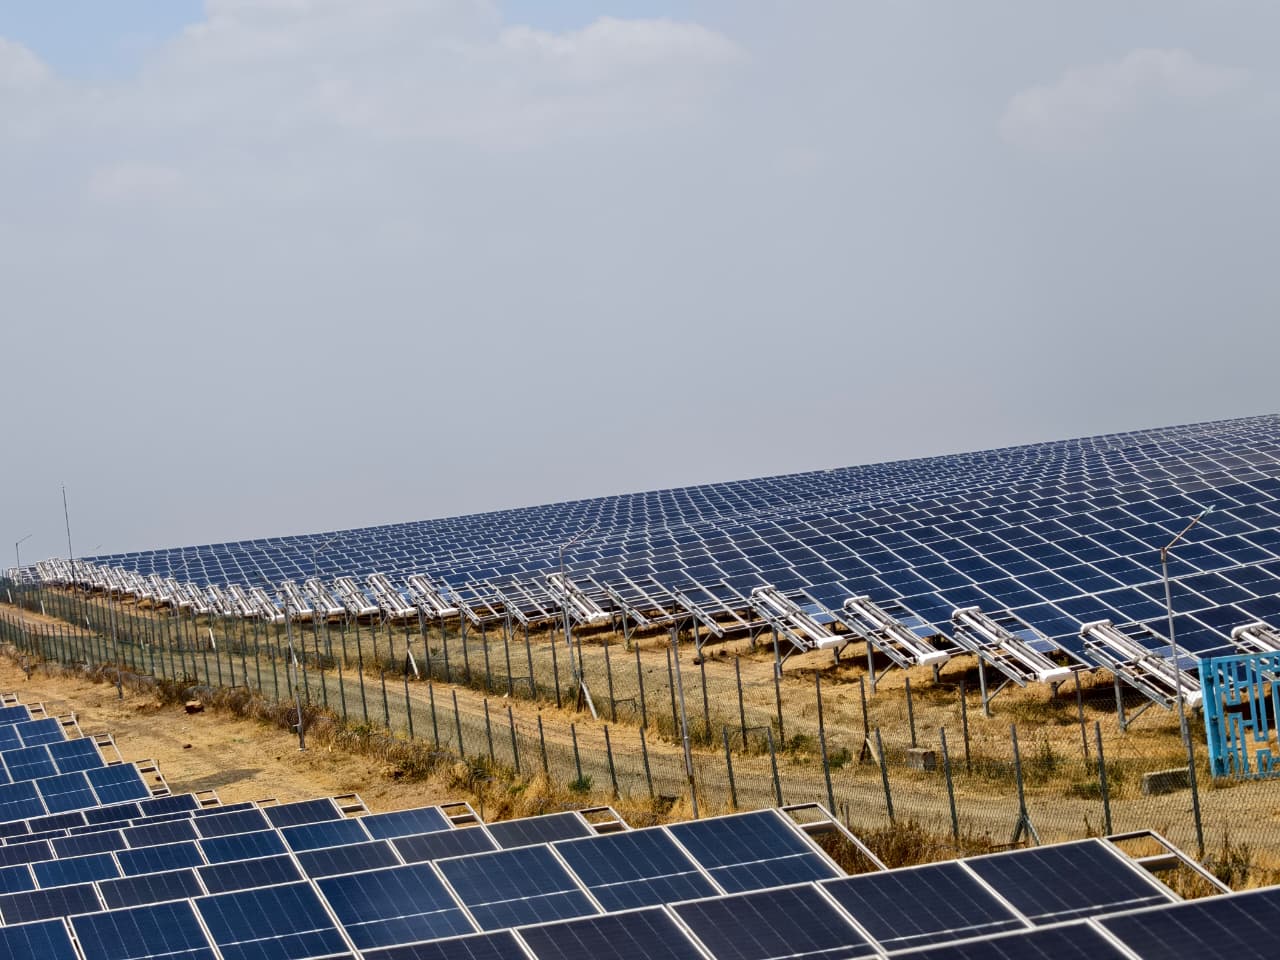
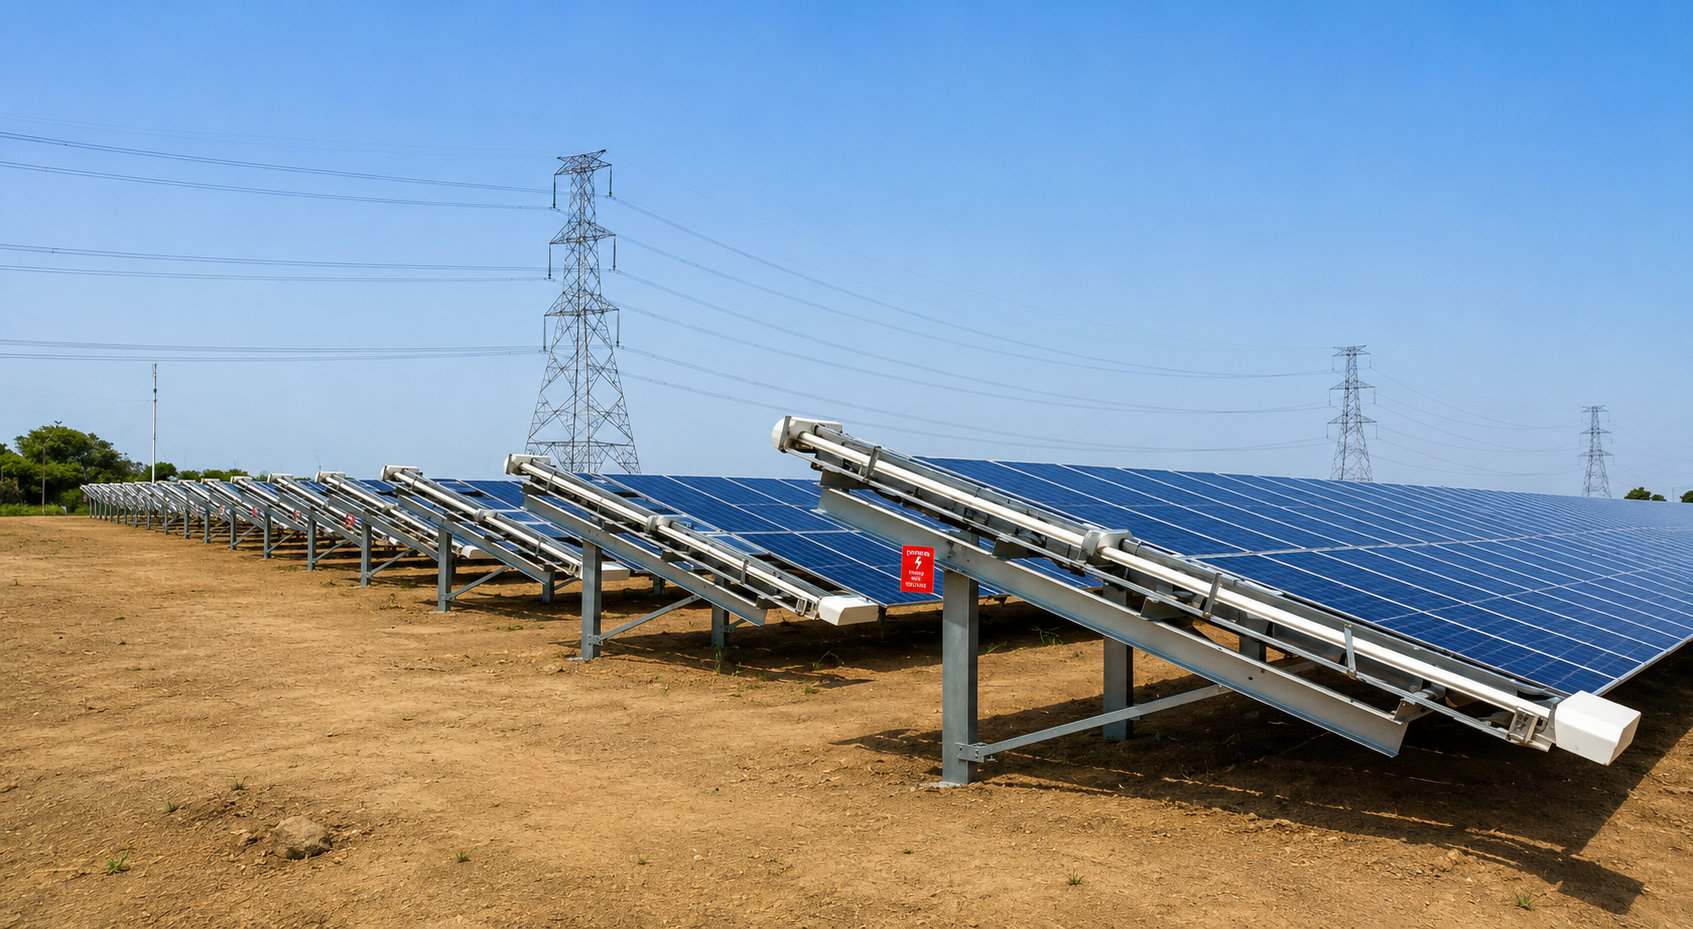
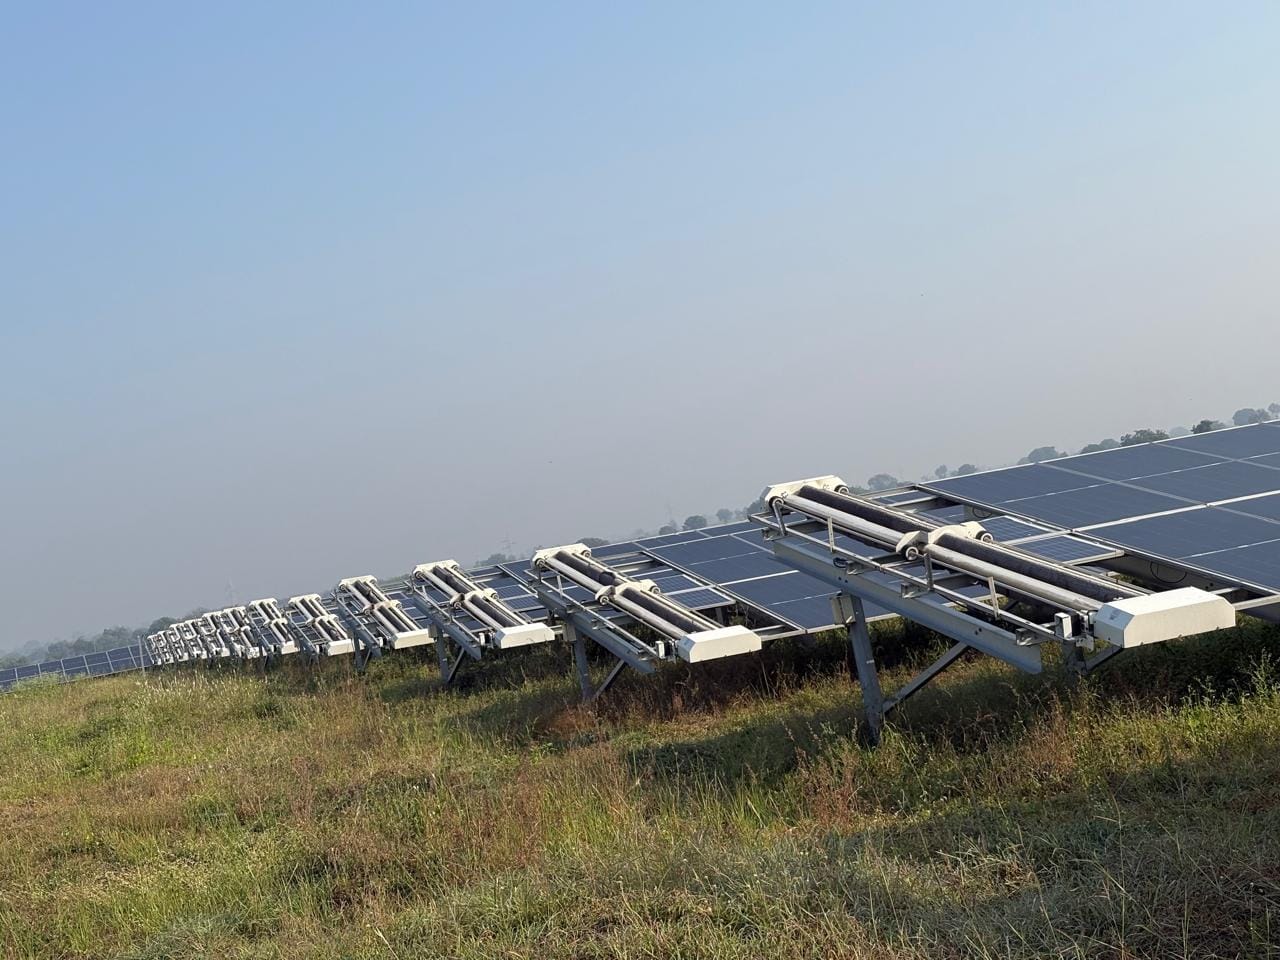
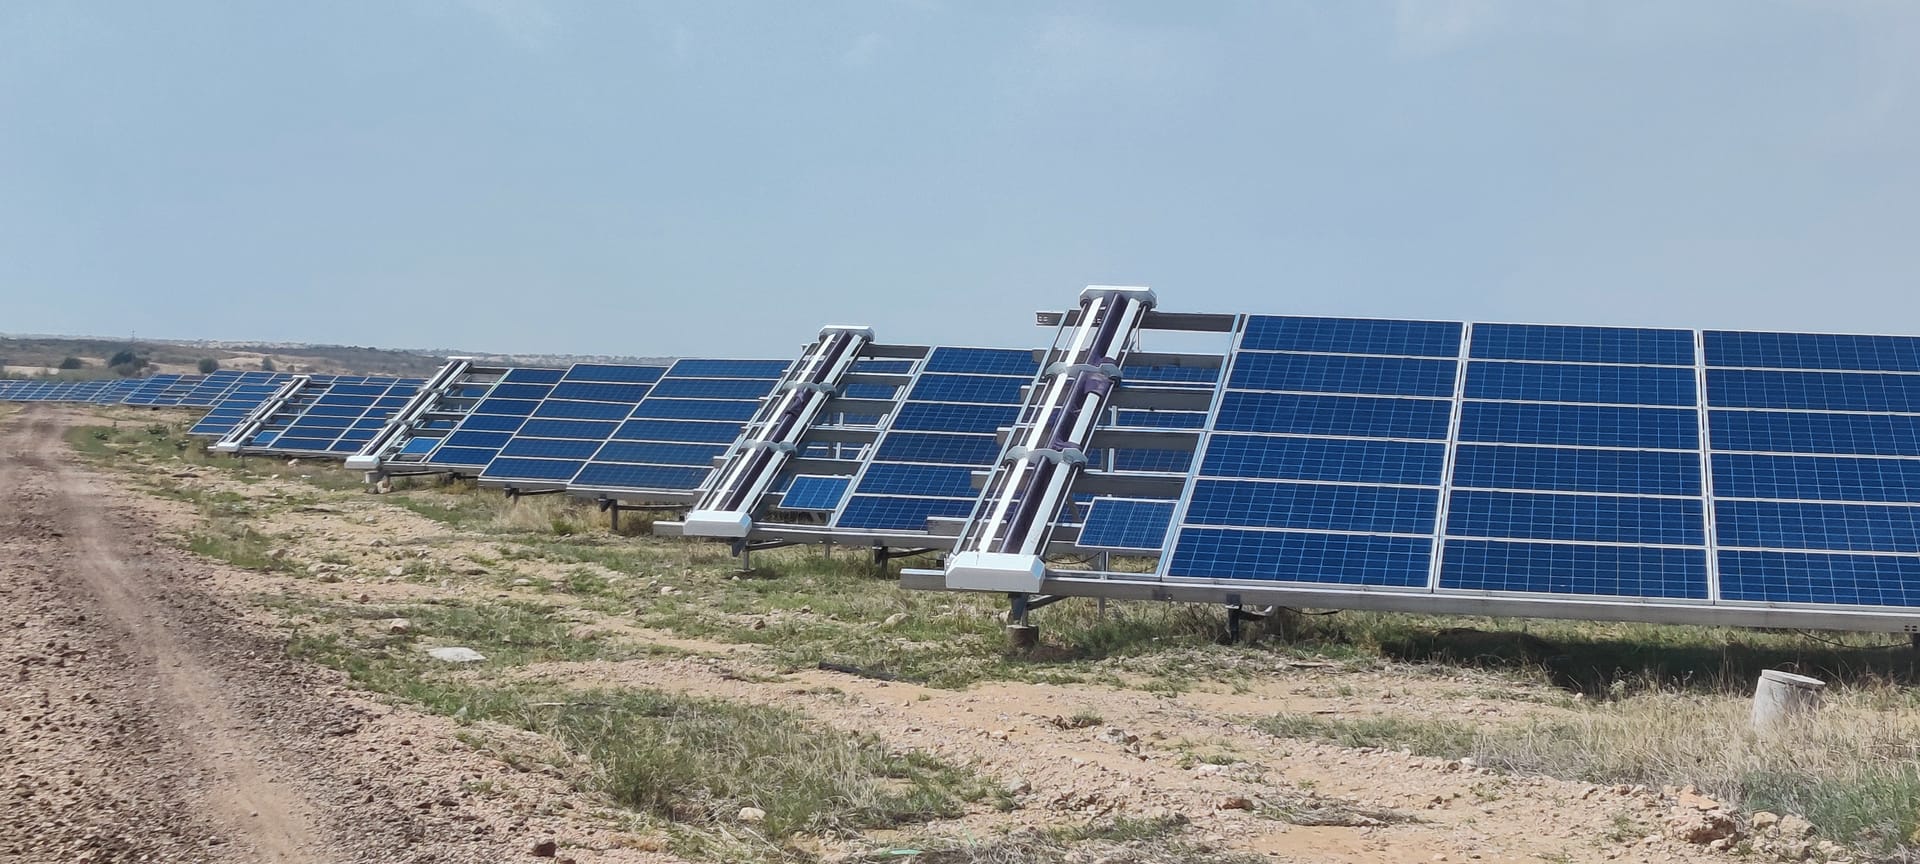
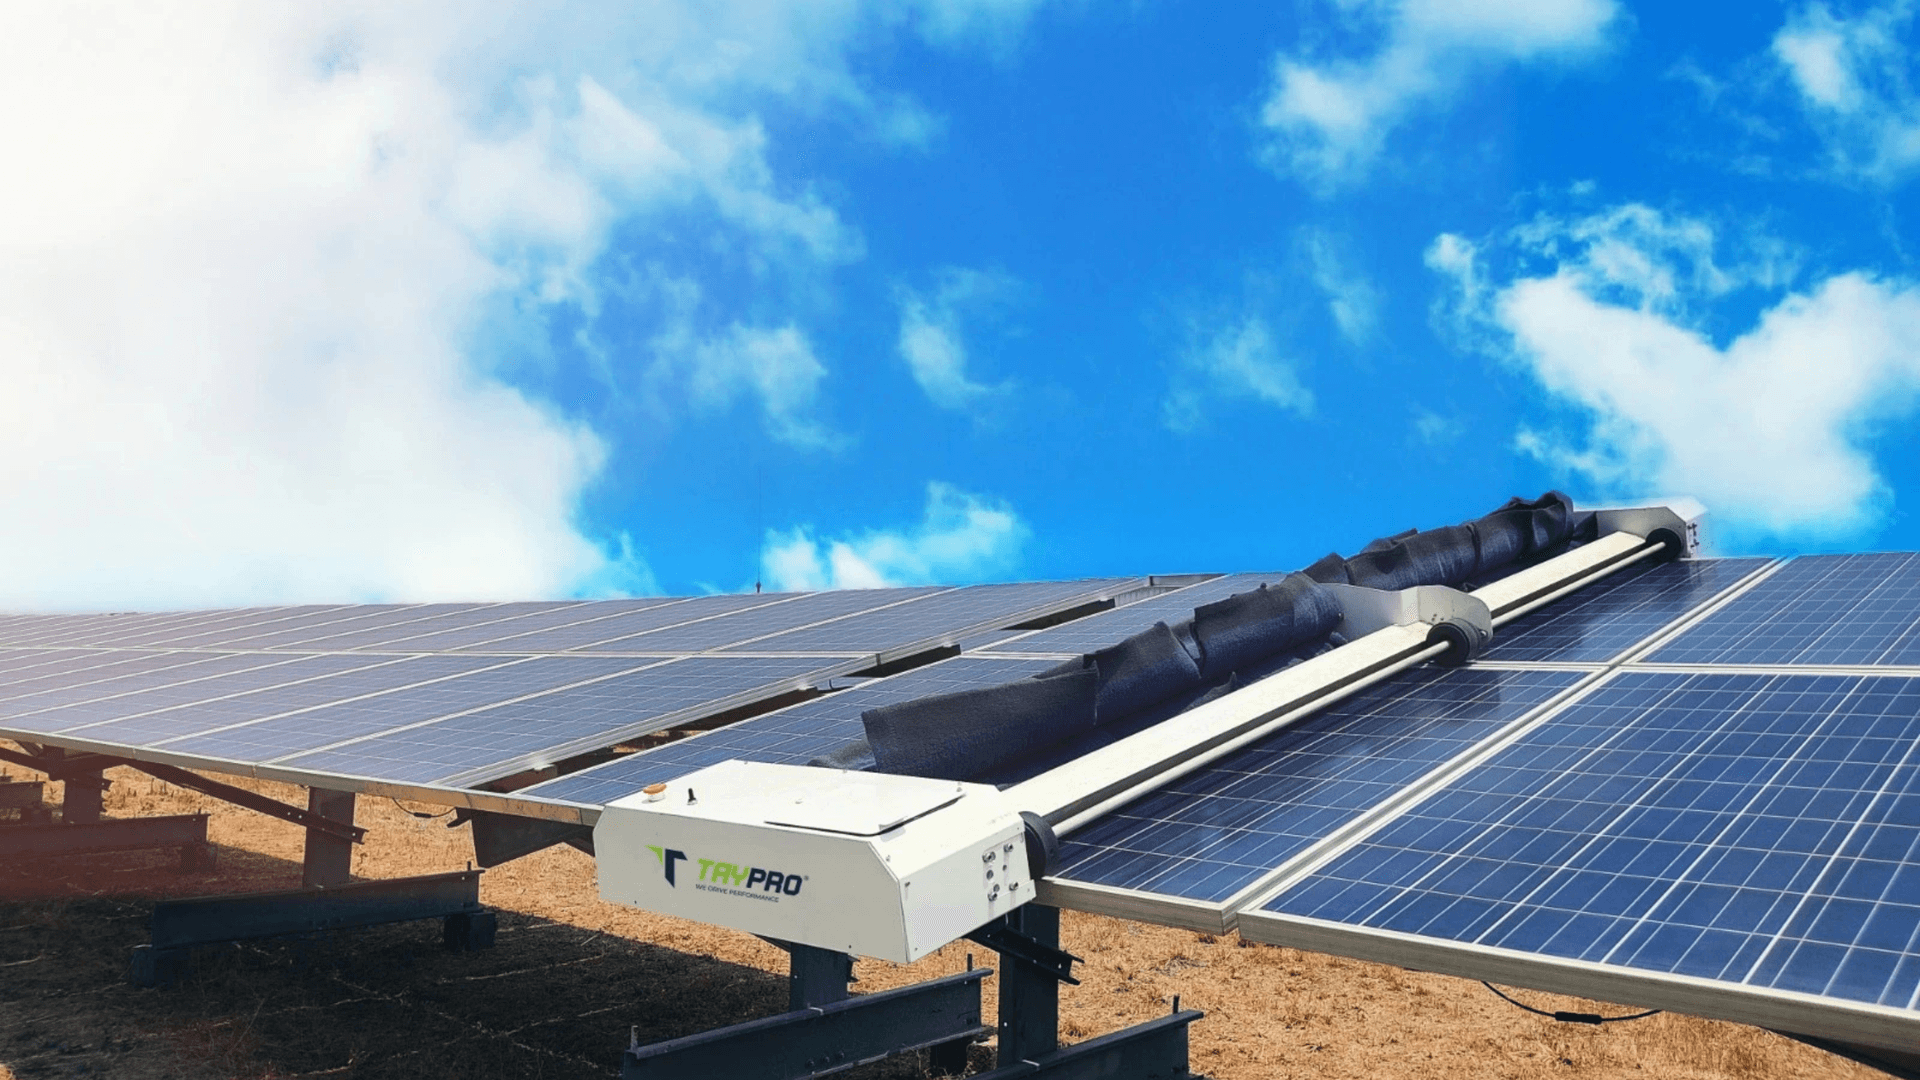
Waterless robots traverse rows with engineered brush heads and controlled speed, often scheduled at night to avoid daytime generation loss. Fleet software logs which rows completed, supporting lender and asset-management reviews. Water consumption drops sharply versus wet wash, which matters where borewell depth and discharge rules tightened since commissioning.
Robots are not magic: they require row fit, wind and stow interlocks on trackers, spare batteries, and operators who treat abort alarms seriously. A robot that misses 15% of rows after a storm performs like an expensive partial manual round.
Technology overview: waterless cleaning technology and automatic cleaning systems.
Illustrative 10 MW comparison (arid site, industry-typical ranges)
Assume a 10 MW fixed-tilt block in western India, PPA near ₹3.50/kWh, dry-season soiling that depresses PR 4-6% between infrequent manual rounds, versus more frequent robotic passes holding average PR closer to clean baseline. Numbers are illustrative for structuring your model, not a universal quote.
| Cost line (annual, illustrative) | Manual wet (weekly intent) | Waterless robot fleet |
|---|---|---|
| Labour + supervision | ₹35-55 lakh | ₹8-15 lakh (operators + O&M) |
| Water + tankers | ₹12-25 lakh | Near zero (waterless) |
| Equipment capex amortized | Low | ₹25-40 lakh/year (depends on fleet deal) |
| Soiling MWh loss (opportunity) | Higher if cycles slip | Lower if uptime high |
For a worked structure with assumptions spelled out, see waterless robotic vs manual cost comparison for a 10 MW plant. Use the ROI calculator with your site soiling, not brochure defaults.
Five-year TCO framework (50 MW illustrative)
| Year 1-5 cumulative (illustrative) | Manual wet program | Waterless robot program |
|---|---|---|
| Direct O&M spend | ₹4-7 crore | ₹2.5-4 crore (incl. amortized capex) |
| Water withdrawal (litres) | Millions per year | Minimal |
| Avg. annual soiling loss | 3-5% if cycles slip | 1.5-2.5% if uptime >85% |
| Foregone MWh (mid case) | ~6-10 GWh over 5 yr | ~2-4 GWh over 5 yr |
| Foregone revenue at ₹3.50/kWh | ₹21-35 crore | ₹7-14 crore |
Net advantage depends on robot uptime, financing terms, and actual dust profile. Run your own model; do not copy brochure payback claims.
PR and revenue: the benefit side of the ledger
Cleaning comparisons fail when they only add costs. Model recovered energy: if improved frequency lifts average annual output by 2-4% on a 10 MW plant, that is roughly 1.6-3.2 GWh at typical yields, material rupees at utility tariffs. If manual programs already keep PR within 1% of baseline, robot capex is harder to justify unless water savings or labour scarcity dominate.
Measure with reference modules or clean-day PR baselines. Performance ratio calculation should be monthly discipline, not a commissioning artifact.
Tracker plants: where geometry changes the winner
On single-axis trackers, manual crews slow on long rows, cable trays, and stow states. Robots designed for tracker clearance can pass at night when modules are stowed, but only if wind rules and OEM approvals are documented. A traditional crew program that cleans fixed-tilt blocks quickly may still be rational while tracker zones lag, splitting methods by block is common on hybrid sites.
Read robotic cleaning on trackers vs fixed tilt and manual brush limits at 50 MW before standardizing one method plant-wide.
Water stress and ESG reporting
Traditional wet cleaning draws litres per module that ESG packs increasingly question in stressed districts. Waterless methods reduce withdrawal and tanker traffic, a social and permitting benefit separate from PR. If your off-taker tracks delivered green MWh integrity, document cleaning method and water alongside generation.
Compare methods: waterless vs water-based cleaning and robotic vs manual overview. Carbon framing: carbon value of soiling loss.
How to run a defensible pilot
- Select two high-soiling blocks with working reference modules.
- Record irradiance-normalized PR for 14 days pre-campaign.
- Execute manual campaign on block A; robot campaign on block B with pass logs.
- Re-measure PR for 7 days post-clean; log labour hours, water litres, robot aborts.
- Extrapolate annual ₹ and MWh; stress-test with a dust-storm week.
- Present results to asset management with both revenue and water metrics.
Which method should a 50 MW Rajasthan plant pick?
If full manual passes take longer than your economic soiling window after storms, and water sourcing is costly or capped, robots often clear hurdle rates when fleet uptime exceeds roughly 85-90% (vendor and site dependent, verify in pilot). If manual passes stay on schedule with low water cost, traditional may remain optimal until scale crosses another MW threshold.
Hybrid approach: robots on tracker blocks with longest rows; manual wet on fixed-tilt service areas with good water access. Document split in O&M contract to avoid vendor turf wars.
Risk comparison matrix
| Risk | Manual wet | Waterless robots |
|---|---|---|
| Labour availability | High in storm season | Lower (small operator team) |
| Water permit / cost | High in arid states | Low |
| Row coverage proof | Often paper logs only | Digital pass maps |
| Capex exposure | Low | High upfront |
| Module warranty | Risk if crews untrained | Risk if OEM approval missing |
Financing and amortization assumptions
Robot capex spread over five years at 12% cost of capital changes the comparison materially. A ₹3 crore fleet at 10 MW might amortize to ₹35-45 lakh per year including O&M, still below manual wet spend on many arid sites when uptime holds. Lease structures shift capex off balance sheet but add interest; run both models in the ROI calculator.
Traditional programs have hidden costs: supervisor vehicles, night lighting for delayed passes, tanker demurrage, and rework when mud bakes before crews arrive. Include them in five-year TCO or manual wins on paper only.
Key takeaways for plant managers
- Traditional vs robotic is a throughput and water question at MW scale.
- Build 5-year models with MWh on both sides of the ledger.
- Split methods by block when geometry differs.
- Demand OEM cleaning approval and pass coverage logs for robots.
- Revisit economics after the first dry season with real PR data.
Re-run your five-year comparison after one full dry season with logged PR and water data. Hybrid block-by-block methods are common and often optimal.
Related resources
Frequently asked questions
Traditional manual wet cleaning has low upfront cost but high recurring labour and water expense at 50 MW+ scale. Waterless robots require capex but can deliver more frequent passes, lower water use, and logged coverage, often improving average PR in arid Indian sites when soiling is material.
Include labour wages and supervision, water sourcing and discharge, mobilization after dust storms, robot capex and O&M, downtime, and recovered MWh valued at your PPA tariff. Exclude sticker-price-only comparisons.
On smaller fixed-tilt sites with mild soiling, reliable water, and labour markets where full-plant manual passes complete in a few days, especially if robots cannot fit row geometry.
Not automatically. Obtain written OEM approval for the specific robot, brush type, and pressure regime on your modules before fleet procurement.
Select two dirty blocks with reference modules, run manual and robot campaigns with logged hours and water, compare irradiance-normalized PR before and after, then extrapolate to full-plant annual cost.
Industry-typical ranges cite roughly 2-5 litres per module per wet pass depending on method, which scales to lakhs of litres per full 10 MW pass. Waterless robots reduce withdrawal toward near zero per pass, which matters in stressed districts and for ESG disclosure.