Summary for plant managers
Managing utility-scale solar performance in Odisha requires a precise approach to cleaning that balances the state's high humidity with the industrial dust profiles typical of inland energy corridors. Asset owners can optimize generation by moving away from reactive, interval-based cleaning toward data-driven, condition-based automation.
- Typical soiling losses in Odisha range from 10% to 25% depending on proximity to industrial hubs and dust exposure.
- Optimal cleaning frequency varies from 7 to 15 days, calibrated by local irradiance and soiling rate sensors.
- Automated systems typically reduce water consumption by up to 90% compared to traditional pressure washing methods.
- Implementation requires initial site topography assessment to ensure robotic clearance on single-axis trackers.
For IPPs operating MW-scale portfolios, the transition to automation is primarily a move to protect the Performance Ratio (PR) from non-linear degradation. As noted in our research on managing long-term O&M costs, the cost of inaction often exceeds the investment in automated infrastructure, especially in regions with high soil accumulation rates.
How does the Odisha landscape influence cleaning automation requirements?

The Odisha landscape presents a dual challenge for utility-scale solar O&M. Coastal sites face the corrosive impact of salt-laden air, which can bind fine dust particles to module surfaces more aggressively than in arid regions. Conversely, inland sites near coal belts or industrial manufacturing zones experience heavy particulate matter (PM) accumulation, which creates a thick, opaque layer that blocks irradiance within days. These environmental variables make a one-size-fits-all cleaning schedule ineffective for large portfolios.
Successful integration depends on understanding that Odisha's climate is not merely about dust; it is about the chemistry of soiling. Humidity levels often lead to morning dew cycles that cement dust onto glass, turning loose particles into a hard crust that resists simple brushing. This necessitates the use of advanced cleaning technology, such as the robotic dry-cleaning methods designed to lift and remove particles without the need for supplemental water. By deploying automated systems, plant operators can maintain a consistent cleanliness level regardless of the high-humidity windows that typically render manual or basic brushing techniques less efficient.
The economic impact of this environmental nuance is stark. In coastal regions like Ganjam or Balasore, salt-induced adhesion can cause an accelerated power drop of 0.5% per day if left unattended. Inland sites near Angul, which deal with heavy coal-based fly ash, may see a 1.2% daily decline in power output during peak industrial operations. Understanding these localized accumulation gradients allows operators to assign specific cleaning profiles to different sites within a single portfolio, optimizing both robot battery life and brush wear-and-tear.
Implementing automated cleaning on MW-scale tracker arrays
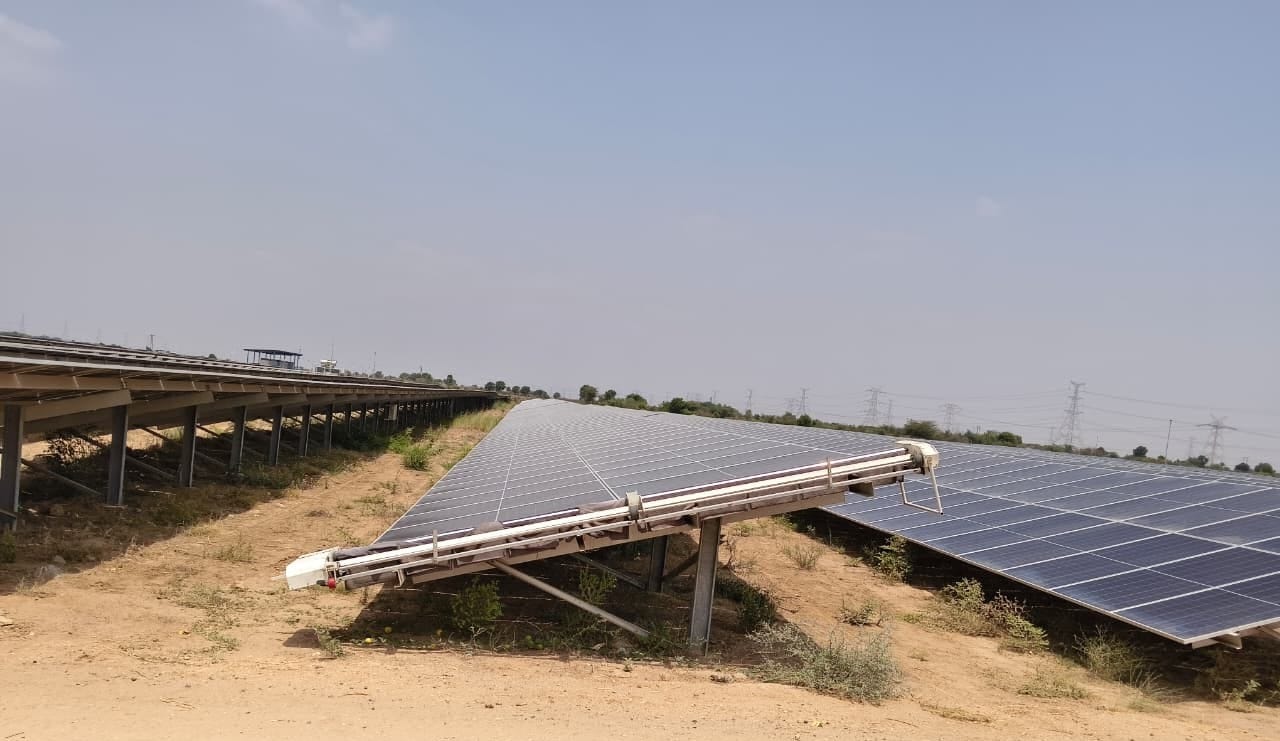
Integrating automation into single-axis tracker arrays requires verifying the clearance limits of the robot against the maximum tilt range of the trackers, which typically spans -52 degrees to +52 degrees. For plants in Odisha, robots like the GLYDE-X or NYUMA-X must feature a flexible, articulated body to maintain consistent brush pressure across the curved path of the tracker table throughout the day. Asset managers should prioritize units that can handle the full range of movement without mechanical strain on the module frames.
Technical site preparation is equally critical for successful deployment. Automated cleaning requires that all end-row cabling is secured and that no mechanical obstructions, such as inverter housing or structural support beams, block the row-end docks. For scattered tracker blocks that are separated by maintenance access roads, installing a row-transfer system like the CRADYL platform allows a single robot to transition between rows without manual intervention. This eliminates the need for expensive, labor-heavy lift-and-shift operations across large, multi-MW tracts.
To ensure long-term mechanical reliability, the installation phase must also include a structural integrity audit of the torque tubes and drive shafts. Since robotic systems add an incremental load to the tracker structure during transit, verifying that the tracker controller can compensate for this added weight is crucial to preventing tracking errors. Furthermore, the deployment of specialized docking stations requires a leveled, gravel-free surface to prevent robot slippage. Implementing a dedicated, paved 2-meter by 2-meter concrete pad at the end of each row effectively mitigates these risks, ensuring the robot remains level during the critical docking and charging sequence.
How often should you cycle cleaning automation in coastal vs inland Odisha sites?
Determining the cleaning interval is the most effective way to protect the performance ratio of a utility-scale plant in Odisha. Coastal plants, which are exposed to salt-laden air, often require more frequent, lighter cycles to prevent the crystallization of moisture and dust into stubborn surface films. In these zones, a 7-day cleaning cycle is standard to keep soiling losses below the 1.5% threshold. Conversely, inland plants near industrial hubs often face heavy, dry particulate loading that creates a persistent, opaque layer, requiring a balanced, sensor-triggered schedule to prevent energy yield degradation.
The following table outlines the recommended operational parameters for various environments found within the state:
| Site Environment | Average Soiling Loss Rate | Recommended Cycle | Primary Cleaning Priority |
|---|---|---|---|
| Coastal/Salt-Mist | 1.2% - 1.8% / day | 5 - 7 Days | Salt and moisture removal |
| Inland/Industrial | 0.8% - 1.5% / day | 10 - 15 Days | Particulate/Dust removal |
| Dry/Arid Plains | 0.3% - 0.7% / day | 20 - 30 Days | General dust mitigation |
The shift to condition-based cleaning is essential for operational efficiency. Instead of fixed monthly intervals, operators should utilize local soiling rate sensors to trigger the robot fleet when performance drops by a pre-set percentage, such as 2% to 3%. This prevents the accumulation of deep-set soiling that necessitates more aggressive cleaning, which in turn preserves module anti-reflective coatings. By automating the trigger, plant managers can ensure that the cost of cleaning remains directly proportional to the actual revenue being recovered from the plant.
Technical constraints of integrating automation in existing plant infrastructure
Retrofitting an existing plant with cleaning automation involves addressing specific structural and electrical constraints. The primary challenge involves row-end space requirements, as most autonomous robots require a flat, paved or compacted docking area to charge and transition between rows. Managers must assess whether existing gravel or soil surfaces meet the stability requirements for the specific charging station weight, which for a CRADYL platform is 220 kg.
Electrical integration also demands careful planning. Robots must have access to reliable power, typically sourced directly from a dedicated tap-off on the module string or an auxiliary AC supply. Consistent connectivity is another technical hurdle; utility-scale sites often span large areas with varying signal strength. Using mesh-network based communication protocols, such as the NECTYR framework, ensures that robots remain synchronized and report real-time cleaning logs even in remote or isolated plant segments. Operators should conduct a full site audit to map these communication gaps before finalizing the fleet deployment strategy.
Beyond communication and docking, one must consider the impact of tilt-induced strain. During the monsoon season in Odisha, the frequency of movement for trackers increases to accommodate changing sun paths and high-wind protection modes. If an automated robot is currently mid-cycle during a sudden wind-stow maneuver, the robotic unit must have an automated parking feature to prevent collision with tracker components. Evaluating the firmware's ability to communicate with the SCADA system ensures that cleaning cycles are paused, resumed, or canceled based on real-time meteorological data and tracker orientation commands.
Managing water usage and cleaning residuals
For large-scale utility operations in Odisha, the transition to waterless cleaning systems is primarily driven by the need for operational sustainability. Water consumption for manual cleaning typically ranges from 1 to 2 liters per panel per cycle. At a 50 MW site, this requires sourcing and logistics for hundreds of thousands of liters, which can be an operational liability during dry seasons. Robotic systems, such as the GLYDE-X or NYUMA-X, eliminate this requirement entirely, potentially saving up to 90% of the water traditionally consumed in plant O&M.
Beyond water savings, managing cleaning residuals is critical for maintaining module health. In high-humidity coastal zones, accumulated dust can form a cement-like crust if mixed with water during manual cleaning, leading to long-term shadowing losses. Dry cleaning methods prevent this hydration process, ensuring that the module glass remains pristine. When evaluating cleaning robot deployments, ensure the selected technology uses non-abrasive materials like microfiber or UV-stable PBT brushes to protect sensitive anti-reflective coatings. These materials are essential for avoiding micro-scratches that degrade long-term module performance and risk warranty compliance.
Additionally, the absence of water eliminates the risk of water spot deposition and mineral scaling. In Odisha’s geography, groundwater sources often possess high total dissolved solids (TDS), which can leave a white, mineralized residue on module surfaces when used for manual cleaning. This residue creates a semi-permanent occlusion that requires stronger cleaning chemicals to remove, creating a negative cycle of increased labor and material costs. By switching to dry, automated, and microfiber-based solutions, operators secure the longevity of the module surface while effectively neutralizing the operational risks associated with local water quality variations.
Key takeaways for plant managers
- Audit row-end clearance before installation, specifically checking for a minimum 2–3 meter flat docking space for robots and row-transfer platforms like the CRADYL.
- Prioritize condition-based cleaning schedules over calendar-based ones to reduce mechanical wear and unnecessary cleaning operational costs.
- Ensure communication reliability by mapping signal coverage across your plant perimeter, favoring protocols like NECTYR that support mesh-network synchronization.
- Select cleaning materials based on your regional dust profile, using soft microfiber for coastal salt-laden sites and PBT brushes for dry, particulate-heavy inland environments.
- Monitor robot fleet battery health and ensure that charging dock placement aligns with the plant's peak irradiance hours to maximize energy recovery during operation.
Sources and further reading
Frequently asked questions
Managing utility-scale solar performance in Odisha requires a precise approach to cleaning that balances the state's high humidity with the industrial dust profiles typical of inland energy corridors. Asset owners can optimize generation by moving away from reactive, interval-based cleaning toward data-driven, condition-based automation.
The primary requirement is an initial site topography assessment to ensure robots have adequate clearance on single-axis trackers. Site readiness also depends on evaluating if the facility faces high soiling losses, typically ranging from 10% to 25%, where the cost of manual cleaning exceeds the long-term investment in automation.
Yes, automated systems provide a controlled, consistent mechanical process that eliminates the inconsistent pressure and physical strain often applied by manual labor. By using robotic dry-cleaning technology, you can remove particulate matter safely without the high-pressure water impacts that can cause damage over time.
Cleaning cycles are triggered by data from soiling rate sensors that measure actual irradiance losses. In Odisha, optimal frequency usually varies from 7 to 15 days, calibrated to counteract the specific industrial dust profiles and humidity-induced crusting found at the site.