Summary for plant managers
For utility-scale asset owners in India, moving away from fixed-interval cleaning is the most effective way to protect the Performance Ratio (PR) of MW-scale plants, a decision that heavily influences Opex vs Capex solar O&M contracts in India. Cleaning frequency optimization using weather data allows O&M teams to stop cleaning on a calendar basis and start cleaning based on actual soiling accumulation and predicted meteorological events.
- Typical soiling loss in arid Indian regions: 0.3% to 1.0% per day (region-dependent).
- Optimization goal: Initiate cleaning when the predicted soiling loss exceeds the marginal cost of the cleaning operation.
- Rainfall trigger: Utilize 5mm+ of clean rain as a natural 'free' cleaning event to reset the soiling baseline.
- Data requirement: Integration of localized weather station data or reliable API feeds providing wind speed, dust concentration, and precipitation metrics.
By implementing these data-driven thresholds, plant managers can avoid the common pitfall of "cleaning debt," where dust layers become cemented due to infrequent washes, or the waste of OPEX caused by cleaning too often during high-humidity or rainy periods. This approach is particularly critical for large-scale portfolios aiming to meet the MNRE 500 GW non-fossil mandate by 2030, where O&M efficiency directly dictates long-term LCOE.
The mechanics of cleaning frequency optimization using weather data

Achieving true cleaning frequency optimization using weather data requires transitioning from a reactive O&M posture to a predictive one. Instead of following a fixed schedule, plant managers must create a feedback loop between real-time environmental telemetry and cleaning deployment. This process involves three core mechanical layers: data ingestion, soiling modeling, and execution triggering.
1. Data Ingestion and Sensor Integration
The foundation is a high-fidelity data stream. For MW-scale plants in India, relying on regional weather reports is insufficient due to micro-climates in arid zones like Rajasthan or Gujarat. Effective optimization requires onsite weather stations or localized API feeds that provide:
- Particulate Matter (PM10/PM2.5): To estimate dust deposition rates.
- Wind Velocity and Direction: To predict sandstorm events that can cause rapid, heavy soiling.
- Precipitation Metrics: To identify natural cleaning events (rain) that can reset the soiling baseline.
- Humidity Levels: High humidity in coastal regions can lead to 'cemented' dust, requiring different cleaning approaches than dry desert dust.
2. The Soiling Loss Model
Once data is collected, it is fed into a soiling model to estimate the current Performance Ratio (PR) degradation. This model calculates the gap between the expected theoretical yield (based on irradiance) and the actual measured yield. By correlating this gap with accumulated dust metrics, the system can estimate the rate of soiling loss per day. For instance, in many Indian utility sites, daily soiling loss is estimated in the range of 0.3% to 1.0% depending on local wind and dust patterns.
3. The Decision Engine and Execution Trigger
The final layer is the decision engine, which compares the cost of cleaning against the cost of energy loss. This is where optimization occurs. The engine uses the following logic:
- Calculate Marginal Loss: If the daily soiling loss is 0.5% and the plant produces 10 MW, the loss is 50 kWh per day.
- Evaluate Cleaning Cost: The engine calculates the O&M cost of a single cleaning cycle (whether via manual labor or an automatic solar panel cleaning system).
- Trigger Execution: When the cumulative revenue lost to soiling exceeds the operational cost of the cleaning cycle, a cleaning task is automatically generated.
This predictive approach prevents 'over-cleaning' during monsoon seasons and 'under-cleaning' during peak dust months, ensuring that every cleaning event directly contributes to the bottom line. This level of precision is a core component of modern utility-scale solar operations, moving beyond guesswork to mathematical certainty.
How does local weather impact soiling rates in Indian MW plants?
In India, weather is the primary variable that dictates the effectiveness of cleaning frequency optimization using weather data. Because solar plants are often spread across vast, climatically diverse landscapes, a single cleaning schedule for a national portfolio is a recipe for both energy loss and wasted O&M budget. The impact of weather manifests differently depending on the specific climatic zone of the asset.
Arid and Semi-Arid Zones (Rajasthan, Gujarat)
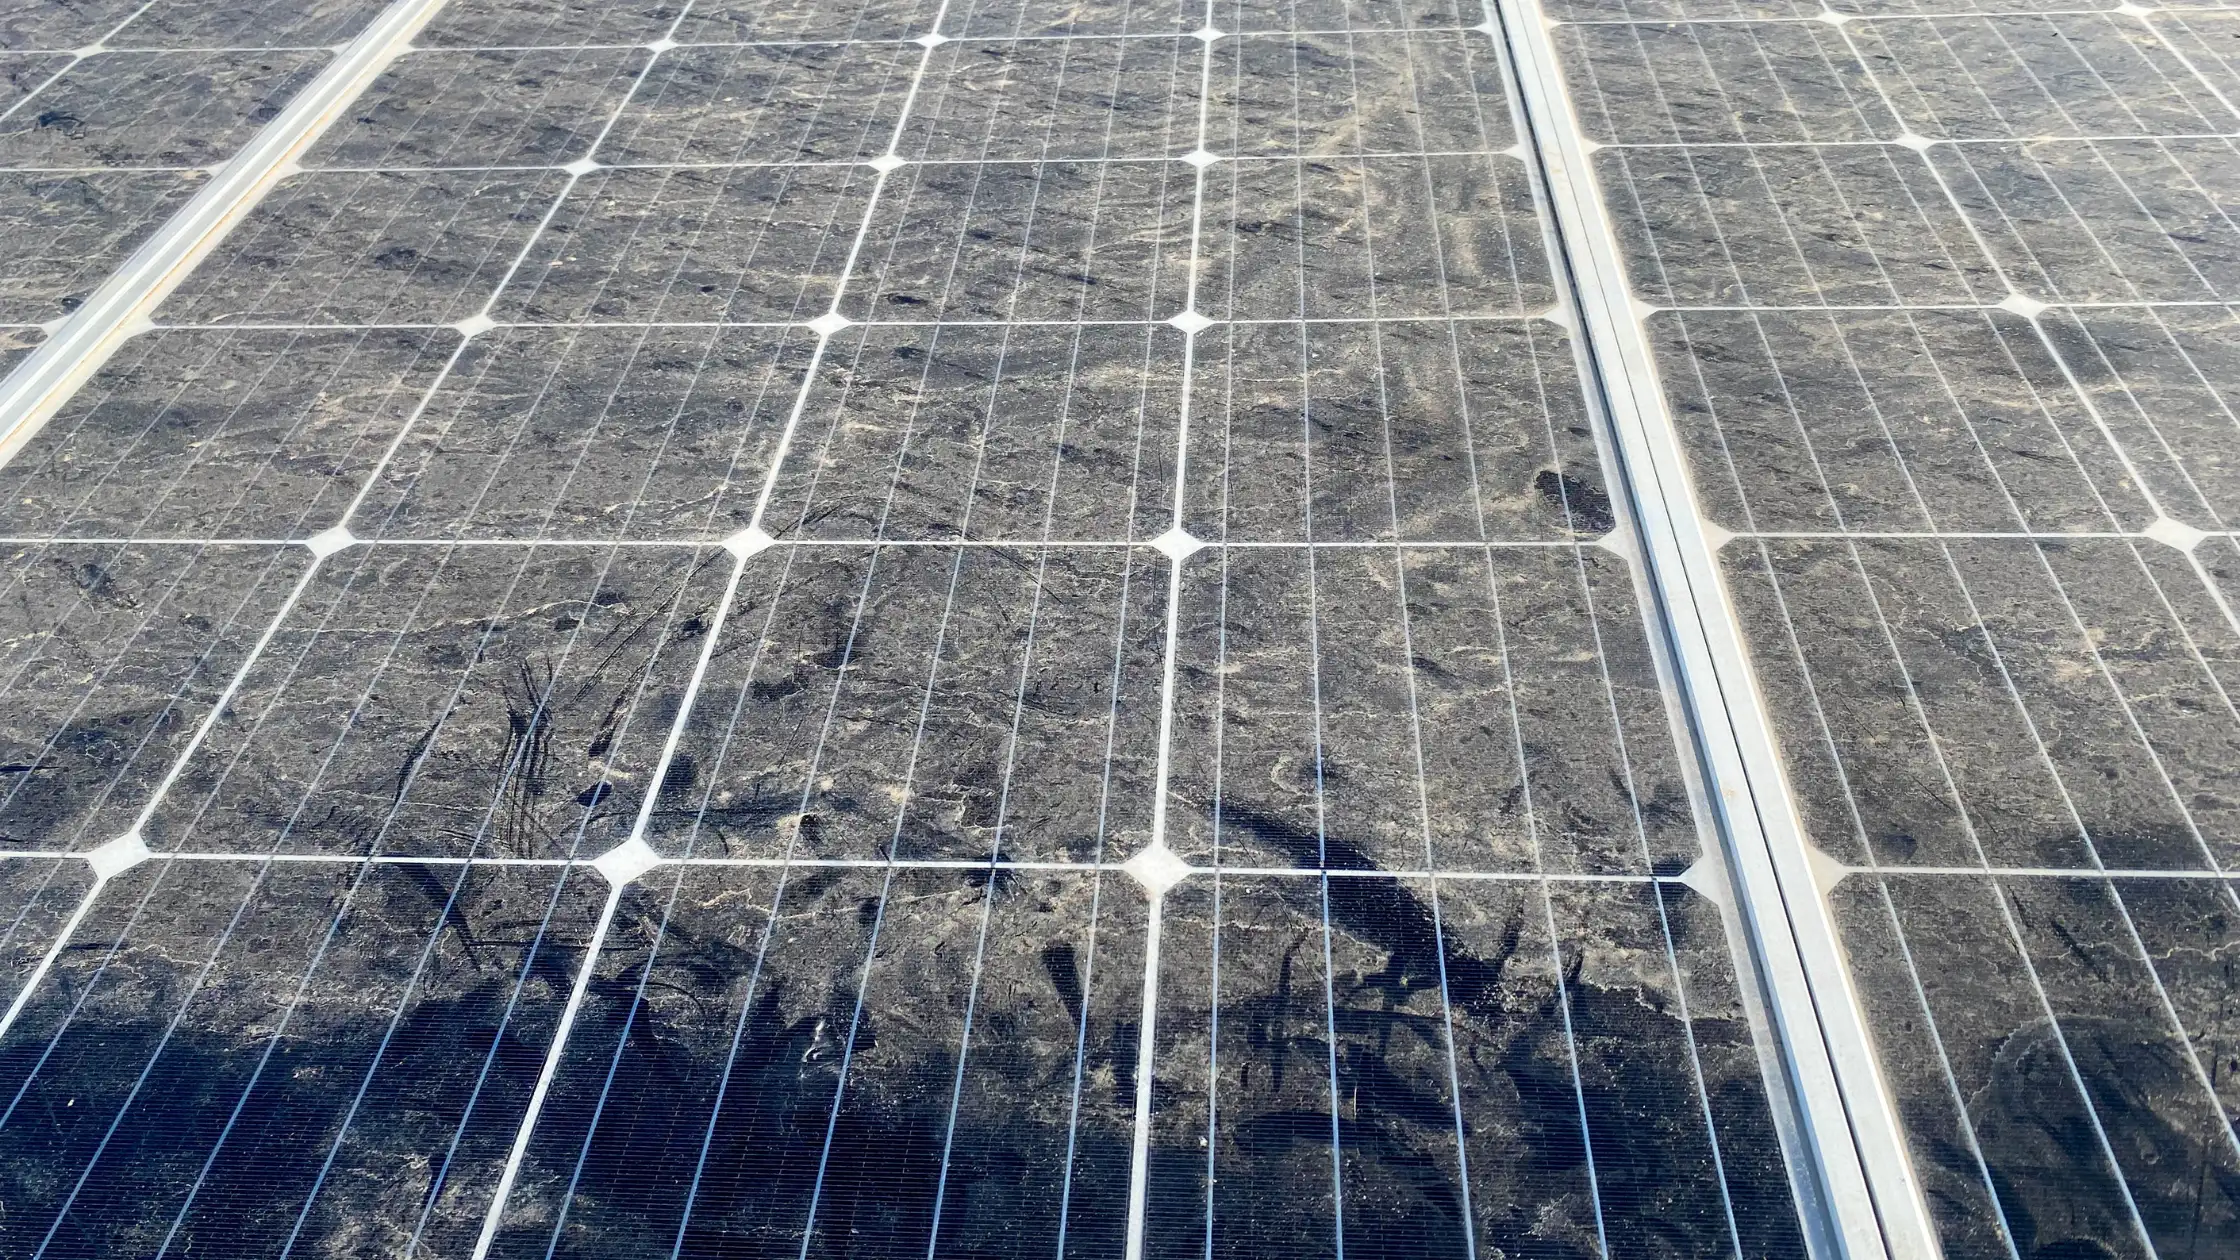
Plants in these regions face the highest soiling challenges due to high dust loads and frequent wind events. In these zones, soiling can cause a daily energy yield loss in the estimated range of 0.3% to 1.0% per day. The main challenge here is not just the volume of dust, but the nature of the particulate matter. High wind speeds can deposit fine, abrasive dust that settles deep into the module textures. Furthermore, infrequent but heavy rain can turn this dust into a hardened, cement-like layer, making standard manual cleaning difficult and potentially damaging the anti-reflective coating if not managed with appropriate waterless technology, as discussed in our overview of Pv modules, methods, costs, and robot options.
Monsoon and High-Humidity Zones (Coastal Karnataka, Kerala, Maharashtra)
In coastal and monsoon-heavy regions, the primary driver is not constant dust accumulation, but rather moisture-related soiling. High humidity levels often lead to 'biological soiling' (mold or algae growth) or the stabilization of salt aerosols from the sea. While heavy monsoon rains provide a natural cleaning effect, they can also leave behind streaks and mineral deposits as the water evaporates. For these plants, optimization focuses on identifying the window immediately after the monsoon peak when humidity remains high but rainfall has subsided, as this is when moisture-bonded dust is most difficult to remove without efficient cleaning technology.
The Impact of Seasonal Cycles
The transition between seasons creates significant volatility in soiling rates. For example, the pre-monsoon period in many parts of India often sees a massive spike in particulate matter due to dry winds and agricultural activities. During these months, the frequency of cleaning must increase to prevent the cumulative soiling loss from impacting the annual Performance Ratio (PR). Conversely, during the peak monsoon, the decision engine should shift toward postponement to avoid the high cost of cleaning modules that will be washed by rain within 48 to 72 hours. This seasonal intelligence is what separates a reactive manual cleaning program from a sophisticated, data-driven O&M strategy used in utility-scale solar operations.
A step-by-step implementation guide for predictive cleaning schedules
Transitioning from a fixed-interval schedule to cleaning frequency optimization using weather data requires a structured integration of telemetry, local meteorology, and financial modeling. For utility-scale plants in India, this is not merely about cleaning more often; it is about cleaning at the mathematically correct moment to protect the Performance Ratio (PR) while minimizing O&M spend to maximize the Solar Plant ROI and payback period.
Follow these five steps to implement a data-driven cleaning protocol on your MW-scale site:
- Establish a Baseline Soiling Rate: Before automating, you must understand your site's specific dust deposition velocity. Use pyranometers and soiling sensors (or analyze historical PR drops) to determine how many percentage points of energy yield are lost per day. In arid zones like Rajasthan, this baseline might be as high as 1.0% daily loss.
- Integrate Local Meteorological Feeds: Connect your plant's SCADA or O&M platform to high-resolution local weather services. You need real-time data on wind speed (for dust transport), humidity (for moisture-bonded soiling), and forecasted precipitation (to avoid cleaning before rain).
- Define Performance-Based Triggers: Instead of cleaning every 15 days, set thresholds based on cumulative loss. A common industry benchmark is to trigger a cleaning cycle when the estimated soiling loss reaches a specific threshold, typically between 2% and 5% of potential daily generation.
- Correlate with Cleaning Method Efficiency: Your schedule must account for the technology used. For instance, if using an automatic solar panel cleaning system like the GLYDE series, the rapid, waterless nature of the robot allows for more frequent, low-cost interventions compared to traditional manual wet cleaning, which has higher logistical overhead.
- Automate the Execution Loop: Link your triggers to your cleaning fleet management software, such as NECTYR. When the weather data and soiling models hit the threshold, a cleaning task is automatically dispatched to the robots, ensuring the most efficient use of uptime.
Operational Checklist for MW-Scale Implementation
- Data Validation: Verify that weather station data is calibrated; faulty humidity readings can lead to unnecessary cleaning cycles.
- Resource Availability: Ensure robot charging cycles and crew shifts (for semi-automatic systems) are synchronized with the predicted optimal cleaning windows.
- Financial Audit: Regularly review the cost of the cleaning event against the revenue recovered. If the cost of the cleaning cycle exceeds the value of the energy regained, your threshold is too low.
Defining decision thresholds: Rainfall, Dust, and PR impact
Optimization is not about cleaning more often; it is about defining precise mathematical triggers that balance the cost of a cleaning event against the value of the energy recovered. To achieve cleaning frequency optimization using weather data, plant managers must move away from arbitrary weekly schedules and toward a multi-factor threshold model. This model typically weighs three critical variables: cumulative soiling loss (%), forecasted precipitation (mm), and the real-time impact on the Performance Ratio (PR).
The Rainfall Trigger: Avoiding Redundant Cycles
Rainfall is the most significant natural cleaning event in the Indian climate, particularly during the monsoon. A data-driven schedule uses weather API integration to identify high-probability rain events. If the forecast predicts rainfall exceeding 5 mm within the next 48 to 72 hours, all scheduled cleaning tasks should be postponed. Performing a cleaning cycle immediately before a significant rain event results in a direct loss of O&M budget with zero net gain in energy yield.
Dust and Soiling Thresholds by Region
Dust deposition is highly variable across India. In arid regions such as Rajasthan or Gujarat, the soiling rate can escalate quickly, requiring tighter thresholds. In contrast, coastal or high-humidity zones may experience different soiling profiles, such as salt mist or organic accumulation. For utility-scale plants, we recommend setting specific triggers based on estimated energy loss:
- Arid/Desert Threshold: Trigger cleaning when cumulative soiling loss reaches 2% to 3%. In these zones, dust can accumulate rapidly, and waiting longer can lead to "cemented" layers that require more intensive cleaning.
- Semi-Arid/Dusty Threshold: Trigger cleaning when soiling loss reaches 4% to 5%.
- Monsoon/High Humidity Threshold: Focus on post-monsoon cleaning to remove biological growth or heavy sludge, rather than high-frequency cycles.
Correlating Thresholds with PR Impact
The ultimate metric for success is the Performance Ratio (PR). A sophisticated O&M strategy uses the soiling loss calculator to model how current dust levels are deviating the plant from its theoretical yield. If the PR drops below a site-specific baseline (for example, a 2% deviation from the cleared-module baseline), a cleaning event is triggered regardless of the day count. By integrating these triggers, operators can ensure that every cleaning cycle, whether performed by manual labor or an automatic solar panel cleaning system, is economically justified by the revenue it recovers.
Is weather-based scheduling more efficient than fixed-interval cleaning?
For utility-scale operators, the transition from fixed-interval cleaning to weather-based scheduling is the difference between reactive O&M and proactive asset management. Fixed-interval schedules, such as cleaning every 15 days regardless of conditions, create significant economic inefficiencies. In the Indian context, this often results in two waste scenarios: cleaning immediately before a rain event that would have washed the modules naturally, or waiting too long during a dust storm, allowing soiling to reach critical levels that degrade the Performance Ratio (PR).
Weather-based scheduling is more efficient because it aligns cleaning expenditure directly with revenue recovery. By utilizing local meteorological data, plant managers can optimize the timing of each cycle to maximize the 'cleanliness duration' per rupee spent. This approach is particularly vital for large-scale sites where manual labor or even autonomous fleets require careful coordination to avoid redundant movements.
| Feature | Fixed-Interval Cleaning | Weather-Based Optimization |
|---|---|---|
| Predictability | High (Schedule is set months in advance) | Variable (Requires real-time data feeds) |
| Resource Waste | High (Cleaning may occur right before rain) | Low (Cycles are postponed during rain forecasts) |
| Yield Protection | Moderate (Risk of 'soiling spikes' between cycles) | High (Triggers are set based on dust/PR thresholds) |
| Labor/Robot Utilization | Inefficient (Fixed cycles regardless of need) | Optimized (Deployments target highest-impact windows) |
| O&M Cost Control | Difficult to justify specific event costs | Highly quantifiable via revenue-per-clean metrics |
While fixed schedules are easier to manage from a simple manpower perspective, they cannot account for the volatile climatic shifts seen in regions like Rajasthan or Gujarat. For example, a 50 MW plant in a high-dust zone might see soiling rates jump from 0.5% to 3% in just three days due to localized wind patterns. A fixed 14-day schedule would allow three days of significant energy loss that could have been prevented with a data-driven trigger. Conversely, a fixed schedule might call for cleaning on a Monday, only for a heavy monsoon shower to occur on Tuesday, essentially wasting the entire Monday operation. Integrating fleet monitoring software like NECTYR allows operators to marry these weather triggers with real-time robot availability, ensuring that the most efficient cleaning method is deployed exactly when the data suggests it will yield the highest return.
Technical constraints for MW-scale weather data integration in India
Implementing cleaning frequency optimization using weather data is not as simple as connecting a thermometer to a spreadsheet. At the utility scale (50 MW to 500 MW+), the sheer volume of data and the geographic dispersion of modules create specific technical hurdles that plant managers must overcome to achieve reliable predictive cleaning.
Data Latency and Sensor Reliability
The first constraint is the quality of the input. Many plants rely on generic regional weather forecasts from public APIs. While useful, these often lack the hyper-local precision needed for a specific site in a dust-prone zone like Rajasthan. A forecast might predict rain for a district, but a localized dry spell or a micro-dust event can occur on-site, rendering the global data inaccurate.
For effective optimization, sites require on-site meteorological stations (AWS) that monitor:
- Local solar irradiance and GHI (Global Horizontal Irradiance).
- Wind speed and direction (to predict dust transport).
- Precipitation levels (to identify natural cleaning events).
- Ambient temperature and humidity (to assess the risk of 'cemented' soiling).
If sensor data is delayed or faulty, the automated cleaning triggers will fail, leading to either missed cleaning windows or redundant deployments. Integrating this local data into fleet monitoring software like NECTYR is essential to ensure that the automated cleaning commands are based on real-time, site-specific truth rather than delayed regional averages.
Integration with SCADA and Asset Management Systems
The second major technical hurdle is the communication bridge between weather data, SCADA (Supervisory Control and Data Acquisition), and the cleaning equipment. A truly optimized system requires a closed-loop architecture. The process typically follows this flow:
- Weather sensors and pyranometers capture environmental data.
- The data is processed through an analytics layer to calculate the current soiling rate and projected yield loss.
- The system checks the Performance Ratio (PR) against the theoretical baseline.
- If the 'cleaning trigger' is met, an instruction is sent to the O&M scheduler.
In many Indian utility plants, these systems are currently siloed. The SCADA system knows the energy drop, the weather station knows the dust, but the cleaning crew (whether manual or robotic) is not digitally connected to both. Overcoming this requires a centralized 'intelligence layer' that can translate a 2% PR drop into a specific work order for a automatic solar panel cleaning system or a manual team.
Connectivity in Remote Utility Sites
Finally, connectivity remains a significant constraint. Many large-scale solar parks in arid regions have inconsistent cellular coverage. For a fleet of autonomous robots to operate based on weather-driven triggers, they must maintain a stable link to the central control hub. This is why understanding robot fleet communications on utility solar sites is vital for maintaining connectivity in remote areas. Without robust connectivity, the 'optimization' remains theoretical, as the commands to deploy or postpone cleaning cannot reliably reach the assets in the field.
Key takeaways for O&M optimization
Transitioning from a reactive, manual cleaning schedule to a predictive model using cleaning frequency optimization using weather data is a critical step for utility-scale asset owners. By integrating local meteorological data with real-time performance analytics, plant managers can protect their Performance Ratio (PR) while controlling operational expenses.
- Data-Driven Triggers: Move away from fixed 15-day or 30-day cleaning cycles. Instead, use localized dust accumulation models and rainfall events to trigger cleaning only when the cost of soiling loss exceeds the cost of the cleaning operation.
- Regional Sensitivity: Adjust your threshold logic based on your specific Indian climatic zone. For example, arid regions in Rajasthan may require more frequent monitoring of wind-blown dust, whereas coastal regions might focus more on salt mist and humidity-driven grime.
- Threshold Management: Implement a dual-threshold system. Use a 'Warning' threshold (e.g., a 1.5% to 2% drop in PR) to prep the O&M team, and a 'Critical' threshold (e.g., a 3% to 5% drop) to execute immediate cleaning.
- Technology Integration: For plants exceeding 50 MW, manual scheduling is no longer scalable. Integration with fleet monitoring software like NECTYR allows for the automation of these triggers, ensuring that cleaning robots are deployed precisely when the weather data indicates maximum yield recovery potential.
- Resource Efficiency: Optimizing frequency through data can significantly reduce water wastage and labor costs. In water-stressed regions, moving to a data-driven, waterless robotic approach can reduce water consumption by up to 90% compared to traditional manual wet cleaning.
As India moves toward the MNRE target of 500 GW of non-fossil fuel capacity by 2030, the complexity of managing large-scale solar portfolios will only grow. Mastering these predictive O&M workflows today ensures your assets remain competitive and high-performing throughout their lifecycle.
Sources and further reading
Frequently asked questions
For utility-scale asset owners in India, moving away from fixed-interval cleaning is the most effective way to protect the Performance Ratio (PR) of MW-scale plants, a decision that heavily influences Opex vs Capex solar O&M contracts in India . Cleaning frequency optimization using weather data allows O&M teams to stop cleaning on a calendar basis and start cleaning based on actual soiling accumulation and predicted
In arid Indian regions, typical soiling loss ranges from 0.3% to 1.0% per day. Rather than using a fixed calendar, you should optimize cleaning by initiating it when the predicted soiling loss exceeds the marginal cost of the cleaning operation.
Yes, weather data can minimize water usage by identifying natural cleaning events. For example, you can use a rainfall trigger where 5mm or more of clean rain serves as a free cleaning event to reset the soiling baseline.
Dust storms can cause rapid and heavy soiling. By monitoring wind velocity and direction through localized weather stations or APIs, plant managers can predict these events and adjust cleaning schedules to mitigate significant soiling losses.