Quick summary for plant managers
For utility-scale portfolios in India ranging from 25–100 MW, the decision between CAPEX and OPEX models for your module cleaning system hinges on long-term Performance Ratio (PR) targets and cash flow liquidity. While CAPEX models require higher initial outlay, they typically deliver internal rates of return (IRR) that outpace contract-based cleaning costs within three years due to significant reductions in recurring labor and water expenses.
- CAPEX ROI: Most 25 MW+ sites see full cost recovery within 24–36 months by reducing O&M headcount by 60–80%.
- Generation Gain: Automated waterless cleaning systems can recover 5–25% of energy generation losses typically caused by high soiling levels in arid Indian climates.
- Water Conservation: Traditional cleaning consumes 7,000–20,000 liters per MW; robotic waterless systems reduce this volume by up to 90%.
- Contractual Risk: OPEX models shift cleaning performance risk to third-party providers, though asset owners must account for escalating labor costs and potential performance inconsistencies over the long term.
- Infrastructure Compliance: Per CEA 2023 regulations, all integrated cleaning infrastructure must ensure clear, 75 cm minimum pathways between module rows for safety and maintenance.
CAPEX vs OPEX: Financial modeling for utility-scale portfolios
Deciding between a capital-heavy robotic deployment and a service-based cleaning contract is essentially a trade-off between control, risk mitigation, and long-term asset degradation management. For a 50 MW plant, the choice impacts not only the annual O&M budget but also the plant's ability to maintain a stable Performance Ratio (PR) under varying dust accumulation patterns.
The CAPEX Model: Asset-Backed Efficiency
In a CAPEX model, the plant owner procures the hardware outright, such as installing autonomous waterless robots like the GLYDE or NYUMA series. This approach treats cleaning infrastructure as a depreciable asset. The primary financial benefit is the elimination of recurring service fees, allowing the owner to control cleaning frequency precisely based on real-time SCADA data. By investing upfront, you lock in operational costs and insulate the project against the rising minimum wage and labor availability risks that frequently plague large-scale O&M contracts.
The OPEX Model: Outsourced Risk
An OPEX-based model relies on third-party service providers who utilize either manual labor or their own robot fleets. This model is often preferred by developers looking to minimize upfront capital deployment during the initial project phase. However, it introduces variability. If the service provider’s labor force is stretched thin or if their cleaning equipment lacks the sophistication to handle local dust profiles, the plant may suffer consistent PR penalties. When evaluating service agreements, owners should compare the cumulative cost of these services over a 10-year horizon against the one-time investment of a robot fleet, ensuring that factors like robot battery degradation and maintenance are fully accounted for.
Decision Matrix: Selecting your cleaning system model
| Criteria | CAPEX (Autonomous Robots) | OPEX (Service/Manual) |
|---|---|---|
| Initial Investment | High (Upfront cost) | Low (Service fees) |
| Long-term O&M Cost | Predictable / Lower | Variable / Escalating |
| Control & Scheduling | Full (Via SCADA/NECTYR) | Limited to Contract Terms |
| Risk Profile | Hardware Maintenance Risk | Performance & Labor Risk |
| Water Dependency | Minimal (Waterless focus) | Often High (Manual/Wet) |
For portfolios targeting high uptime, understanding how these models affect your solar plant ROI and payback period is essential. Managers must verify if the chosen cleaning technology aligns with the site's solar panel performance specifications, as regular, gentle cleaning cycles are necessary to prevent micro-cracks or surface abrasion that can prematurely degrade high-efficiency modules.
How often should a 25–100 MW plant clean modules to optimize ROI?
For utility-scale assets in India, the cleaning frequency is rarely a fixed calendar schedule; it is an economic balancing act between the cost of cleaning and the revenue loss from energy yield degradation. In high-soiling regions like Rajasthan or coastal Gujarat, where dust accumulation can erode performance by 0.5% to 1% daily, a dynamic cleaning cycle is mandatory to protect the Performance Ratio (PR). For a 50 MW plant, the inflection point where the cost of a cleaning cycle meets the value of reclaimed energy usually triggers an automated response.
Most large-scale IPPs in India are shifting toward a trigger-based approach rather than periodic intervals. By monitoring soiling loss in real-time through Performance Ratio (PR) monitoring, asset managers can initiate cleaning cycles only when the lost revenue exceeds the operational cost of the cleaning service or the battery energy consumed by an autonomous robot. A 25–100 MW site can typically expect to initiate cleaning every 7 to 15 days in dry seasons, extending to 30 days during monsoon months when natural precipitation assists in panel maintenance.
The Economic Threshold of Cleaning
To determine your optimal frequency, you must first establish the site-specific soiling rate. If your plant experiences a 10% yield loss over 20 days, and your current PPA tariff justifies a daily loss of ₹0.50 per watt-peak, the investment in a robot is essentially self-funding. Unlike manual cleaning, which incurs a labor cost per module regardless of the soiling level, an automated module cleaning system allows for variable frequency. You can prioritize high-output hours or dust-prone blocks without increasing your headcount or risking the integrity of your solar panel performance specifications.
Integration of cleaning systems with SCADA and M2M platforms
Modern utility-scale solar farms in India are increasingly integrating their cleaning infrastructure directly into the central SCADA (Supervisory Control and Data Acquisition) system. This integration is no longer a luxury; it is a regulatory expectation to comply with data reporting standards, including those from the Ministry of New and Renewable Energy (MNRE). For a 25–100 MW portfolio, the cleaning robot acts as an intelligent edge device, feeding data back to the central server via Machine-to-Machine (M2M) communication.
Data-Driven Operations and Fleet Control
When a module cleaning system is linked to your site SCADA, it does more than just move across the rows. It reports battery health, path obstructions, and cleaning success rates back to a centralized dashboard like NECTYR. This connectivity enables:
- Real-time Status Monitoring: Track which robot is operating in which block, ensuring that even if a system encounters a fault, the rest of the fleet maintains optimal output.
- Predictive Maintenance Alerts: Automated systems can signal if a robot’s cleaning efficiency is dropping due to brush wear or mechanical misalignment, allowing for proactive maintenance before the next cycle starts.
- Automated Reporting for ESG Compliance: By logging every cleaning event, water saved (in waterless systems), and energy yield recovery, plant managers can generate automated ESG reports that satisfy investor requirements for sustainability performance.
Furthermore, M2M communication allows the plant to respond to local environmental conditions. If weather stations integrated with the SCADA detect a high-velocity dust storm, the cleaning system can automatically dock or switch to a standby mode to avoid mechanical stress. This level of synchronization is essential for asset owners who need to maintain 99% cleaning efficiency while keeping operational labor expenses at 60–80% below the cost of traditional manual cleaning models.
For portfolios that are currently evaluating their O&M budgets, migrating to a SCADA-integrated system allows you to accurately calculate your solar plant ROI and payback period by removing the guesswork associated with historical manual cleaning records. As you scale from 25 MW to 100 MW, the ability to control, monitor, and report on the entire fleet via a single, secure, and localized data platform becomes the most significant differentiator between high-performance IPPs and those burdened by high operational variability.
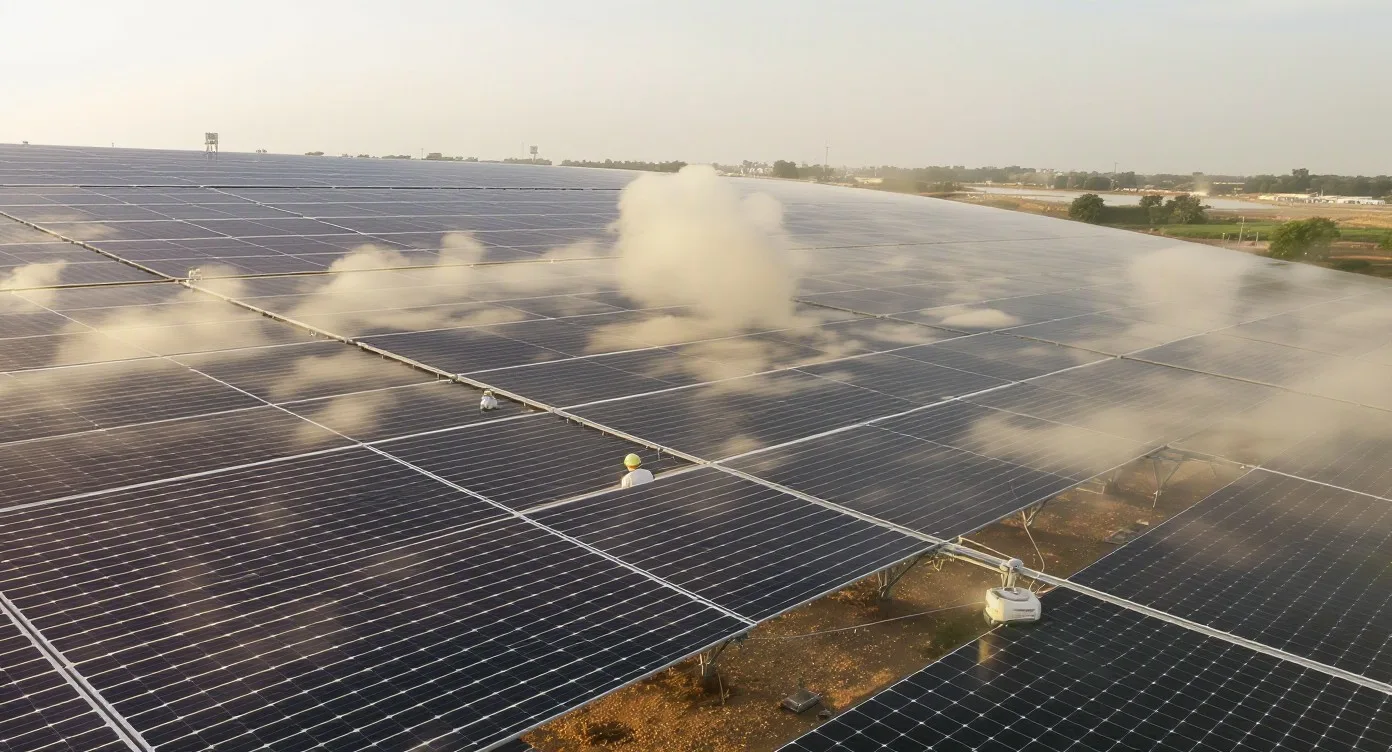
Performance impact: Analyzing dust and soiling in Indian grid conditions
For utility-scale assets operating in regions like Rajasthan or the coastal belts of Gujarat, soiling is not merely a maintenance inconvenience; it is a primary driver of revenue volatility. A thin layer of accumulated dust can induce an energy generation loss ranging from 5% to 25%, depending on the local composition of the particulate matter. In high-dust environments, the Performance Ratio (PR) of a plant can degrade by up to 1% per day if left unmanaged, turning a 100 MW portfolio into a significantly underperforming asset within a single month of peak dry season.
When evaluating the performance impact, asset managers must distinguish between soft dust and adhesive soiling. While soft dust can be cleared with airflow, persistent soiling often requires physical contact to prevent the formation of a "hardened cake" that resists natural cleaning events like wind or light rain. Robotic systems, particularly those utilizing dual-pass microfiber technology, are specifically designed to address this by combining controlled airflow with mechanical agitation. This restores the module surface to near-factory reflectivity, directly contributing to the 15.2% average performance gain observed in utility-scale plants that shift from periodic manual intervals to high-frequency automated cleaning.
Grid Stability and Ancillary Services
For independent power producers (IPPs) providing ancillary services to the grid, consistency of generation is paramount. Unpredictable output due to localized soiling hotspots forces grid operators to rely on less efficient backup sources, which can eventually impact your project's commercial viability under strict PPA terms. By deploying an autonomous module cleaning system, managers ensure that the daily generation profile remains predictable. Real-time integration with plant monitoring platforms allows the cleaning schedule to adjust dynamically to the soiling rate, ensuring that the plant consistently meets its committed energy injection targets regardless of regional weather patterns.
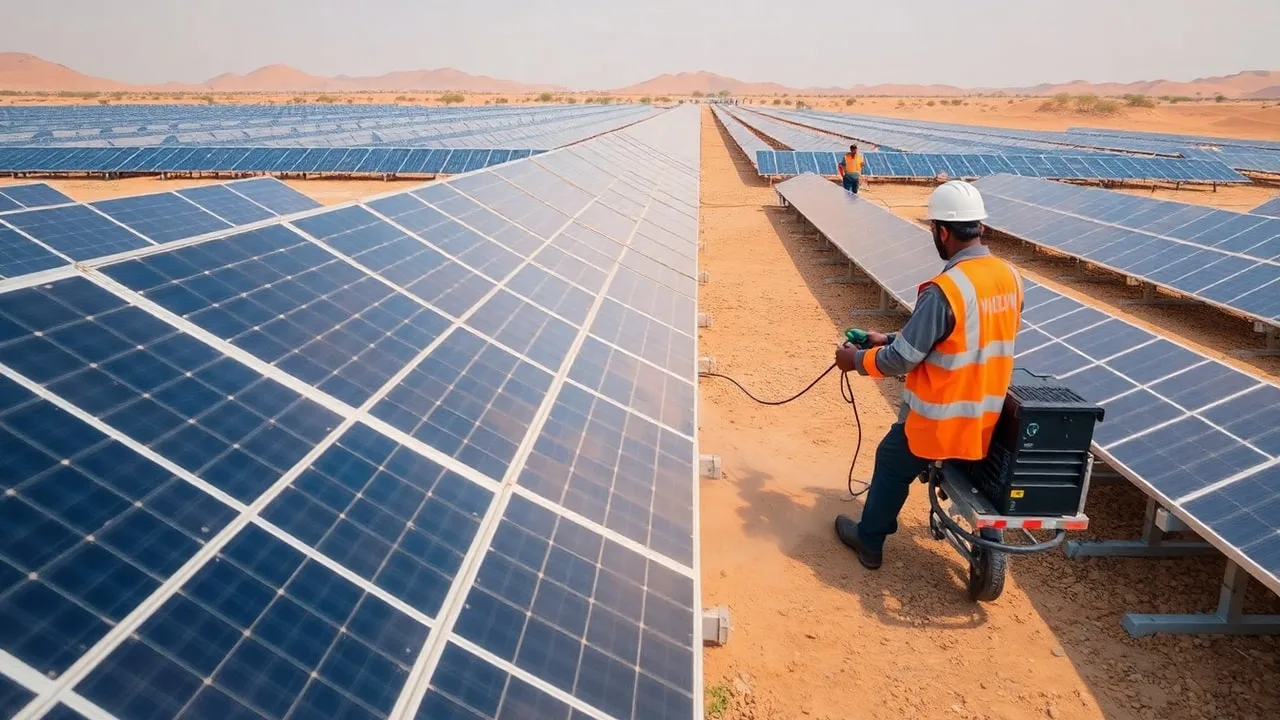
Comparing cleaning technologies: Manual labor vs autonomous systems
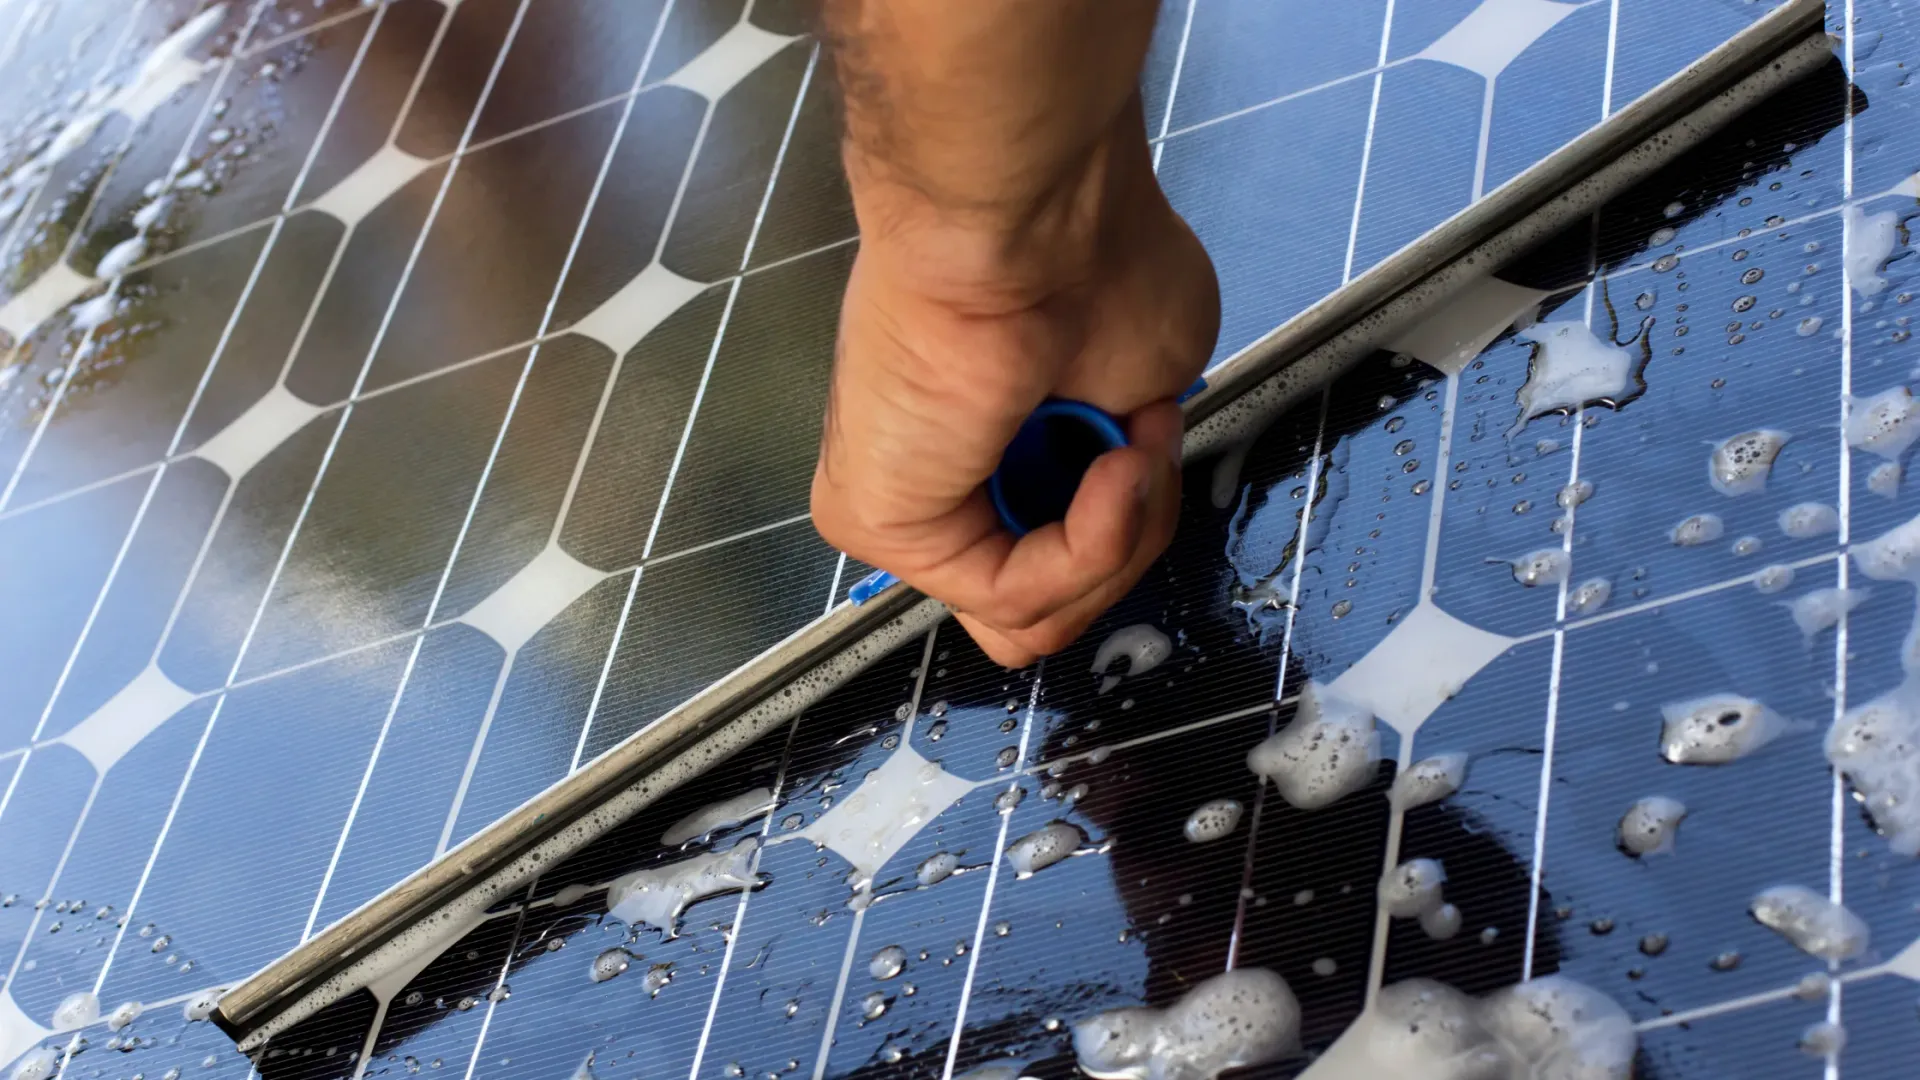
The choice between manual cleaning contracts and autonomous robotic infrastructure is fundamentally a transition from variable operational expenditure to optimized asset investment. Manual cleaning involves recurring labor costs, water procurement, and the logistical burden of coordinating teams across expansive MW-scale sites, often leading to inconsistent cleaning quality and the risk of micro-cracking caused by harsh manual brushing.
In contrast, robotic systems, whether operating on fixed-tilt or single-axis trackers, provide a standardized cleaning outcome. The following matrix illustrates the operational and financial decision criteria for asset owners comparing these methodologies:
| Decision Criteria | Manual Cleaning | Autonomous Robotic System |
|---|---|---|
| Cleaning Frequency | Low (weekly/monthly) | High (daily/on-demand) |
| Water Usage | High (7k–20k litres/MW) | Minimal to Zero |
| Labor Dependency | High (Variable headcount) | Low (Supervisory only) |
| Module Degradation Risk | High (Potential for damage) | Low (Precision-engineered) |
| Integration/Data | Manual logging | Real-time SCADA/M2M |
| Primary Opex Driver | Labor Wages/Logistics | Energy Recovery/Efficiency |
For portfolios ranging from 25–100 MW, the economic argument for robots is built on the reduction of labor expenses by 60–80% compared to traditional manual methods. Furthermore, because robotic cleaning is autonomous and waterless, it effectively mitigates the "hidden" costs of water sourcing and transport in arid utility-scale environments. While the upfront investment is higher, the TCO (Total Cost of Ownership) over a 5-year period typically favors automated systems when accounting for the consistent energy yield recovery and the elimination of ongoing cleaning service contract premiums. For asset managers looking to optimize their solar plant ROI and payback period, replacing high-risk manual labor with reliable, AI-scheduled robotic fleets is the most viable path to maintaining a competitive Performance Ratio (PR).
As you scale, remember that the reliability of your chosen technology is as critical as its cost. Leveraging systems that provide validated performance, such as those that have surpassed the best PV panel performance specifications, ensures that your cleaning infrastructure protects the long-term integrity of your modules rather than accelerating their depreciation.
Checklist: Selecting your module cleaning system model
Choosing the right module cleaning system requires an objective assessment of site-specific variables, including topography, tracker type, and soiling profiles. For 25–100 MW portfolios, this checklist ensures that your technical requirements align with your long-term operational budget and site constraints.
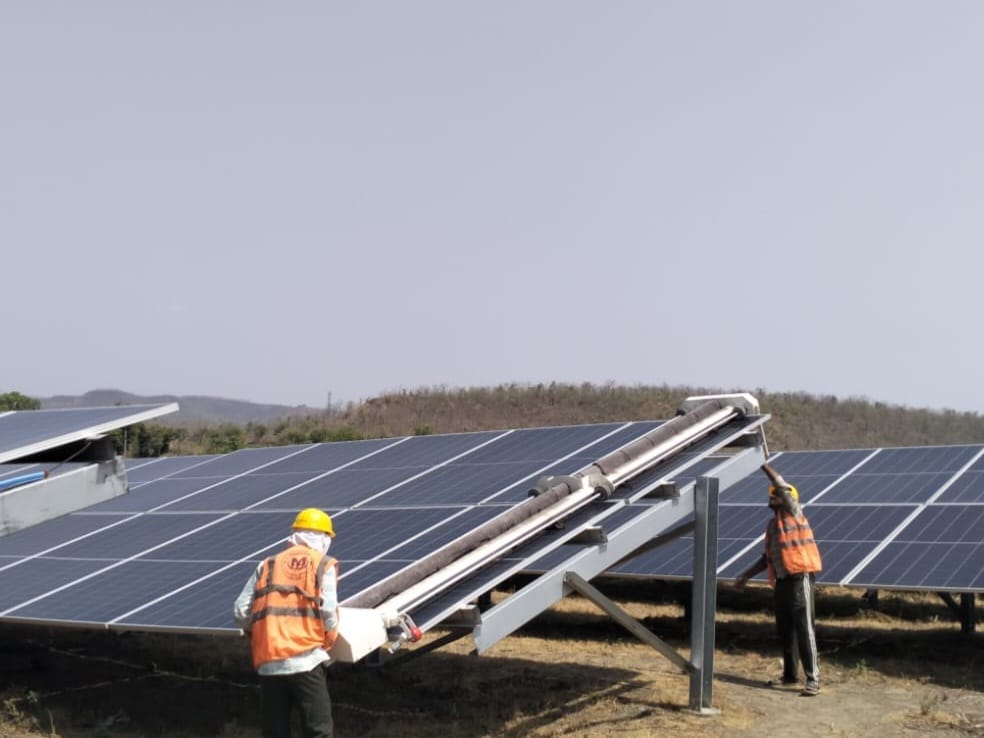
- Site Layout Compatibility: Does your site use fixed-tilt, seasonal-tilt, or horizontal single-axis trackers? For tracker-based sites, prioritize systems with flexible bridge articulation like the GLYDE-X or NYUMA-X to ensure safe passage across moving arrays.
- Cleaning Technology Requirements: Assess your site’s specific soiling challenge. In high-dust environments where abrasive particles are common, a dual-pass cleaning system (airflow + microfiber) like the GLYDE series provides an extra layer of protection for anti-reflective coatings compared to traditional PBT brushes.
- Autonomy and Integration: Ensure the chosen system supports full integration with your existing SCADA or plant monitoring platforms. Connectivity via NECTYR or similar M2M platforms is essential for real-time reporting, remote fault detection, and automated cleaning scheduling based on live PR degradation data.
- Operational Support and Deployment: Evaluate the manufacturer’s support network. For large-scale Indian projects, prioritizing vendors with local manufacturing, regional warehousing, and a proven track record (e.g., 5 GW+ of collective deployments) mitigates the risk of extended downtime during the warranty period.
- CAPEX vs. OPEX Framework: Define your budget constraints early. If your fiscal priority is minimizing upfront cash outflow, investigate performance-based Opex models that shift the burden of maintenance and hardware upkeep to the service provider, effectively turning a static asset expense into a predictable recurring service fee.
- Power Supply and Charging Logistics: Confirm that the system uses self-charging or docked-charging mechanisms that do not require external manual intervention, which is vital for maintaining the autonomy of large, multi-block sites.
Key takeaways for asset optimization
Maximizing the yield of a utility-scale solar portfolio in India is no longer about simple scheduled maintenance; it is about data-driven, autonomous, and water-efficient operation. By shifting from manual labor to advanced robotic systems, asset owners can secure long-term revenue stability and protect the physical integrity of their modules.
- Prioritize Waterless Systems: In arid and semi-arid regions, waterless technology is the only sustainable choice to meet tightening MNRE sustainability goals and eliminate the logistical costs of water procurement.
- Adopt Predictive Cleaning: Move away from calendar-based cleaning to AI-driven, event-based scheduling. Real-time monitoring allows for targeted cleaning only when soiling thresholds are breached, preserving the mechanical lifespan of your robotic fleet.
- Account for Total Cost of Ownership (TCO): When comparing bids, look beyond the initial price per robot. Factor in the cost of labor for oversight, water consumption, electricity loss from soiling, and the potential impact of manual cleaning damage on module degradation.
- Leverage Data Interoperability: Ensure your cleaning system acts as a part of your digital infrastructure. Seamless data flow between your robotic fleet and plant SCADA is mandatory for achieving the transparency required by modern institutional investors and grid operators.
- Protect Long-term ROI: Your cleaning methodology directly influences your solar plant ROI and payback period. Consistent, high-quality cleaning maintains optimal Performance Ratio (PR) and prevents the revenue leakage caused by persistent soiling layers, which can impact power plant performance by 5–25% in Indian grid conditions.
- Standardize Across Portfolios: For portfolios scaling from 25–100 MW, standardizing your cleaning technology across multiple sites simplifies spare part procurement, training, and fleet diagnostic protocols, ultimately lowering your long-term O&M burden.
Frequently asked questions
For utility-scale portfolios in India ranging from 25–100 MW, the decision between CAPEX and OPEX models for your module cleaning system hinges on long-term Performance Ratio (PR) targets and cash flow liquidity. While CAPEX models require higher initial outlay, they typically deliver internal rates of return (IRR) that outpace contract-based cleaning costs within three years due to significant reductions in recurrin
Automated waterless cleaning systems prevent damage caused by inconsistent manual cleaning methods. By using gentle, waterless robotic technology, operators reduce water consumption by up to 90% compared to traditional methods that use 7,000–20,000 liters per MW. This technology maintains surface integrity while effectively removing dust, allowing plants to recover 5–25% of energy generation losses typically caused by heavy soiling in arid climates.
The main risks of an OPEX model include unpredictable service quality and escalating labor expenses. Because these contracts rely on manual or third-party labor, asset managers are exposed to rising minimum wages and labor availability issues. Furthermore, third-party providers may not always meet performance targets, leading to inconsistent soiling removal and a failure to recover energy generation losses as effectively as automated on-site hardware.
The choice of cleaning technology directly dictates the Performance Ratio by controlling how effectively dust is mitigated. Automated systems allow owners to trigger cleaning cycles based on real-time SCADA data, ensuring optimal generation. Because soiling in India can cause losses between 5–25%, high-frequency robotic cleaning ensures the plant consistently meets its PR targets, unlike manual cycles which are often constrained by labor availability and rising operational costs.