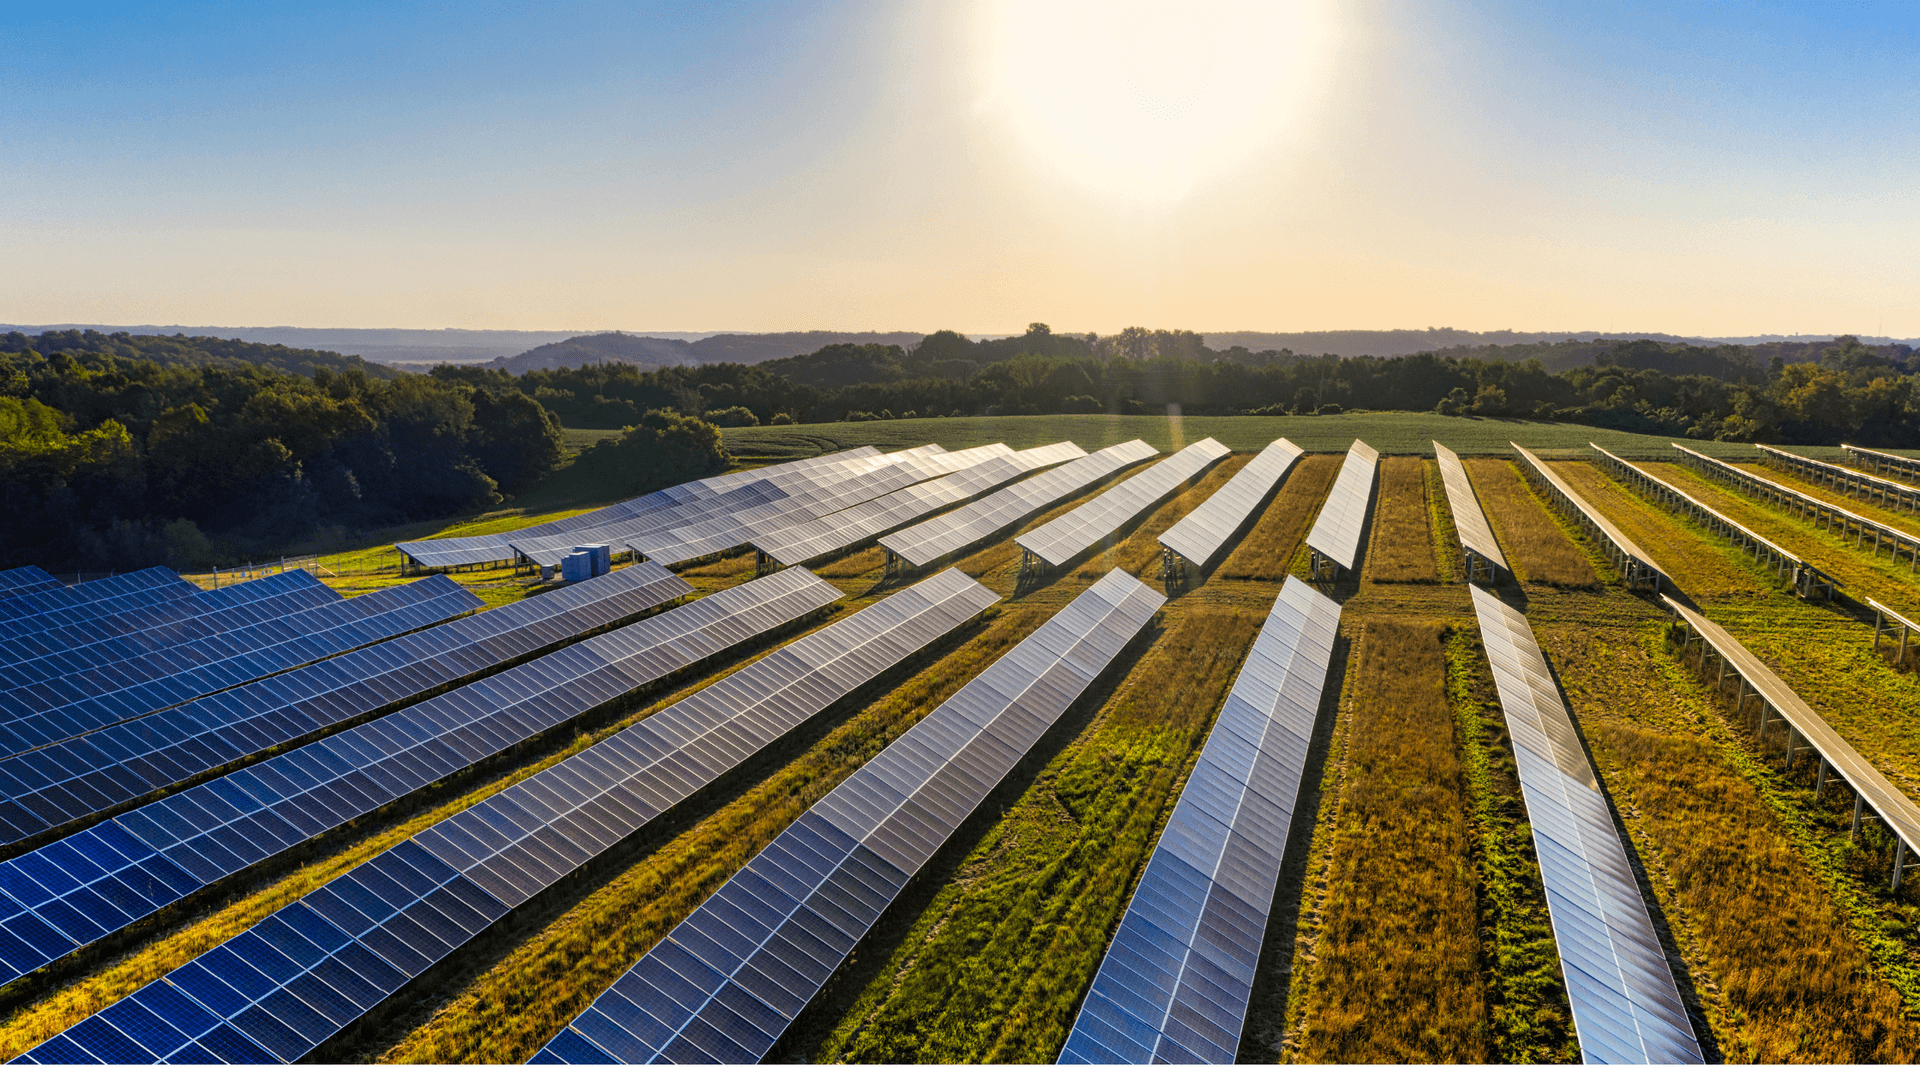
Utility-scale solar installation cost in India is no longer a single headline number. A 100 MW Rajasthan park with owned land, 1.3 DC/AC ratio, and a short evacuation line bears a different capex stack than a 50 MW Maharashtra project leasing agricultural plots and building a 30 km transmission extension. IPPs, lenders, and EPC teams model per-MW economics before they model tariff bids.
This guide breaks down typical ₹/MW ranges for ground-mounted utility plants, how SECI and state auction patterns influence EPC choices, and which line items move most when module prices or grid timelines shift. Figures reflect industry reports and tender disclosures through 2024–2026; validate every budget against supplier quotes and your site survey.
Quick answer
- All-in EPC: roughly ₹3.8–5.5 crore/MW for most greenfield utility builds.
- Modules + inverters: often 55–65% of direct EPC.
- Trackers: add ~₹30–60 lakh/MW vs fixed-tilt.
- Land + evacuation: can add 10–20% beyond bare EPC.
- Contingency: budget 5–8% on EPC plus schedule risk for grid.
What "installation cost" includes at utility scale
Finance teams distinguish bare EPC (modules through substation at plant boundary) from project capex (land, transmission, development, IDC). This article focuses on EPC per MW because that is what developers benchmark in MNRE-linked discussions and SECI bid models. Soft costs and evacuation are called out separately so you do not compare a Rajasthan EPC quote to a fully loaded Maharashtra close-out.
O&M, cleaning, and insurance are operating expenses, not installation cost. They affect project IRR but sit below the line items covered here.
Typical EPC cost stack per MW (2024–2026 indicative)
| Line item | Share of EPC (typical) | ₹/MW range (indicative) |
|---|---|---|
| Solar modules | 38–48% | ₹1.5–2.4 crore |
| Inverters + MV equipment | 10–14% | ₹40–70 lakh |
| Structures (fixed or tracker) | 8–14% | ₹35–75 lakh |
| Cables, combiners, SCADA | 6–10% | ₹25–45 lakh |
| Civil, fencing, roads | 5–8% | ₹20–35 lakh |
| Substation (plant end) | 8–12% | ₹30–55 lakh |
| Installation labour + margin | Balance | Varies by EPC |
Ranges widen with bifacial TOPCon modules, imported tracker brands, and remote logistics. Always reconcile against your bill of quantities.
How SECI and state tender patterns shape capex
When SECI or state agencies clear tranches between roughly ₹2.40/kWh and ₹2.90/kWh depending on year and risk allocation, developers reverse-engineer capex. Lower cleared tariffs force leaner DC/AC ratios, domestic module sourcing under ALMM lists, and aggressive BOS standardization. Industry reports note that winning bidders often anchor module procurement to tier-one contracts signed before financial close.
State-specific factors matter: Gujarat and Rajasthan benefit from mature solar park infrastructure that reduces per-MW civil and internal evacuation cost. Greenfield sites in newer states may pay premium for first-mile roads and water for construction camps.
Fixed-tilt vs tracker: capex and yield trade-off
Fixed-tilt structures remain common on cost-sensitive bids where land is plentiful. Single-axis trackers raise installation cost per MW but boost specific yield 12–18% in many Indian GHI bands according to typical EPC yield reports. The capex premium must clear hurdle rate against incremental MWh at the PPA tariff.
Tracker projects also add motorization, control cabling, and stow logic during commissioning. Budget those in EPC, not as a surprise change order.
Land, transmission, and non-EPC capex
| Cost category | Typical impact | Notes |
|---|---|---|
| Land lease (upfront) | ₹5–25 lakh/MW equivalent | Depends on state ceiling and tenure |
| External transmission | ₹10–80 lakh/MW | Highly site-specific |
| Connectivity charges | ₹3–15 lakh/MW | CTU/STU rules vary |
| Development + IDC | 3–6% of total capex | Financing term sensitive |
Lenders often cap total project cost per MW. A low EPC quote with expensive evacuation can fail debt sizing even when modules are cheap.
Module technology and price volatility
Mono PERC dominated Indian utility supply through 2023–2024; TOPCon share grew in 2025–2026 tenders. Higher-watt modules reduce structure count per MW but may carry price premiums. Industry reports show module cost swings of 15–25% year-on-year tied to polysilicon and freight. IPPs hedge with frame contracts and pass-through clauses where PPAs allow.
Domestic content and ALMM compliance can shift supplier choice without changing wattage, affecting ₹/W more than engineering design.
EPC contracting models and where margin hides
Turnkey EPC lump sums are standard for utility IPPs. Some developers split module supply (developer procured) from BOS installation (EPC installed) to capture supply chain margin. Compare quotes on identical specs: module make, inverter loading, tracker brand, and warranty terms.
Change orders for soil remediation, rock drilling, or delayed grid energization are the usual capex overrun sources. Geotech before bid, not after mobilization.
Commissioning and grid energization timeline risk
Installation cost accrues interest until COD. Industry reports cite 12–18 month build cycles for 50–100 MW plants when evacuation is pre-arranged; grid delay can push IDC and erode equity IRR independent of EPC unit rates. Model delay scenarios in financial close, not only best-case schedules.
Read plant design fundamentals and performance ratio basics for handoff metrics that affect post-COD revenue, separate from capex.
Regional benchmarks developers actually use
Rajasthan and Gujarat solar parks often quote lower per-MW civil and internal infrastructure due to repeatable layouts and experienced contractors. Karnataka and Maharashtra projects may face higher land and labour rates. Southern sites with heavier monsoon soils can increase foundation cost without changing module count.
Compare regional benchmarks only after normalizing tracker share, module wattage, and evacuation distance.
What should a 50 MW IPP budget per MW in 2026?
For a greenfield fixed-tilt plant with tier-one modules, park infrastructure, and moderate evacuation, a planning range of ₹4.0–4.8 crore/MW EPC plus land and transmission is reasonable before contingency. Add tracker premium if yield models justify it. At sub-₹2.80/kWh tariffs, stress-test down 8–10% on module price or up 6 months on COD delay before equity commit.
Financing and IDC: hidden installation cost drivers
Debt drawdown schedules tie installation cost to calendar. Every month between mechanical completion and grid energization accrues interest during construction (IDC) on modules already delivered. Industry reports on utility projects show IDC can reach 4–7% of total project cost when evacuation slips six to nine months. Developers sometimes accelerate module delivery before civil readiness, increasing insurance and storage cost at site.
Lenders size debt on total project cost per MW, not EPC alone. Present consolidated capex including land lease upfront payments, transmission deposits, and contingency reserves in credit submissions. Understating non-EPC items to win equity IRR on paper creates refinance pain at COD.
Benchmarking against SECI tranche economics
Reverse-engineer acceptable EPC from discovered tariffs using your cost of debt, module price curve, and O&M reserve assumptions. When central tranches clear near ₹2.50/kWh with indexed escalation, only sites with low evacuation and competitive module supply sustain double-digit equity IRR at ₹4.5 crore/MW all-in. State tenders with higher clears tolerate slightly higher capex or lower yield.
MNRE policy announcements on grid connectivity and renewable purchase obligations shift offtake certainty but rarely change per-MW module pricing directly. Treat policy as schedule risk in installation budgeting, not as a line-item discount.
Key takeaways for developers and lenders
- Quote EPC per MW and total project capex separately; mixing them breaks comparability.
- Modules and inverters dominate; tracker choice is the next major swing item.
- SECI/state tariff clears set the ceiling; work backward with contingency.
- Evacuation and land can exceed EPC surprises if not surveyed early.
- Re-benchmark quarterly; module markets move faster than annual budgets.
Per-MW installation cost is a living number tied to auction clears and supply chains, not a brochure constant. Lock your bill of quantities before you lock tariff assumptions in the lender model.
Related resources
Frequently asked questions
Industry reports and recent SECI tender outcomes place fully loaded EPC capex for ground-mounted utility plants in roughly ₹3.8 crore to ₹5.5 crore per MW, depending on module technology, tracker share, transmission distance, and land terms. Greenfield projects with long evacuation and high module prices sit at the upper end; repeat developers with owned land and fixed-tilt designs often land lower.
Central and state auctions set tariff ceilings that indirectly cap total project cost because developers model IRR against discovered tariffs, module prices, and financing rates. When SECI tranches clear at lower ₹/kWh levels, EPC teams compress BOS, optimize DC/AC ratio, and negotiate module supply harder. MNRE policy shifts on ALMM, domestic content, and grid connectivity also move line items between years.
Solar modules and inverters typically account for 55–65% of direct EPC cost on modern builds. Trackers or mounting structures, cables, transformers, and substation equipment form the next block. Land lease prepayments, transmission line extensions, and development fees can add 10–20% beyond bare EPC depending on site.
Yes. Single-axis trackers add roughly ₹30–60 lakh per MW over comparable fixed-tilt structures in current Indian supply chains, plus higher foundation and motorization O&M reserves. Developers accept the premium when energy yield models and PPA tariffs justify the incremental generation, especially in high-GHI regions.
Experienced developers hold 5–8% EPC contingency for grid delay, soil surprises, and module delivery slippage, plus separate schedule risk for evacuation approvals. Financing models should stress-test module price volatility and rupee import costs because utility margins are thin at sub-₹3/kWh tariffs in competitive auctions.