India's utility solar build-out has moved past the question of whether solar scales. The question for asset owners in 2026 is whether operations, cleaning, and performance ratio keep pace with commissioning curves in Rajasthan, Gujarat, and central India dust belts where most new GW lands.
National capacity headlines matter less to plant managers than aggregate soiling risk: every new 100 MW without cleaning scale adds more dirty module area per dust event. This article translates growth into O&M budgets, EPC specs, and portfolio discipline.
Quick answer
- More GW online = more aggregate soiling risk unless cleaning scales per block.
- New plants should embed cleaning logistics at EPC (water, robots, tracker clearance).
- Thin PPAs make PR discipline and dust recovery a margin issue, not a nicety.
- Portfolio owners centralize SCADA + soiling KPIs as fleets grow.
- Use utility-scale O&M playbooks, not rooftop maintenance habits.
What growth means for plant managers
Commissioning teams hand off to O&M with models that assume periodic cleaning. In arid clusters, realized PR often trails those models within the first dry season if labour and water cannot cover block-level loss. The pattern is familiar on older 30 MW sites; it should not repeat on 2024–2026 greenfield if lessons are applied at design.
Rajasthan and Gujarat soiling ranges show why growth without cleaning scale is expensive. A national GW number does not wash modules.
Where new capacity concentrates operationally
| Cluster type | Operational pressure | Cleaning implication |
|---|---|---|
| Western arid (RJ, GJ) | High dust, water stress | Waterless robots, storm SLAs |
| Central interior (MP, MH) | Seasonal agri dust, monsoon mud | Flexible calendars, drainage design |
| Southern (KA, AP, TS) | Moderate dust, coastal salt at edges | Monitoring triggers, salt rinses |
| Hybrid merchant + PPA | Thin margin on merchant share | PR loss hits harder per MWh |
Lessons from large assets: India's largest solar plants.
Budget lines that should rise with fleet size
| Line item | Why it scales with GW | Illustrative note |
|---|---|---|
| Cleaning labour or robots | More module area per dust event | 50 MW may need ₹40–90 lakh/year manual wet |
| Water or waterless O&M | Tanker logistics cap wet throughput | Waterless shifts capex to O&M |
| SCADA + soiling analytics | Engineers cannot eyeball 100 MW | Central dashboards across states |
| Storm surge capacity | Pre-monsoon dust is portfolio-wide | 48–72 hour response targets |
| Comms for robot fleets | Coverage audits at scale | Mesh + gateway per block group |
Thin tariffs and the math of dust
As tariffs fell over the last decade, each lost MWh hurt more. Illustrative 50 MW plant at 90 GWh/year:
- 3% soiling drag ≈ 2.7 GWh lost.
- At ₹3.00/kWh ≈ ₹8.1 crore annual opportunity.
- At ₹2.50/kWh still ≈ ₹6.75 crore.
Cleaning spend that recovers even half that gap clears hurdle rates quickly. Robotic cleaning for maximum ROI frames the revenue-protection case.
How IPPs should plan cleaning on new capacity
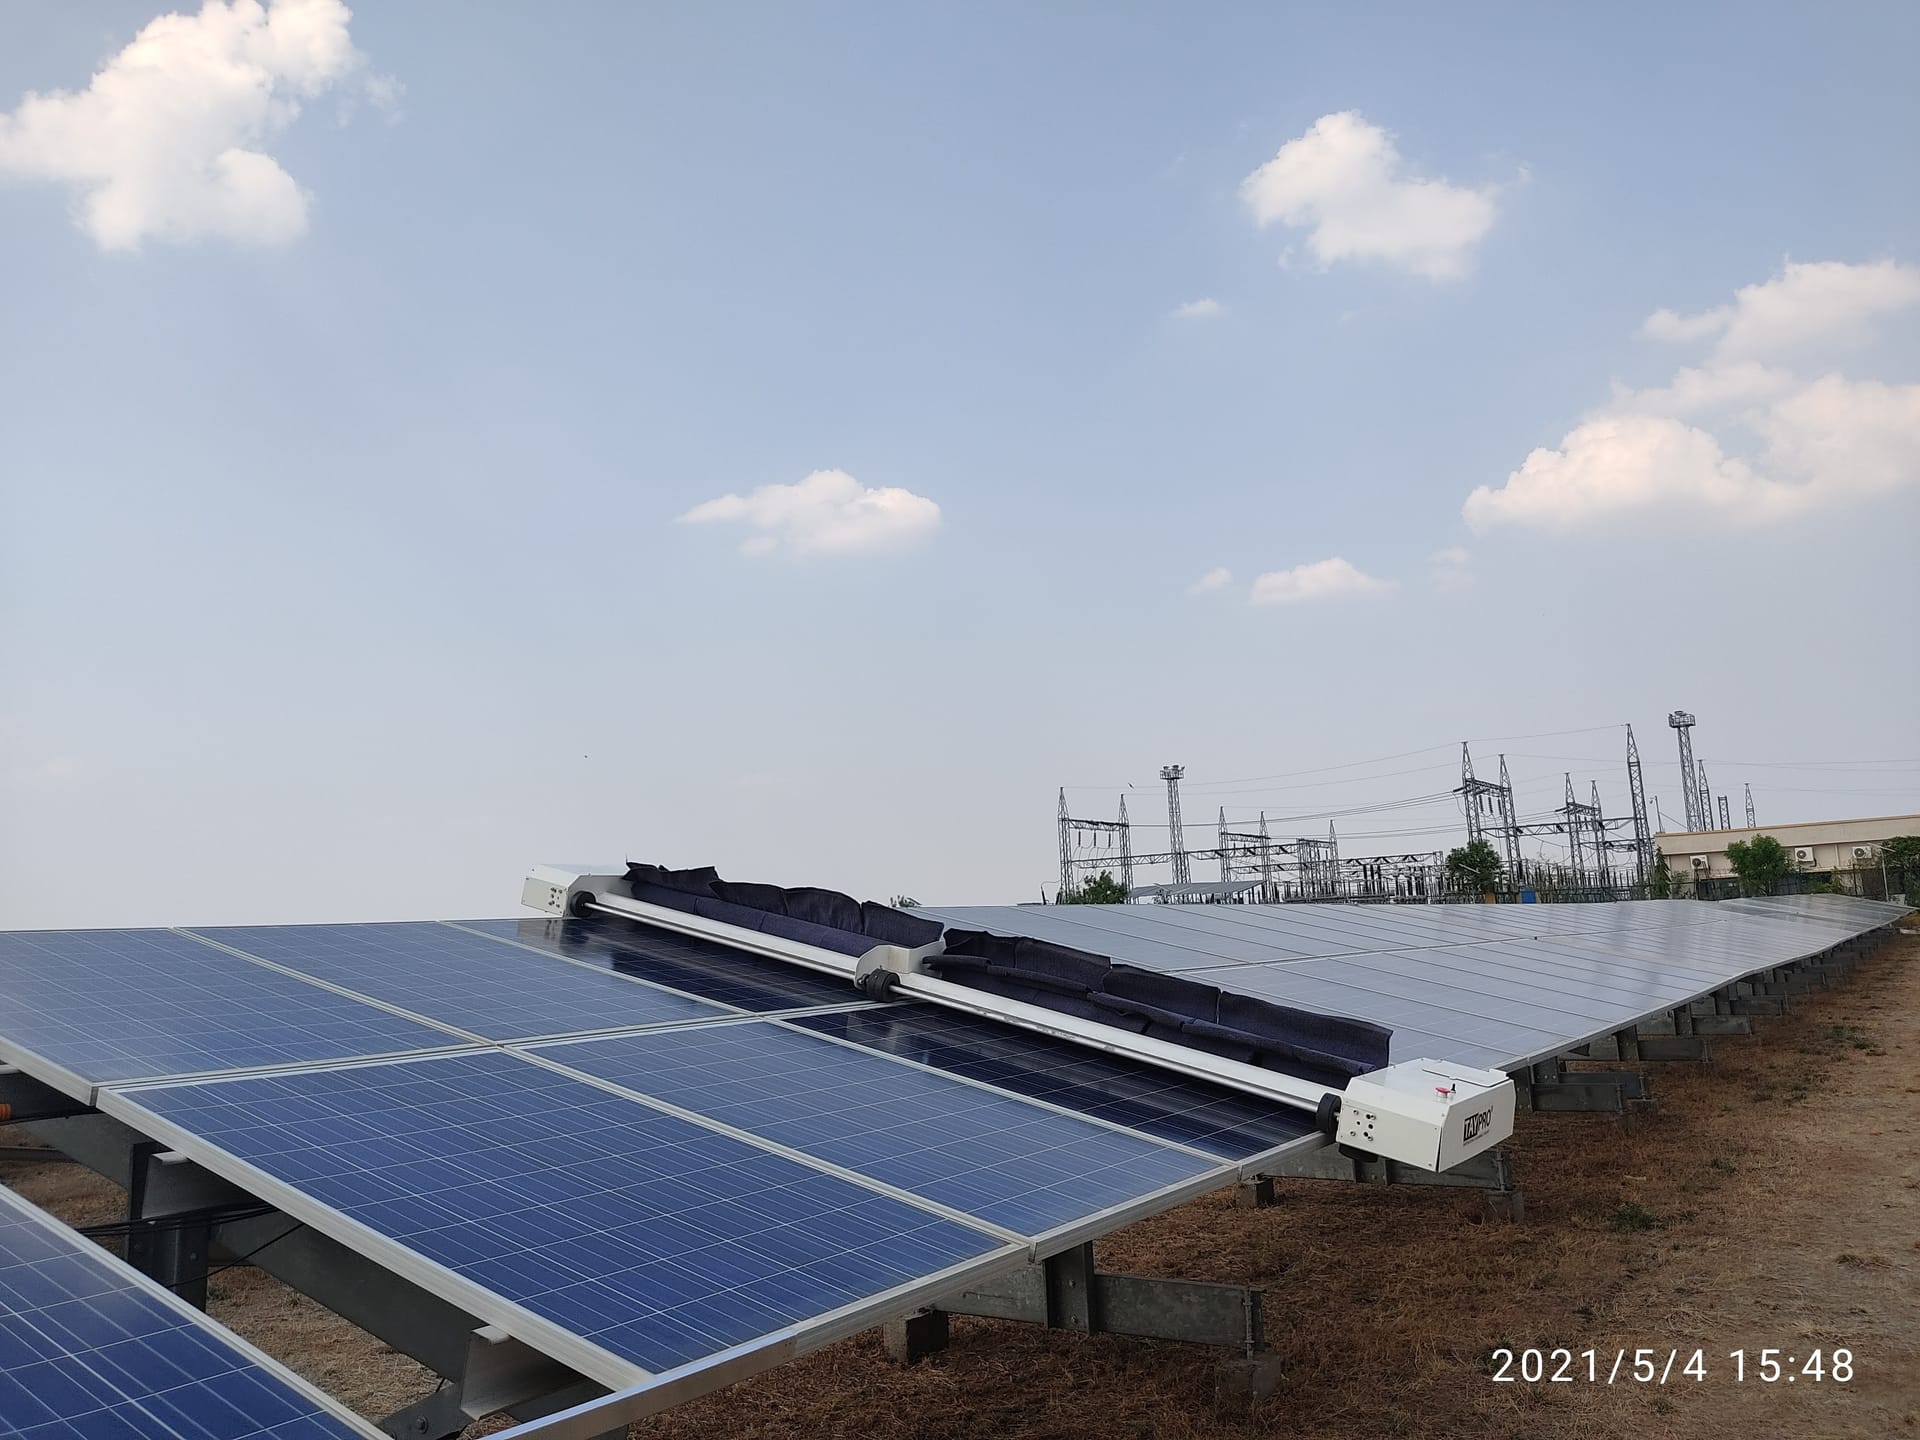
- Match method to site at 30% design: robotic vs manual, waterless vs wet.
- Pilot on tracker rows before fleet orders.
- Specify comms and pass logs in robot RFPs.
- Embed PR and soiling triggers in O&M contracts.
- Use ROI tools with site soiling, not brochure defaults.
Design detail: utility design and cleaning decisions.
Planet narrative vs plant ledger
Climate impact stories use national GW figures. Plant managers live in delivered MWh. Soiling on new capacity reduces avoided emissions exactly when India needs credible green output. ESG reporting connects soiling to environmental integrity for offtakers.
Growth is positive for decarbonization only if operations deliver modeled energy. Cleaning is part of that delivery chain.
Portfolio centralization checklist
- Standard PR and soiling definitions across states.
- Shared O&M vendor pool with safety and insurance vetted once.
- Monthly block PR ranking to prioritize cleans.
- Method change playbook (wet to waterless) with disclosure template.
- Annual review of cleaning frequency by region.
Transmission and commissioning timing
GW headlines hide bottlenecks: plants ready but awaiting evacuation, or blocks commissioned in phases with uneven cleaning coverage. Partial COD sites often clean only energized blocks while dust accumulates on adjacent ready tables. O&M should plan phased cleaning scope in commissioning schedules, not treat partial arrays as invisible until full COD.
Delayed evacuation also compresses early-year revenue when owners still pay O&M fixed costs. Cleaning spend during wait periods protects PR on energized blocks that are finally generating against thin early tariffs.
Workforce and contractor market pressure
National solar growth competes for the same skilled O&M labour pool. Manual cleaning crews that served 20 MW in 2019 cannot magically scale to 200 MW across three states without wage pressure and quality variance. Robotics and centralized vendor pools are partly responses to labour scarcity, not only dust physics.
IPP HR and O&M leads should model contractor availability for May surge before signing annual manual-only AMCs on new 100 MW assets. Costly cleaning mistakes often trace to understaffed surge weeks.
State policy and tender trends affecting O&M
SECI, state discoms, and merchant hybrids each impose different availability and reporting expectations. As tariffs compress, winners on new tenders often assume lean O&M headcount. If those models omit realistic cleaning cost in dust belts, winners face margin squeeze in year two when PR underperforms. Bid teams should import O&M cleaning quotes from operating sister plants in the same district, not generic ₹/MW allowances from spreadsheets.
Domestic content and module supply shifts can delay commissioning blocks, creating uneven soiling across phased arrays. Portfolio playbooks should standardize phased cleaning triggers so partial COD does not become partial cleanliness by neglect.
What operators learn from India's largest plants
Mega-project operators pioneered centralized control rooms, regional contractor pools, and storm playbooks now filtering down to 50–100 MW IPPs. Lessons transferable without mega budgets:
- Block-level PR ranking every Monday during dry season.
- Pre-positioned water or robot capacity before May, not ordered after first storm.
- Single O&M data standard across states for group reporting.
- Method pilots on new blocks before copying sister plant assumptions.
India's largest solar plants illustrate scale effects; mid-size owners adopt the discipline without the GW headline.
Merchant exposure and cleaning urgency
Plants with merchant tail or capture-price risk feel dust loss immediately in spot or short-term market prices. When merchant share rises in portfolios, O&M should tighten cleaning triggers because uncaptured peak hours during dirty modules hurt more than under long-term PPA averages. Model merchant blocks separately in soiling reviews.
Why modern farms need autonomous cleaning connects automation to merchant and PPA blended economics.
Training the next generation of O&M leads
Rapid GW growth outpaces experienced plant manager supply. Group training programs should include soiling measurement, cleaning economics, and robot comms basics, not only inverter repair. Standard playbooks let new hires run Rajasthan sites without rediscovering May surge lessons each year.
Data centers and new load growth
Rising electricity demand from data centers and industrial load increases the value of each delivered solar MWh on the grid. Dust that robs output on existing fleets works against both climate goals and supply adequacy narratives policymakers cite when approving new solar parks.
Key takeaways
- Treat national solar growth as an O&M scaling problem.
- Specify cleaning at EPC; retrofit costs more and loses early MWh.
- Thin PPAs amplify dust loss; cleaning is margin defense.
- Centralize PR and soiling metrics across growing fleets.
- Delivered MWh, not commissioned MW, is the planet and investor scorecard.
National GW targets only matter when delivered MWh meets models. Embed cleaning scale-up in commissioning checklists for every new phase you energize.
Related reading
Frequently asked questions
India continues to commission multi-GW utility capacity each year across Rajasthan, Gujarat, Karnataka, Andhra Pradesh, and other states. Exact annual GW varies by tender pipelines and transmission readiness. The operational implication is a larger dusty fleet needing standardized O&M, not more one-off site habits.
Yes. More MW in high-dust belts means more cumulative soiling loss unless cleaning capacity scales with commissioning. Late O&M design on new plants repeats manual-labour bottlenecks seen on older 30–50 MW sites now evaluating robots.
Water access or waterless robot paths, tracker-compatible cleaning routes, reference soiling measurement, internal roads for tankers or docks, and O&M budgets tied to PR triggers, not a generic quarterly wash note in the EPC manual.
Lower ₹/kWh raises the cost of every lost MWh from dust. At ₹2.80/kWh, 3% soiling on 50 MW is roughly ₹4 crore foregone annually. Cleaning and robotics are revenue-protection tools when PPAs are thin-margin.
Yes, once fleets exceed a few hundred MW across states. Central SCADA, soiling KPIs, method standards, and vendor pools beat letting each site reinvent manual calendars that fail at scale.