Cleaning robot benefits on Indian utility plants are operational and financial, not cosmetic. When May dust storms chalk modules across 40 MW before manual crews finish mobilizing, the question is whether a waterless fleet can restore performance ratio faster, with less water, and with auditable coverage. Marketing lists features; plant managers need MWh, ₹, and litres.
Robots are not automatic winners. Bad row geometry, poor fleet uptime, or skipped night wind interlocks erase the case. This article separates real benefits owners measure in Rajasthan and Gujarat from prerequisites that must be true first, with illustrative economics for 10–50 MW sites.
Quick answer
- Throughput: more passes per dry season without scaling headcount linearly.
- Waterless option: near-zero litres on approved systems in arid states.
- Night windows: clean stowed trackers without daytime MWh loss.
- Data: pass logs for O&M, lenders, and storm recovery audits.
- Labour shift: redeploy crews to electrical and vegetation priorities.
Throughput when dust outruns manual cycles
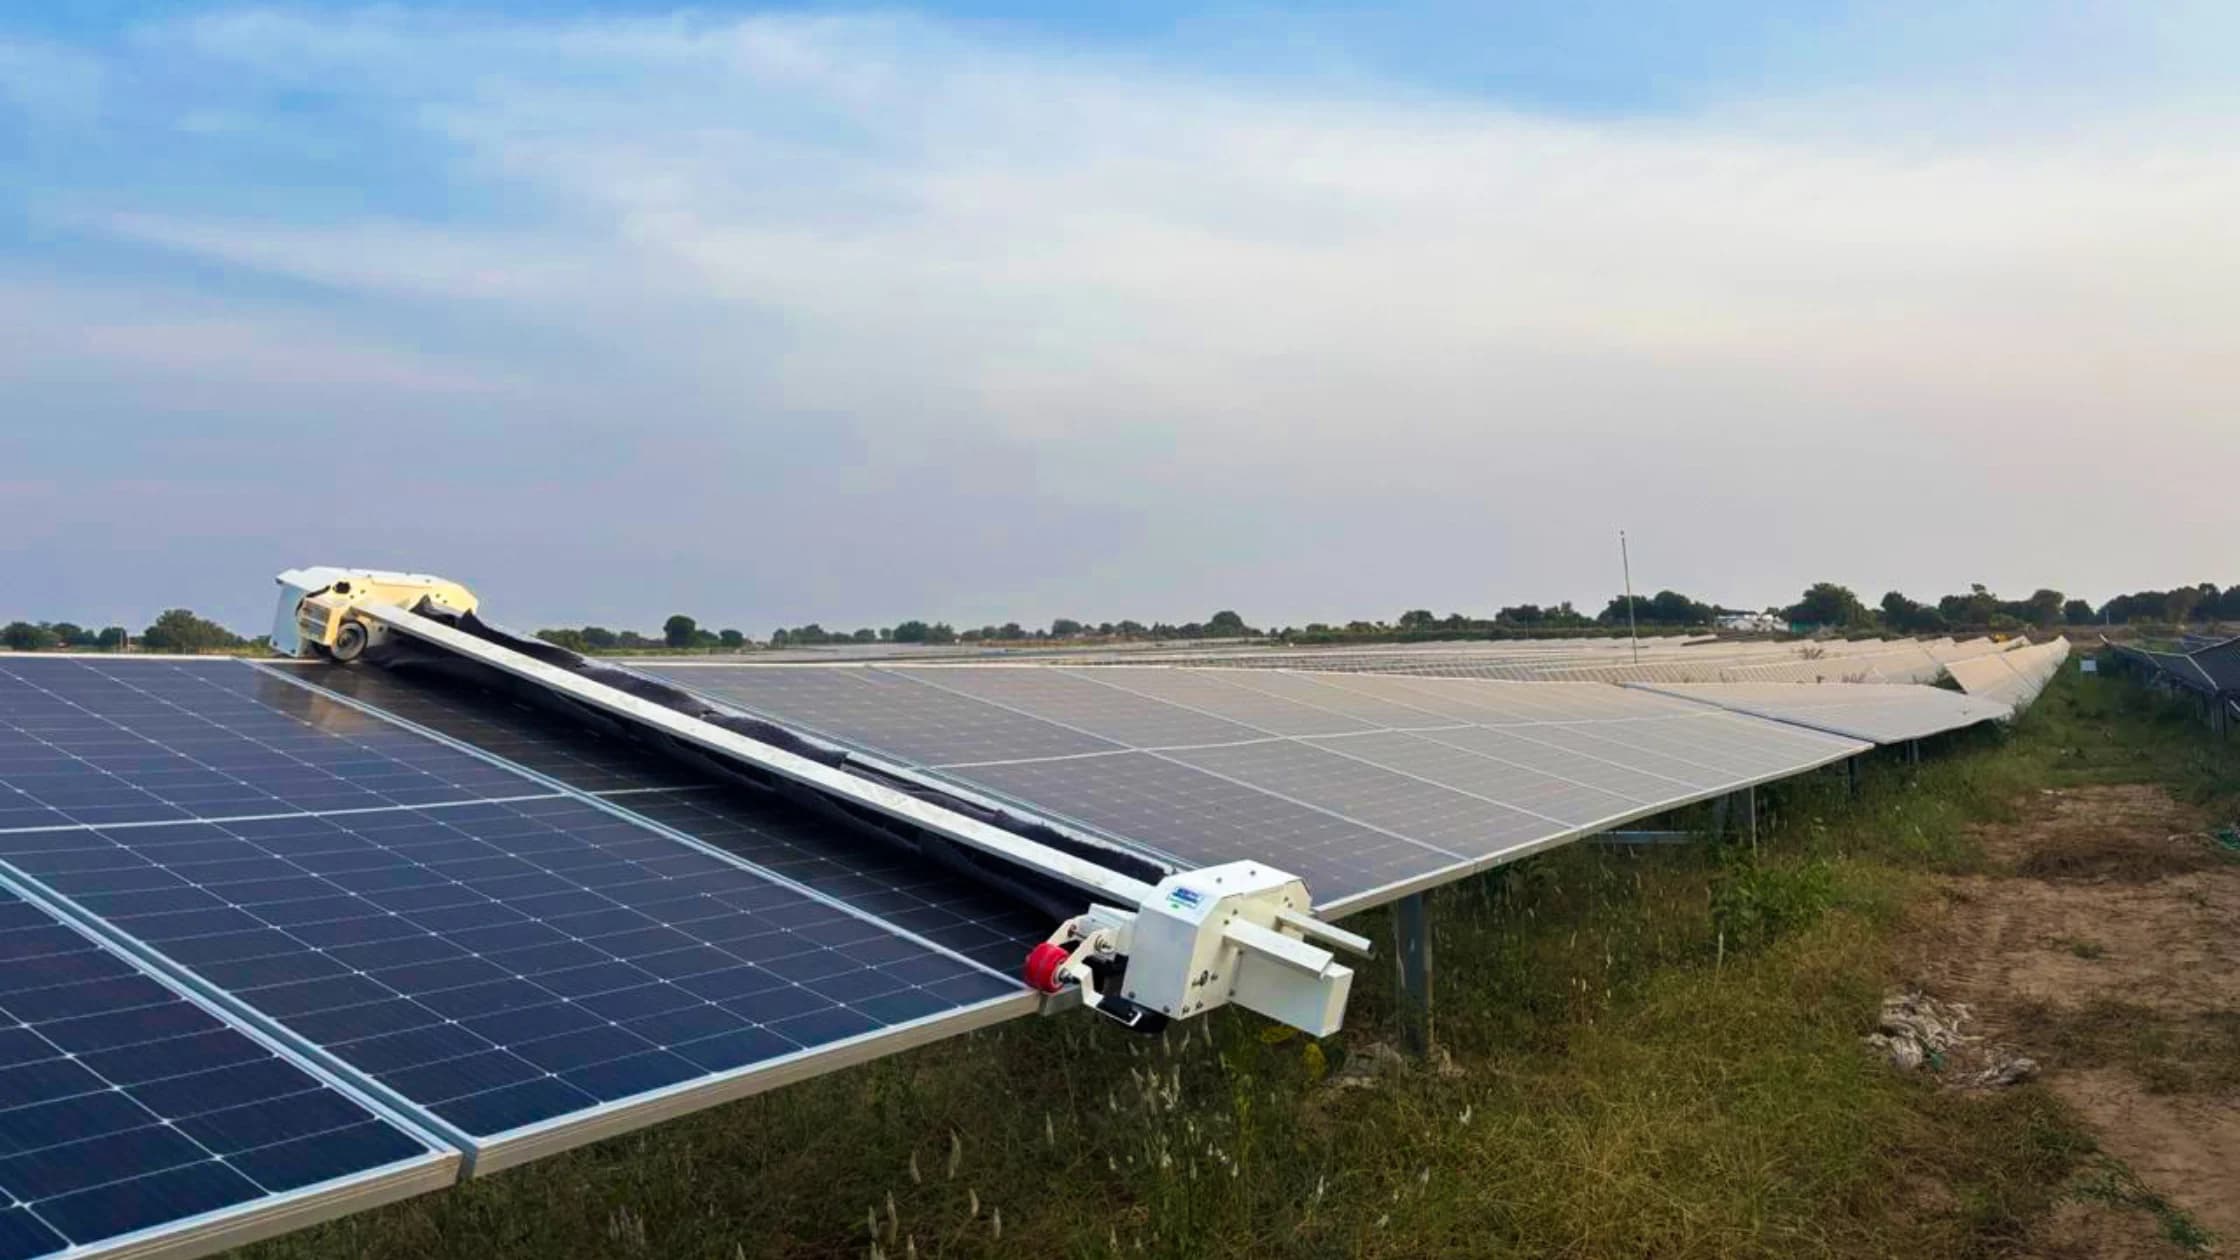
Manual wet programs on 50 MW sites often need seven to fourteen days for full-plant passes once tankers, labour, and safety permits align. Dust redeposits on untouched blocks while crews work zone by zone. Robots scheduled nightly on compatible rows can maintain higher average PR by shrinking the time dirty modules wait.
Benefit magnitude depends on prior baseline. If manual programs already cycle every four days with low water cost, robot advantage narrows to water and documentation unless scale grows further.
Water savings in stressed districts
Wet manual cleaning can consume thousands of litres per MW per pass. Borewell depth, tanker rates, and discharge rules tightened since commissioning make water a real O&M line. Approved waterless robots cut withdrawal dramatically, which matters for ESG questionnaires and social license near water-stressed villages.
Compare waterless vs water-based cleaning and read traditional vs waterless robots for five-year loaded cost framing.
Benefits vs prerequisites (honest matrix)
| Benefit | What must be true | Typical failure mode |
|---|---|---|
| PR gain | Row fit, 85–90%+ uptime, coverage logs | Aborted nights after storms |
| Water savings | Waterless-approved system vs wet baseline | Hybrid wet add-ons not budgeted |
| Labour savings | High prior manual spend at scale | Keeping full manual crew plus robots |
| Night cleaning value | Tracker stow OEM clearance | Wind holds every third night |
Night operation and generation protection
Daytime manual cleaning on live rows can shade strings or force operational awkwardness during peak irradiance. Robots on trackers often run when modules are stowed, avoiding conflict with generation hours. Benefit is both recovered PR from cleaner glass and avoided daytime downtime on strict off-taker schedules.
Wind rules are non-negotiable: autonomy does not mean ignoring tracker OEM stow limits. Operators who override interlocks trade short-term coverage for warranty and safety risk.
Data and audit benefits separate from MWh
Fleet software logs which rows completed, when, and whether passes aborted. Asset managers use this in monthly PR reviews and lender packs when off-takers question soiling assumptions. Manual campaigns with paper sign-off struggle to produce the same granularity at 100 MW scale.
Integrate logs with automated monitoring beyond cleaning where platforms support soiling analytics.
Illustrative 25 MW comparison (dry season, west India)
| Metric | Manual wet (weekly intent) | Waterless robot fleet |
|---|---|---|
| Annual cleaning O&M (loaded) | ₹65–95 lakh | ₹85–130 lakh |
| Water cost | ₹18–35 lakh | Near zero |
| Avg. dry-season PR vs baseline | −3% to −5% | −1% to −2.5% |
| Illustrative recovered MWh value | Baseline | +₹25–45 lakh vs manual at ₹3.50/kWh |
Illustrative only. Pilot and use ROI calculator with your soiling curve.
Safety and workforce benefits
Summer field temps above 42°C in Rajasthan make long manual row hours a health risk. Robots remove routine dust exposure hours; retained manual capacity focuses on tasks machines handle poorly: edge mud, broken glass zones, and vegetation. O&M morale improves when crews are not in permanent emergency clean mode every May.
When robots are the wrong tool
Small fixed-tilt sites under 5 MW with mild soiling and cheap water may not clear robot capex. Rows with chronic obstacles, legacy construction debris, or non-approved module types should not force fleet deployment. Hybrid models, robots on cleanable blocks and manual on legacy zones, are common on expanding sites.
Insurance underwriters on large Indian solar assets increasingly ask about robotic operations on live plants. Document night work SOPs, operator certification, and fire mitigation near charging stations to avoid coverage disputes after incidents.
Robot benefits compound when integrated with predictive soiling workflows. Fleet schedules tied to dust forecasts and reference module trends reduce both over-cleaning on mild weeks and under-cleaning before tariff-heavy summer peaks. Operators in Rajasthan using twice-weekly night passes before June often report tighter PR variance bands than reactive manual peers.
Software that logs pass completion against PR recovery by zone helps asset teams retire underperforming routes and focus manual backup where geometry demands it. Data is part of the benefit case, not an optional extra.
Scaling from pilot fleet to full-plant coverage
Pilot fleets of two to four units rarely cover 50 MW alone. Rollout planning must model robots per MW, shift overlap, and charging swap time to hit weekly coverage targets. Under-fleeting is a common ROI killer: owners buy minimum units, then blame robots when manual backup still runs constantly.
Vendor fleet sizing tools should use your measured minutes per row and target passes per week, not generic MW-per-robot marketing ratios. Revisit fleet size after first month of pass logs.
Environmental and community-facing benefits
Large solar parks in water-stressed districts face village and panchayat questions on borewell use. Waterless robotic programs reduce visible tanker traffic and withdrawal volumes, supporting community relations separate from investor ROI. ESG reports can cite litres avoided per MWh generated when methods are logged.
Dust suppression on internal roads complements robot benefits: less road dust means slower re-soiling on upwind modules. Holistic site maintenance amplifies robot pass effectiveness without extra brush time.
Competitive advantage in PPA and tender environments
Developers bidding new utility projects increasingly model soiling and cleaning O&M explicitly. Operators who already run proven robot fleets bring operational credibility to lenders during construction finance. Documented PR stability from sister sites strengthens base-case generation assumptions.
For operational assets, sustained PR near model supports refinancing conversations and reduces technical advisor haircuts on performance forecasts. Benefits extend beyond annual O&M invoice comparison.
Do robots benefit a 10 MW plant or only 50 MW+?
Both can benefit when soiling is material and manual mobilization is slow relative to dust events. A 10 MW site with aggressive desert soiling and tanker dependency may justify a smaller fleet if geometry fits. Scale economics improve at 30–50 MW, but PR recovery per robot hour matters more than nameplate MW alone.
Long-term service agreements with robot OEMs that bundle brush replacements and firmware support reduce surprise opex spikes that erode ROI in years three to five. Budget those contracts alongside inverter AMC lines when presenting autonomy benefits to boards.
Key takeaways for plant managers
- Quantify benefits in MWh, ₹, water litres, and coverage percent.
- Pilot on dustiest blocks with PR proof before fleet orders.
- Keep manual capacity for exceptions and hybrid films.
- Demand pass logs integrated with monthly PR reviews.
- Revisit benefits case after first full dry season of uptime data.
Robot benefits compound when pass logs feed monthly asset packs. Treat coverage percentage as a KPI beside PR, not a nice-to-have report.
Related resources
Frequently asked questions
Higher feasible cleaning frequency, reduced water use on waterless systems, night operation that avoids daytime generation loss, pass logging for O&M and lender audit, and labour redeployment toward electrical and tracker work. Benefits appear on the meter only when row fit and fleet uptime are proven, not assumed from brochures.
Only when they clean more effectively or more frequently than the manual baseline they replace, with high row coverage. A robot fleet at 70% uptime on poorly surveyed rows may underperform disciplined manual crews on PR. Pilots on worst blocks are mandatory before portfolio claims.
They reduce person-hours on rows for routine dust removal, which lowers heat exposure and fall-risk hours in summer campaigns. Manual teams remain essential for repairs, vegetation, salt films requiring wet assist, and exceptions robots cannot handle.
Five-year fully loaded TCO including capex, O&M, comms, and downtime; MWh recovered at your PPA tariff; water litres saved versus wet manual; storm-season response time; and pilot PR data with coverage logs. Exclude sticker-price-only comparisons.
Timestamped pass logs demonstrate cleaning execution aligned with performance models. Waterless fleets support lower withdrawal narratives in stressed districts. Both are increasingly requested in technical advisor reviews separate from generation dashboards.