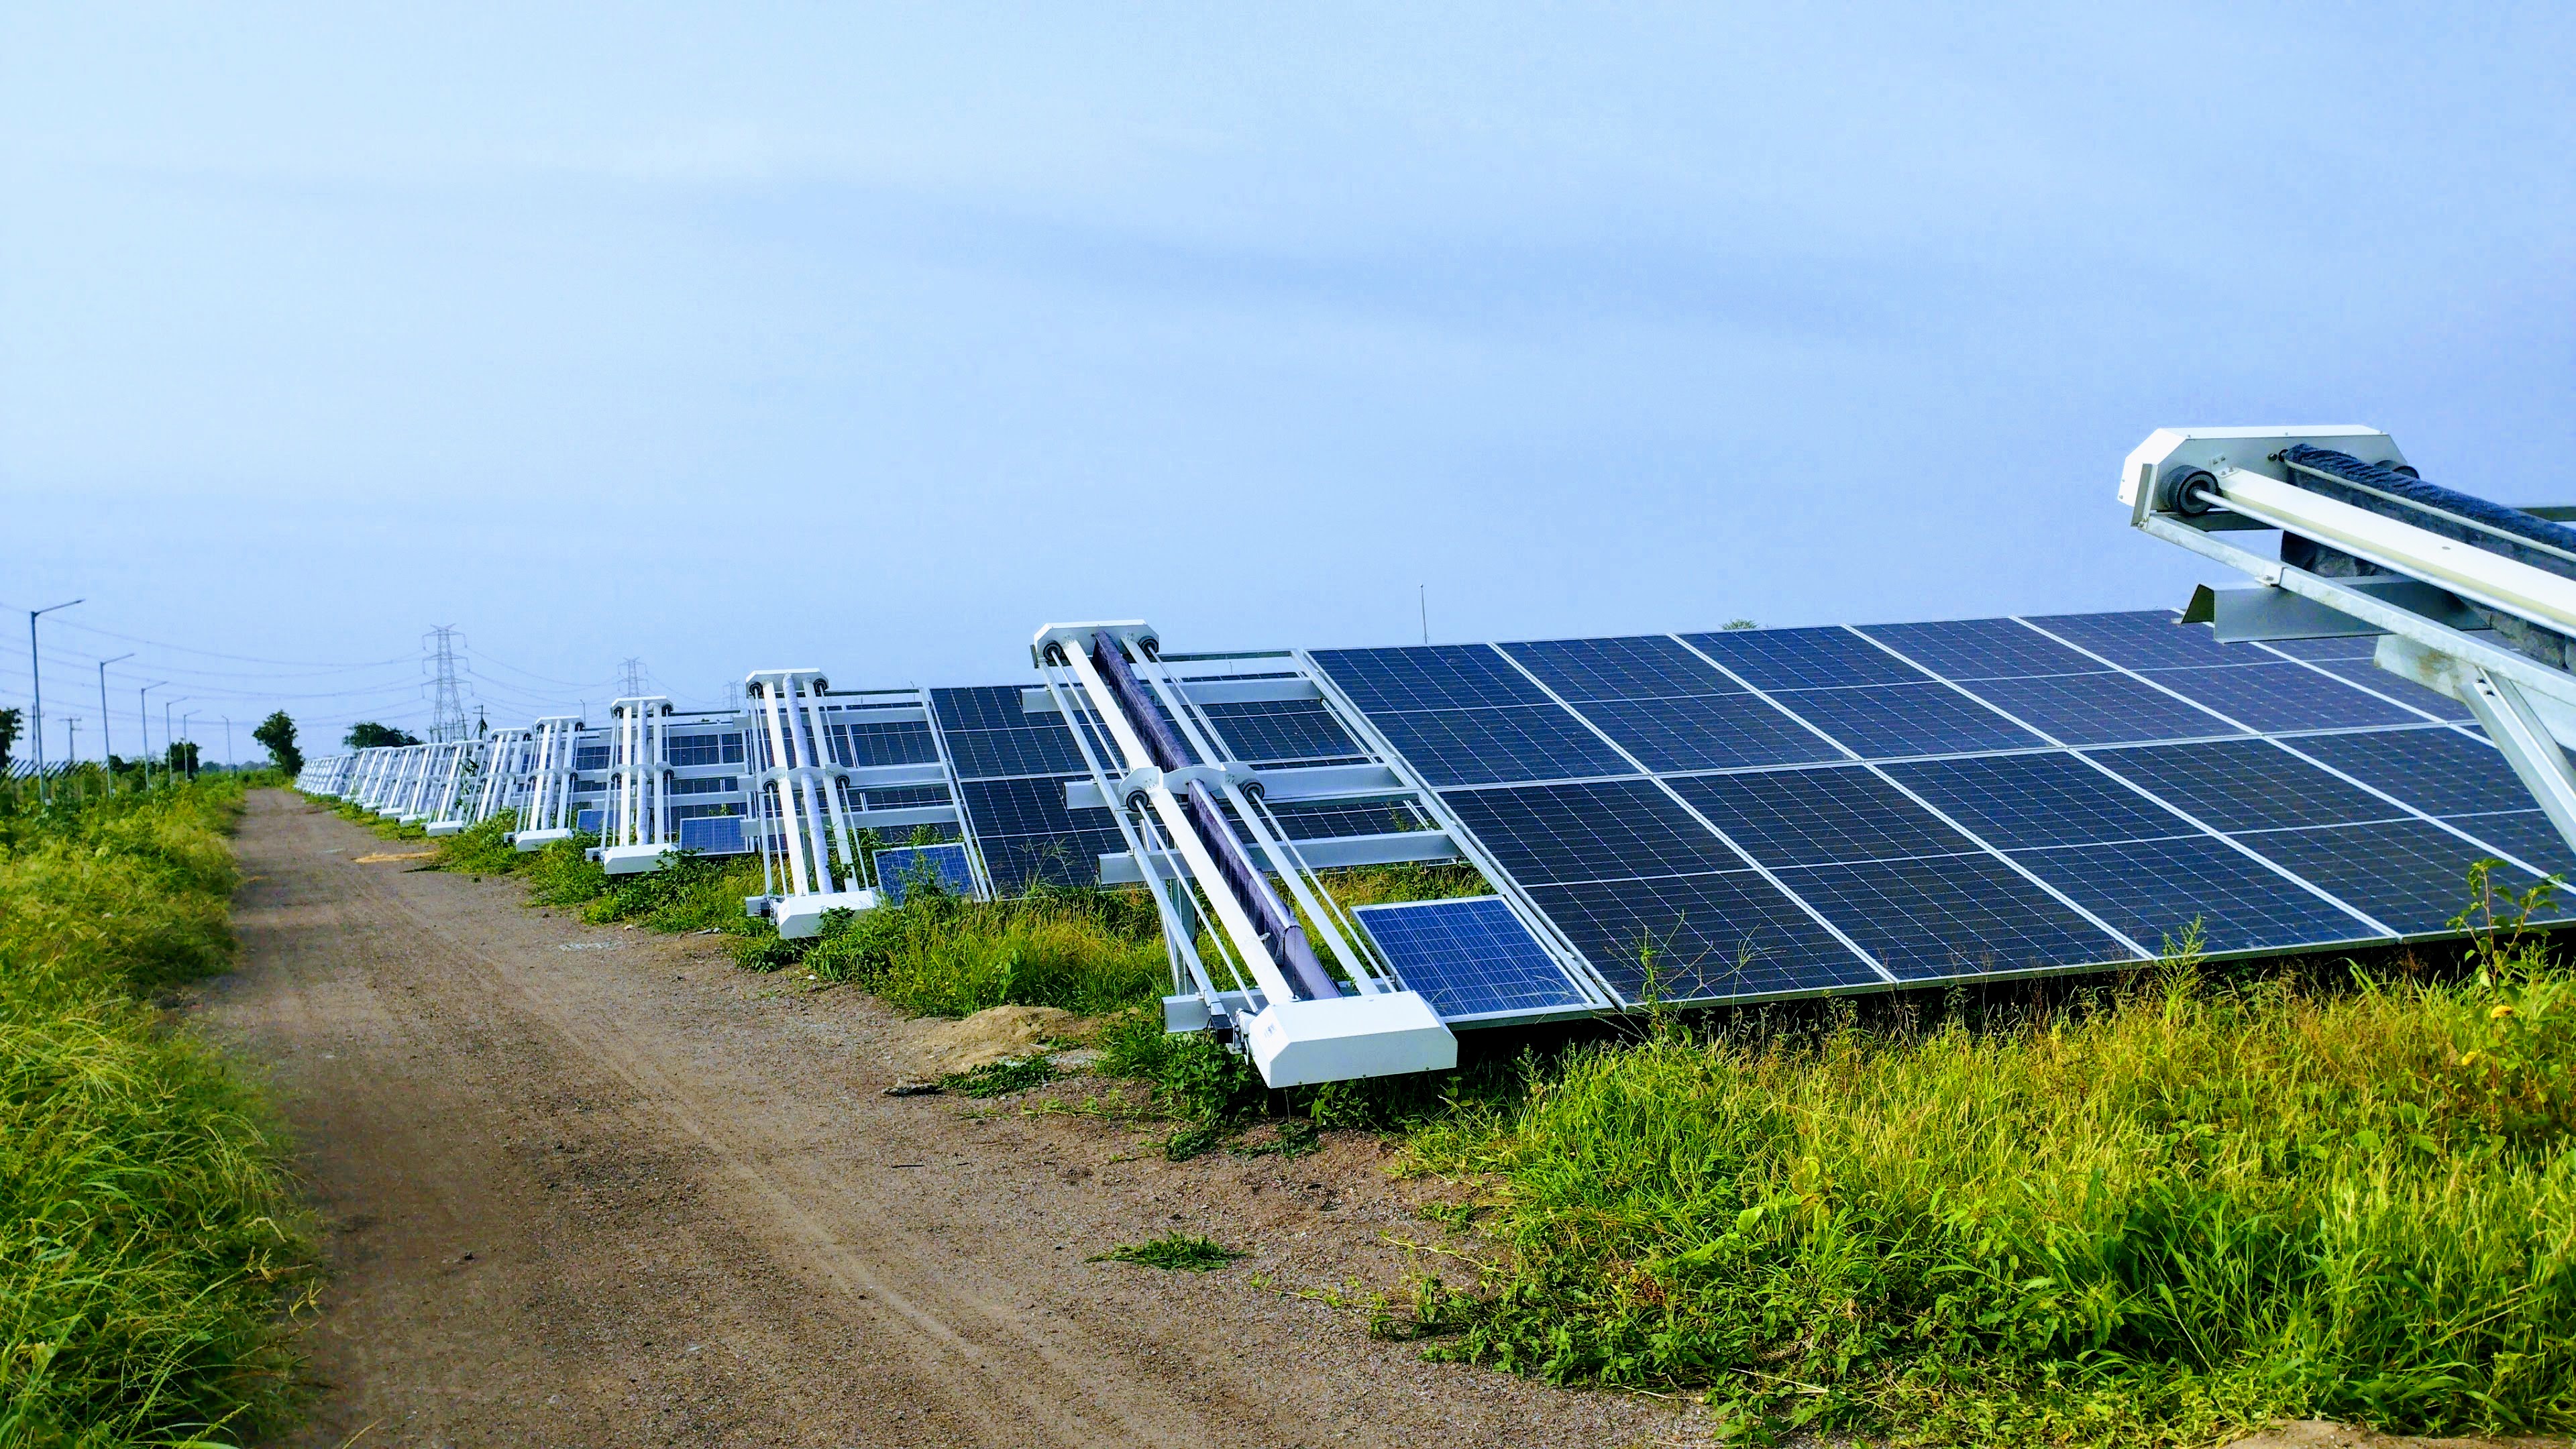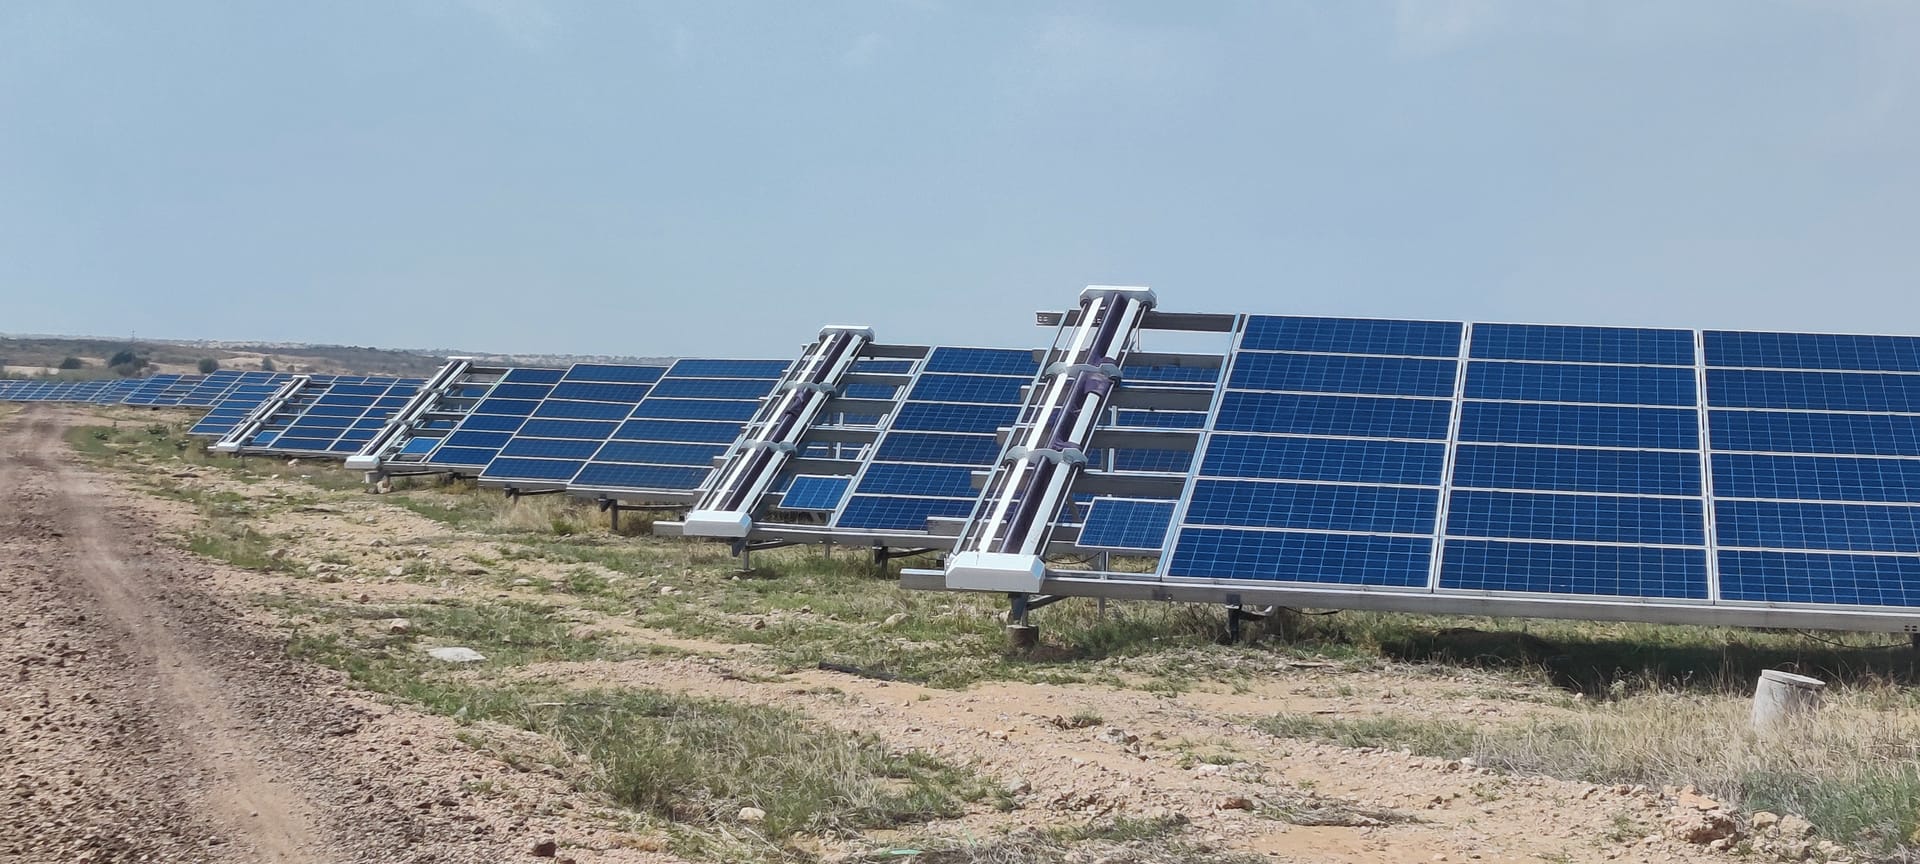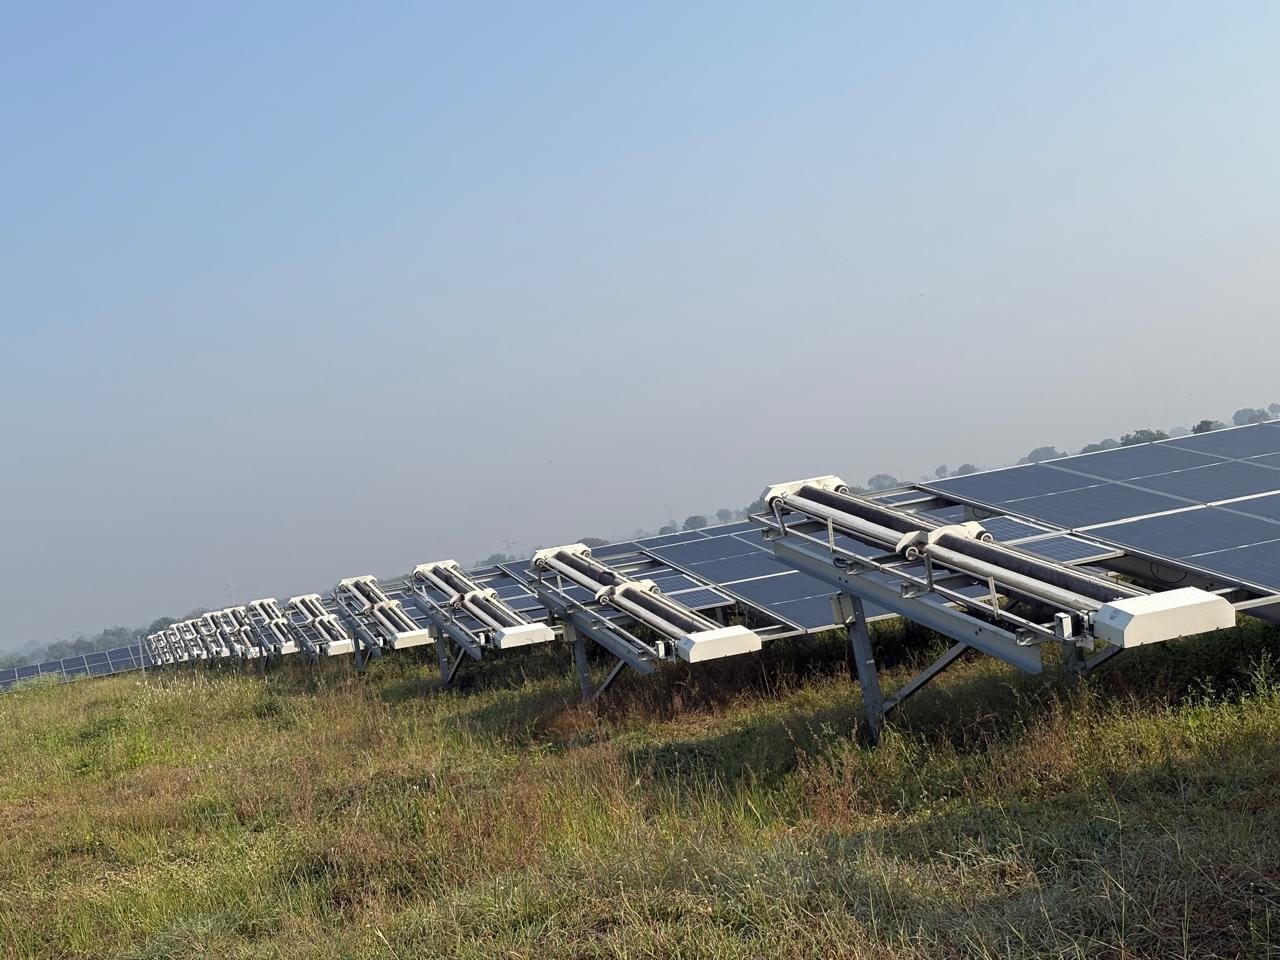
Mistakes on a residential rooftop are annoying. On a 50 MW PPA-backed asset they surface in lender reports, O&M penalty clauses, and board slides about unexplained PR drift. Indian utility sites repeat the same five cleaning errors because dust is visible but revenue loss is deferred until quarterly reviews.
This article names those mistakes, quantifies how they show up on MW balance sheets, and gives plant managers a corrective workflow tied to performance ratio discipline.
Quick answer
- Mistake 1: Calendar cleaning without soiling data or PR triggers.
- Mistake 2: Unapproved brushes, pressure, or chemistry on modules.
- Mistake 3: One cleaning method forced on both trackers and fixed tilt.
- Mistake 4: Ignoring water cost, availability, and discharge compliance.
- Mistake 5: No PR proof before and after cleaning campaigns.
Mistake 1: Calendar cleaning without soiling data
Monthly or fortnightly cleans look disciplined on paper. In practice, Indian seasons are uneven. A plant may over-clean during monsoon weeks when rain already rinsed loose dust, wasting ₹ lakhs in labour and water. The same plant under-cleans in May when three dust events hit between scheduled visits and PR sits 5% below baseline for weeks.
Fix: define economic cleaning triggers (reference PR drop, soiling sensor threshold, or post-storm protocol) in O&M contracts. See cleaning frequency guidance for India and weather-driven triggers.
Mistake 2: Unapproved abrasive tools and pressure methods
Contractors sometimes reuse worn brushes, aggressive nylon pads, or pressure washers aimed near frames and junction boxes to finish rows faster. Module OEMs publish approved cleaning regimes for a reason: glass coatings and encapsulant edges are sensitive to repeated abrasion.
Fix: specify approved tools in tender documents, inspect contractor kits, and retain cleaning logs with brush type and method. Robotic systems engineer pressure and speed but still require OEM sign-off. Read microfiber vs traditional brush guidance.
Mistake 3: One method for trackers and fixed tilt
EPC-era plans often assume uniform manual wet crews. Tracker rows stretch 80 to 120 meters, require stow coordination, and shadow neighbors when drive faults go unfixed. Cleaning easy fixed-tilt corners while tracker blocks lag creates a false sense of plant cleanliness.
Fix: split methods by block geometry. Evaluate tracker robots or specialized rigs where manual throughput fails. Coordinate mechanical PM with cleaning schedules per tracker maintenance guide.
Mistake 4: Ignoring water cost and regulatory context
Wet wash quotes look cheap until tanker miles, borewell depth, pumping energy, and discharge rules enter the model. Arid Rajasthan and Gujarat sites may spend ₹12 to 25 lakh annually on water-related lines for a 10 MW manual program while ESG packs question withdrawal volumes.
Fix: build five-year loaded models including water. Compare waterless vs water-based cleaning and cost-benefit analysis frameworks.
Mistake 5: No PR measurement after cleans
Without irradiance-normalized PR before and after campaigns, owners cannot prove vendor value, optimize frequency, or defend cleaning spend to finance teams. Invoices become the only metric, which rewards activity over MWh recovered.
Fix: adopt monthly PR discipline per PR calculation guide. Run 14-day pre and 7-day post windows around major cleans on reference blocks.
Cost impact summary table
| Mistake | Typical cost form | 10 MW illustrative order of magnitude |
|---|---|---|
| Under-cleaning in dust season | 3 to 8% MWh loss over weeks | ₹15 to 40 lakh per dry season |
| Over-cleaning in mild weeks | Water plus labour waste | ₹5 to 15 lakh/year avoidable |
| Module damage from wrong tools | Warranty claims, hotspots, rework | Case-specific; high tail risk |
| Tracker neglect | Shadow plus soiling compounding | ₹2 to 8 lakh/month if row offline |
| No PR proof | Wrong frequency decisions | Compounds all rows above |
Figures illustrative at ₹3.20 to 3.50/kWh PPA. Replace with site data.
Worked example: 10 MW plant, May dust season (illustrative)
Plant targets PR 81% clean baseline. Calendar fortnightly wet wash slips to 18-day cycles after two storms. Average PR drifts to 76% for three weeks before recovery clean. Lost energy roughly 120 to 200 MWh over the quarter versus trigger-based cleaning with 72-hour storm response.
At ₹3.50/kWh, that gap is roughly ₹4.2 to 7.0 lakh in one quarter on one 10 MW block, before counting extra tanker runs from panic mobilization. Trigger-based robot or crew surge often costs less than the loss it prevents when storms are frequent.
Corrective workflow plant managers can adopt
- Install or maintain reference soiling measurement per major block segment.
- Rewrite AMC scope with weather and PR triggers, not calendar-only language.
- Audit contractor tools against module OEM cleaning bulletins.
- Split cleaning plans for tracker vs fixed-tilt zones.
- Report cleaning spend alongside PR recovery delta monthly to asset management.
Supporting checklists: maintenance checklist 2025, cleaning best practices, method comparison overview.
Which mistake should a new O&M lead fix first?
Start with mistake five and one together: establish PR baselines and triggers. Without measurement, fixing brushes or water strategy is guesswork. Within 60 days you should know whether loss is soiling, tracking, or inverter availability, and whether current cleaning frequency matches your dust regime.
Hidden sixth mistake: cleaning as cost center, not revenue hedge
Finance teams sometimes cap O&M at fixed revenue percent without linking cleaning to MWh. When dust season arrives, budgets cannot surge and plants defer cleans until emergency spend at premium rates. Reframe cleaning as hedging PPA revenue with measurable ROI per pass.
Present monthly: cleaning spend, PR recovery MWh, implied rupees per MWh recovered, and do-nothing scenario comparison using cost-benefit models.
Regional mistake patterns in India
Rajasthan plants often under-clean tracker zones while over-wetting fixed-tilt blocks. Gujarat coastal sites skip salt schedules until PR drifts. Punjab sites miss post-harvest October windows. Customize triggers using weather playbooks, not portfolio template folklore.
Contract language that prevents recurring mistakes
AMC contracts should mandate approved tools list attachments, PR measurement cooperation, post-storm mobilization hours, and penalties only when tied to measurable coverage failures, not arbitrary date misses during unsafe wind. Robot contracts should specify minimum row completion percentage during dust season and module damage liability caps with insurance certificates.
Auditor and lender questions to prepare for
Expect questions on cleaning frequency justification, water withdrawal volumes, module warranty cleaning compliance, and correlation between clean dates and PR recovery. Maintaining a single O&M data room with PR charts, cleaning logs, and OEM bulletins prevents scramble before quarterly reviews.
Corrective workflow after a failed cleaning season
If PR ended the dry season more than 2 points below budget, run a structured post-mortem before renewing AMC contracts. Pull block-level PR for each cleaning week, overlay dust event dates from IMD or on-site logs, and mark blocks cleaned late or not at all. Interview shift engineers about abort reasons for robots or crew no-shows. Finance should see recovered MWh at tariff beside every invoice line.
Document three corrective actions with owners and dates: update triggers, retrain crews or operators, or pilot an alternate method on the worst block. Lenders notice when year-two O&M fixes year-one neglect; they also notice repeated excuses without ticket closure.
Key takeaways
- Measure before and after every major cleaning campaign.
- Match method, tools, and schedule to geometry, OEM rules, and seasonality.
- Treat cleaning as revenue protection, not cosmetic O&M.
- Build five-year models that include water and storm surge costs.
- Document methods for warranty and lender audits.
Run a quarterly cleaning audit against this mistake list before lender dry-season reviews. Most failures are process gaps, not missing equipment.
Related resources
Compare waterless robots, automatic and semi-automatic models, and managed OPEX on Taypro's solar panel cleaning system for utility plants.
Frequently asked questions
Cleaning on a fixed calendar without measuring soiling is the most common costly error. Plants either over-spend in mild weeks or under-clean through dust storms when PR bleeds for weeks. Trigger-based cleaning tied to reference PR or soiling sensors avoids both failure modes.
Yes. Unapproved abrasive tools, embedded grit in worn nylon brushes, or high-pressure jets near junction boxes create micro-scratching, hotspot risk, and warranty disputes. Always follow module OEM published cleaning methods and document what was used.
Manual methods that work on fixed-tilt tables may be unsafe, impractical, or uneconomically slow on single-axis rows. Plants then clean easy blocks while tracker zones stay dirty or shadowed from separate mechanical faults, hiding true PR loss sources.
Model water sourcing, tanker cost, and discharge rules before committing to wet-only programs in arid states. Where borewell depth or ESG reporting caps withdrawal, waterless robots or dry-approved methods may beat cheap-looking manual wet quotes on five-year math.
Without before-and-after PR measurement, owners cannot prove cleaning worked or optimize frequency. Illustratively, one unnecessary full-plant wet pass might cost ₹3 to 8 lakh while delivering negligible MWh gain, or needed cleans get deferred costing ₹10 to 25 lakh per dry season in lost energy.