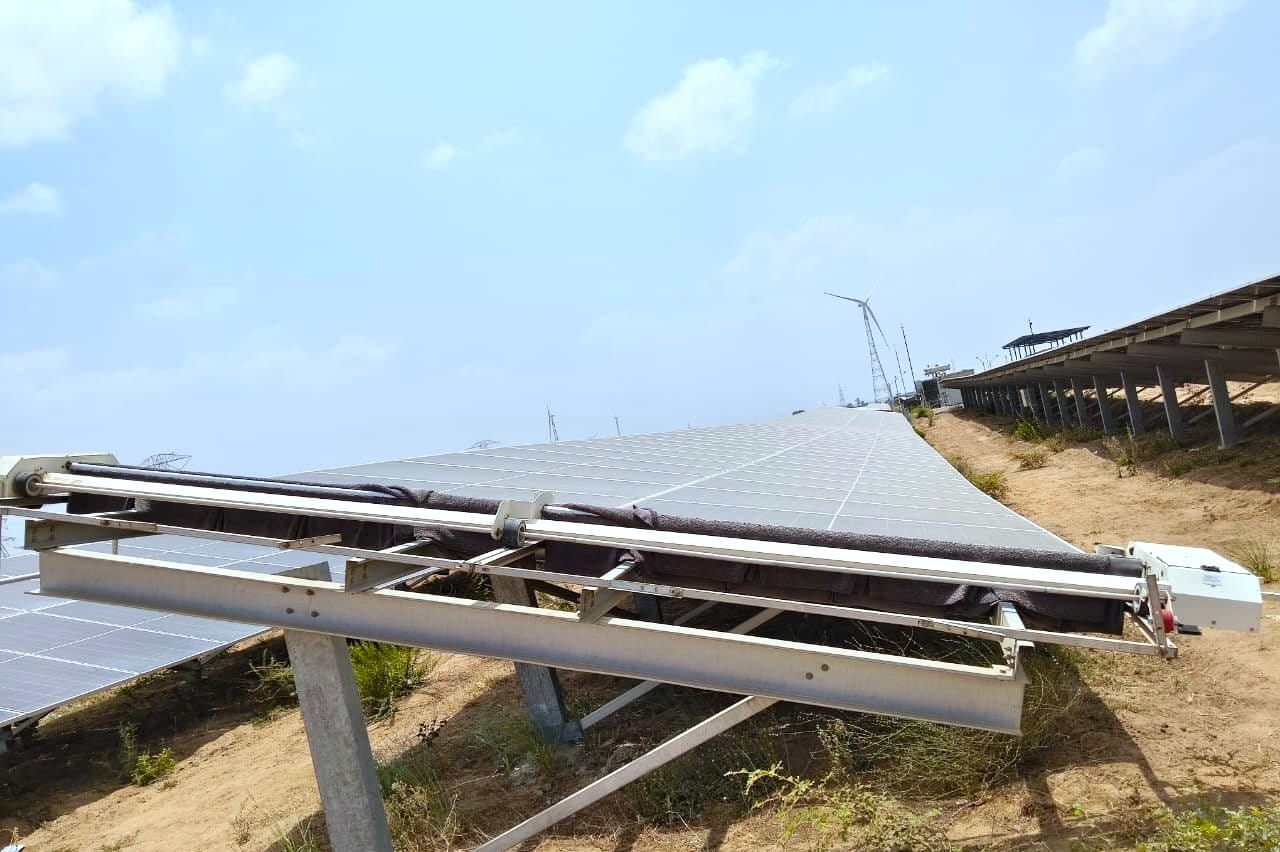
Plant managers hear "efficiency" from vendors and confuse it with performance ratio on the meter. Cleaning does not upgrade module technology or raise nameplate conversion efficiency. It restores irradiance reaching cells by removing dust, pollen, mud splash, and salt films from glass. On a 30 MW Gujarat site, that distinction is the difference between a defensible O&M line item and a marketing slide finance will challenge.
Indian utility assets in dust belts routinely see PR depression from soiling, not from cells wearing out in year three. This article explains the physics in operator language, typical recovery ranges after cleans, how long gains last, and how to prove impact to asset management with data, not anecdotes.
Quick answer
- Dust blocks light, so PR and MWh fall even when inverters are healthy.
- Clean glass lets irradiance through, so PR rebounds toward your clean baseline.
- Gain is roughly the soiling loss removed, site and storm specific.
- Speak to finance in PR and recovered MWh, not cell efficiency percent.
- Recovery fades as dust returns; frequency determines average annual benefit.
Efficiency vs performance ratio: definitions that matter
Module efficiency is a manufacturing spec: what fraction of incident sunlight a new cell converts under standard test conditions. Performance ratio is operational: actual AC output versus theoretical output adjusted for real irradiance and temperature on your plant. Soiling lowers PR by reducing effective irradiance on dirty modules while siblings stay clean.
When a vendor says cleaning "increases efficiency by 20%," they often mean relative output rose on a dirty string, not that cells improved. Utility reporting should use PR from SCADA or reference modules. Read solar panel efficiency vs operational performance for definitional clarity.
How dust reduces output before you clean
Mineral dust scatters and absorbs light. Cemented films after dew cycles act like partial shading at the glass layer. Agricultural drift and pollen create sticky layers that rain only partially rinses. Coastal sites add salt creep. Each mechanism reduces transmission without changing the cell beneath.
On long single-axis rows in Rajasthan, leading edges soil faster than leeward modules. Average block PR can hide 8% spread between dirty and cleaner strings. Cleaning targets the transmission bottleneck, which is why reference modules on worst blocks prove impact best.
Typical recovery ranges after cleaning (illustrative)
| Soiling state (pre-clean) | Typical immediate PR recovery | Notes for Indian utility sites |
|---|---|---|
| Light uniform dust | 2–4% PR | Common between scheduled passes in dry season |
| Moderate post-storm cover | 4–8% PR | Typical May–June western India events |
| Heavy cemented film | 8–15% PR on worst blocks | May need wet assist per OEM; verify no damage |
| Mostly clean already | <1% PR | Cleaning ROI weak; measure before mobilizing |
These are industry-typical ranges for planning, not guarantees. Pilot on your dirtiest reference block.
Worked example: 10 MW block, ₹3.50/kWh PPA
Assume annual specific yield near 1,600 kWh/kWp at clean baseline. A sustained 5% PR loss from soiling costs roughly 800 MWh per year on 10 MW, about ₹28 lakh in revenue. A cleaning program that recovers 3.5 average PR points for ₹12–18 lakh fully loaded may clear hurdle rates even before water savings on wet alternatives.
If soiling only depresses PR 1%, recovered MWh may not cover mobilization. That is why measurement precedes method, detailed further in cost-benefit analysis for Indian plants.
Why recovery is not permanent
Dust redeposits from wind, traffic on internal roads, agricultural activity, and seasonal storms. In Jaisalmer fringe sites, modules can return to measurable soiling within 72–96 hours after a major event. Average annual benefit equals the area under the PR curve you maintain between passes, not the peak right after wash.
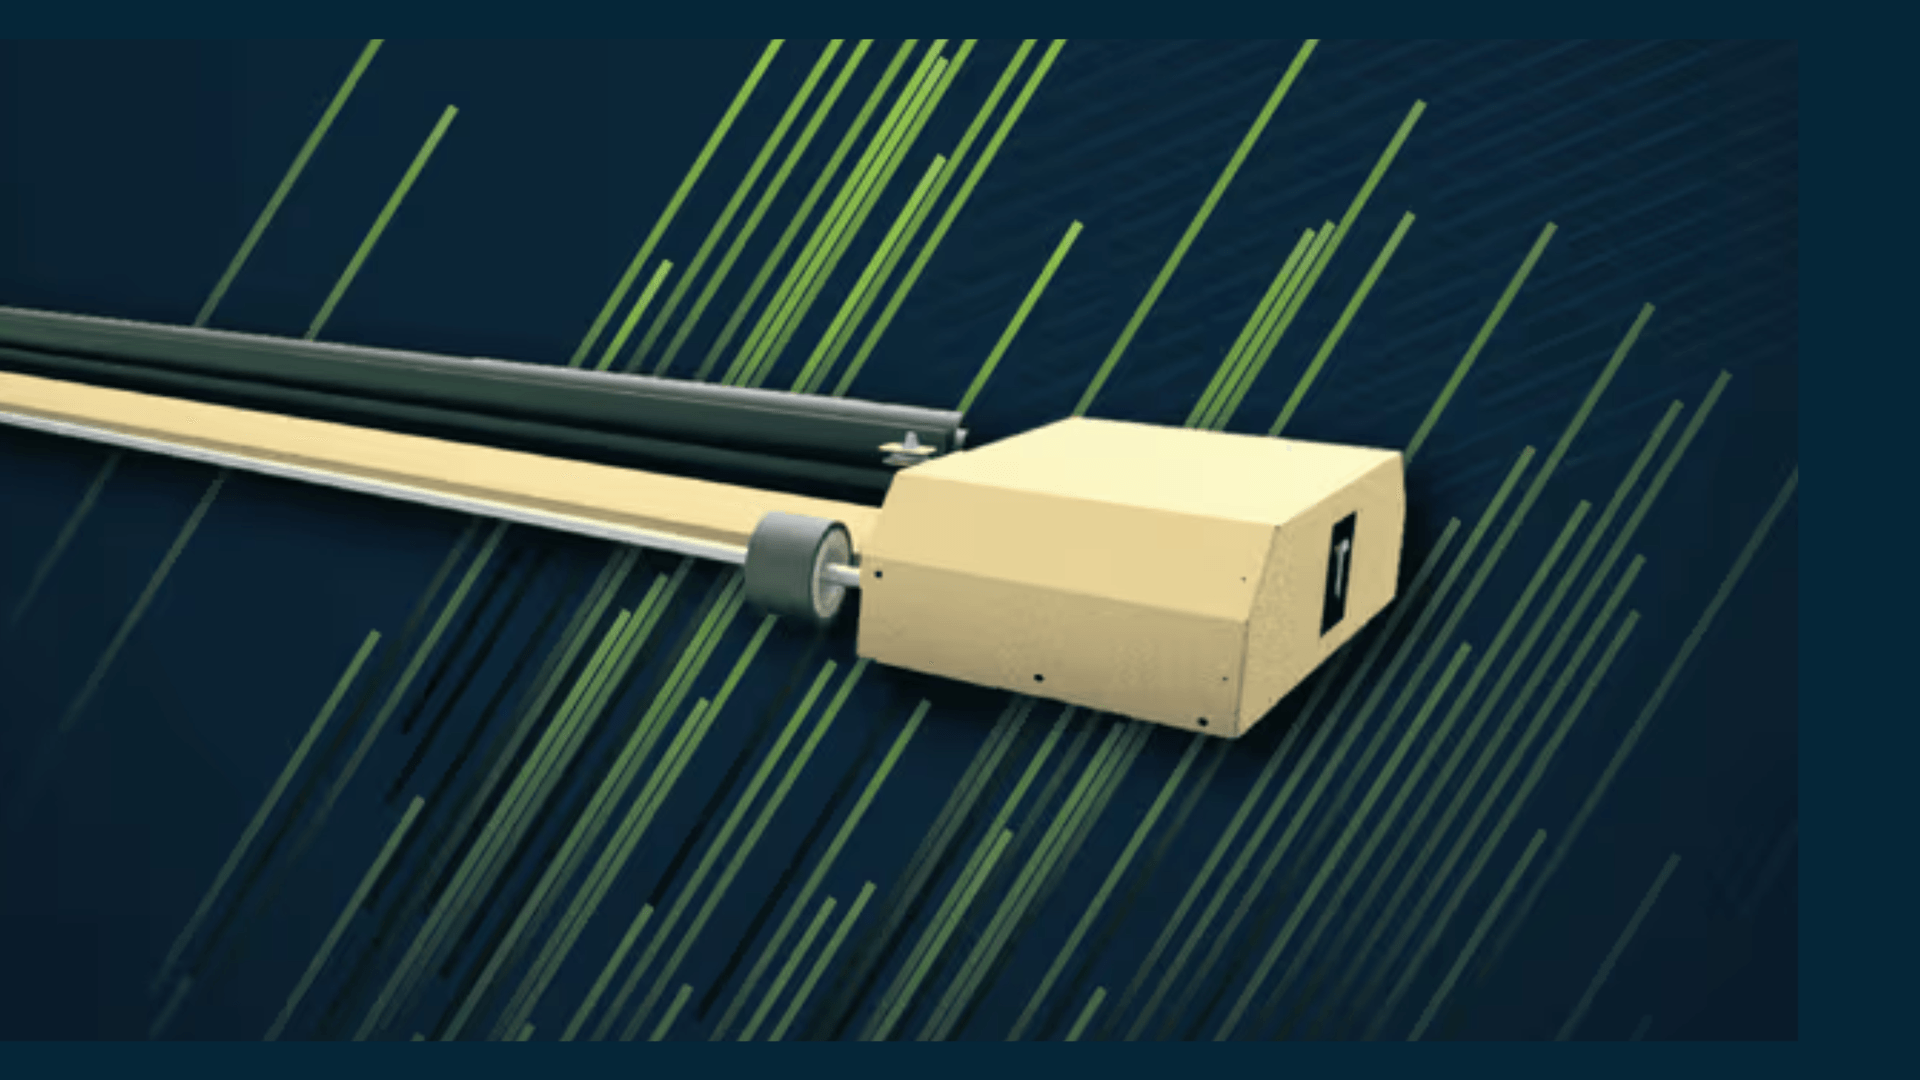
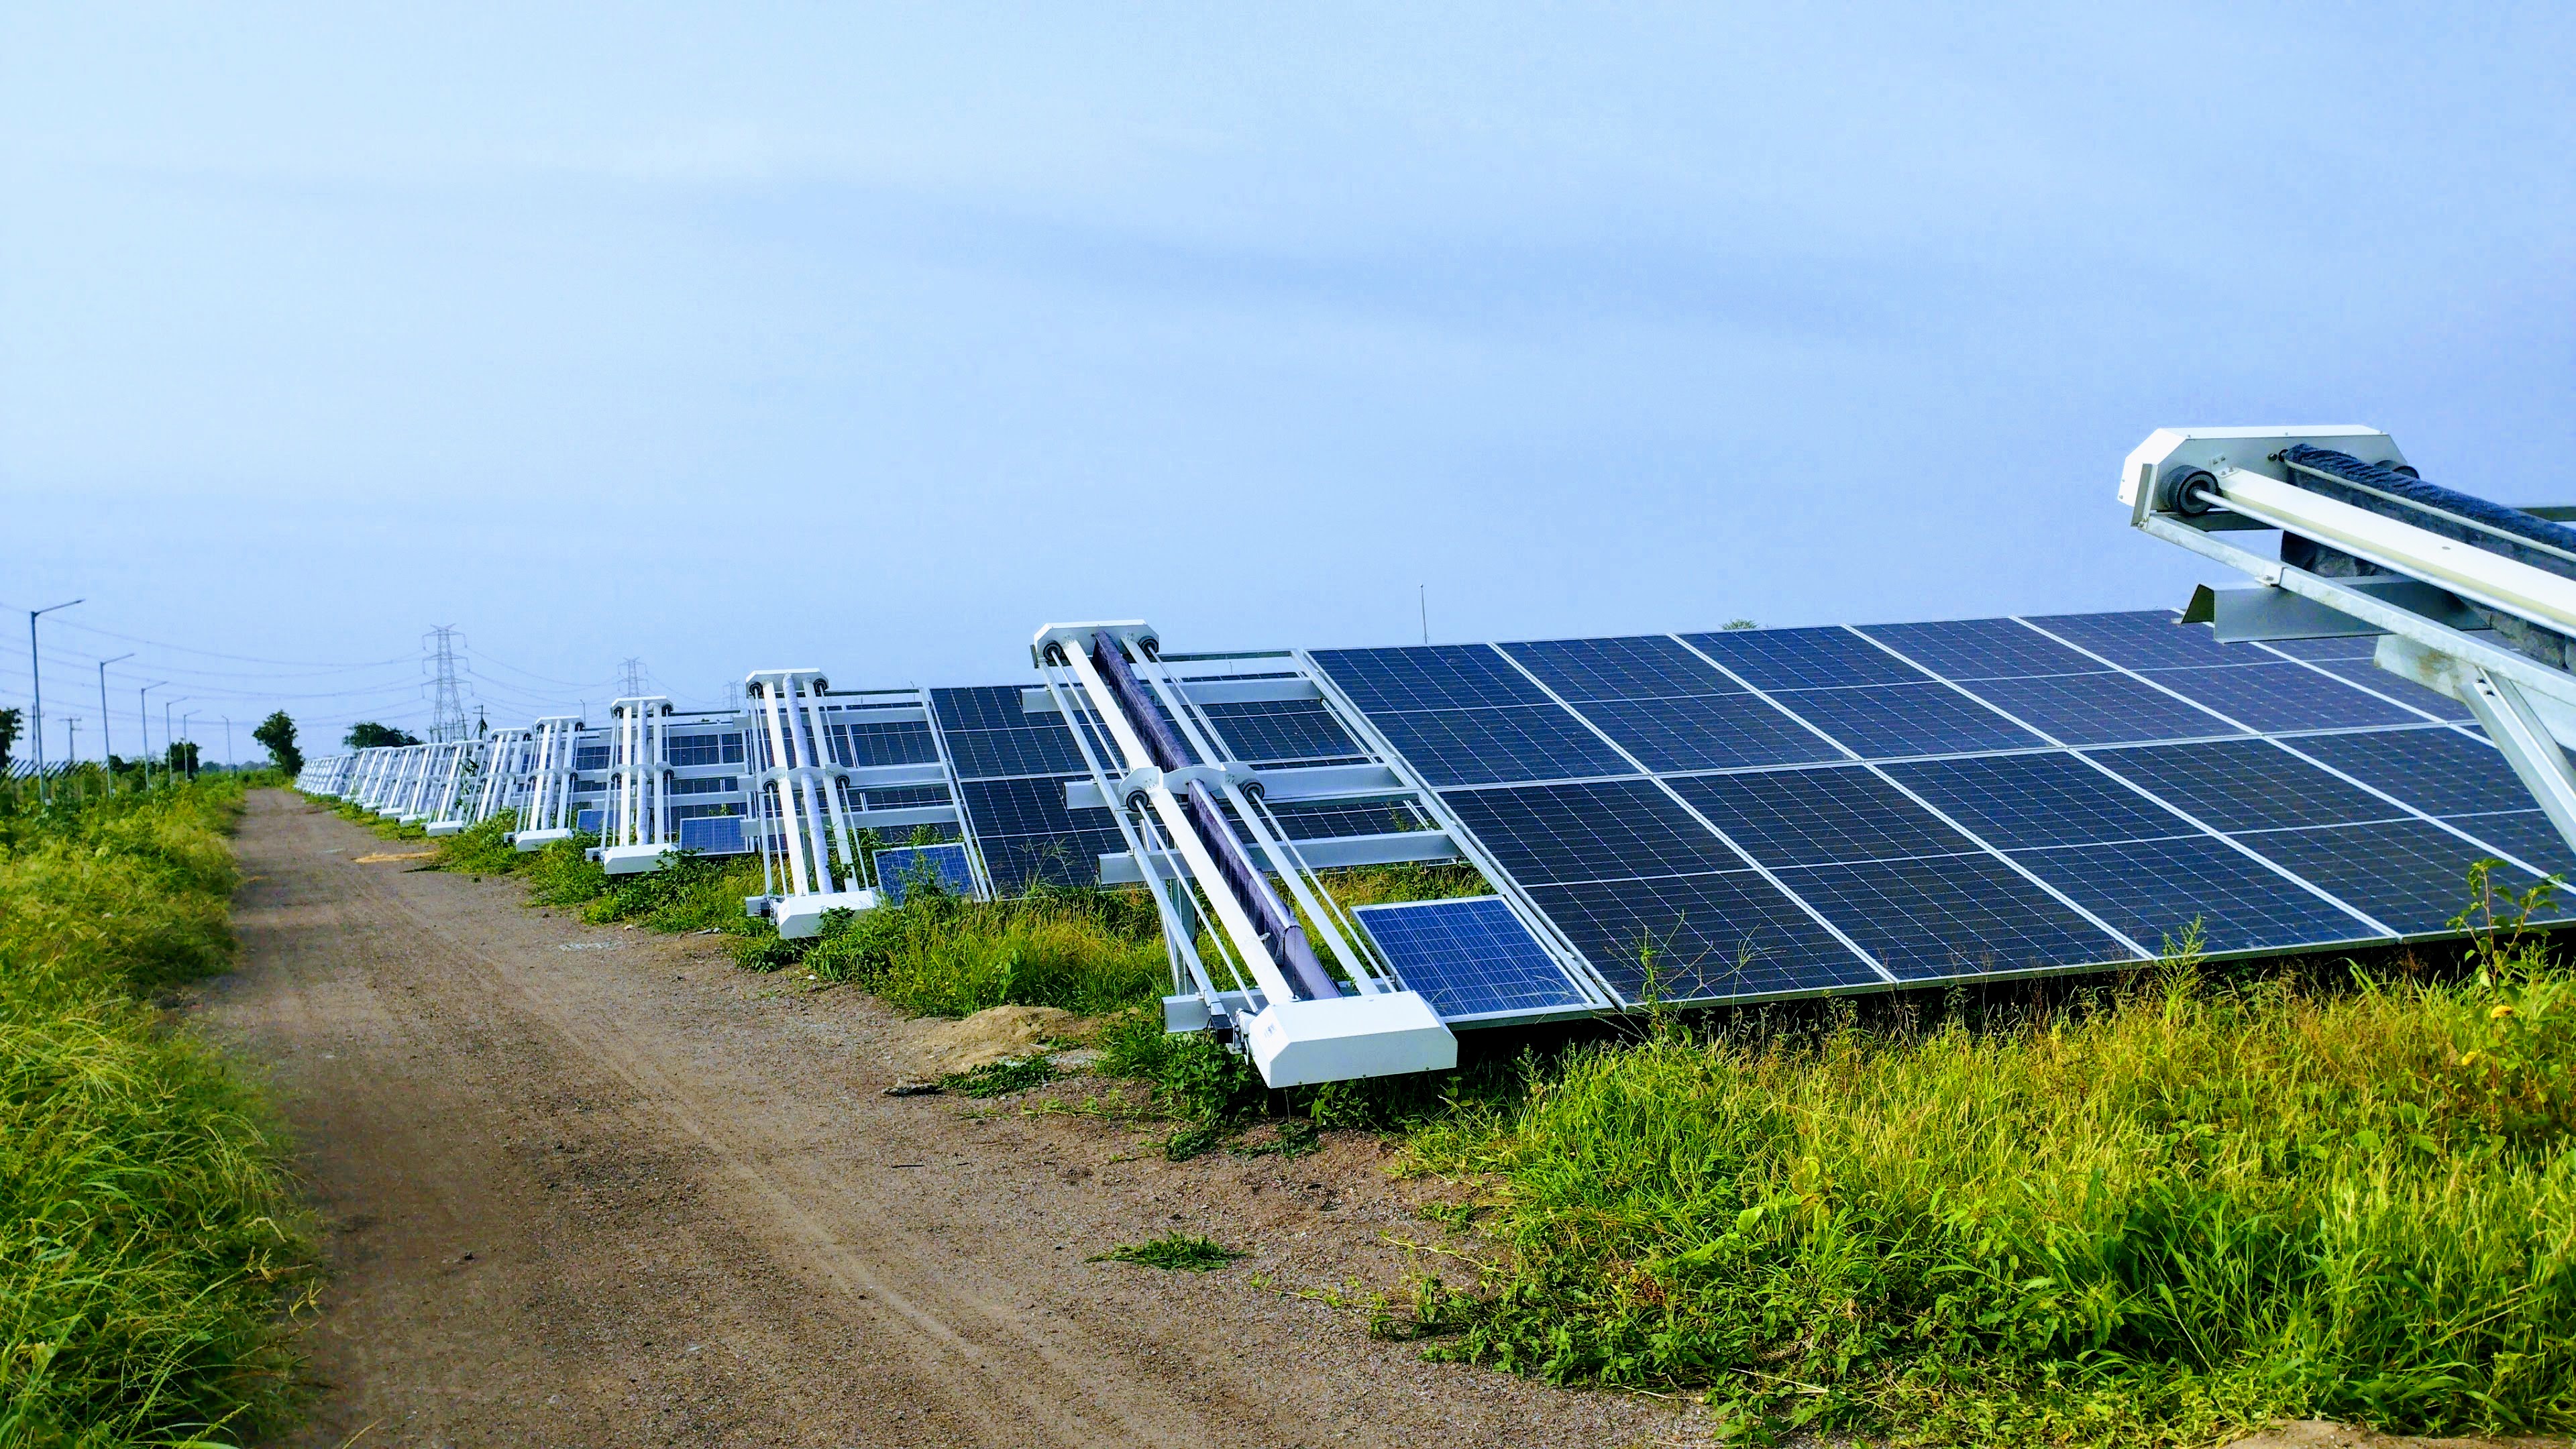
Robotic waterless fleets attempt to lift that average by increasing pass frequency without proportional labour. Manual weekly intent that becomes ten-day reality after storms leaves the average PR depressed. Compare approaches in traditional vs robotic cleaning.
How to verify cleaning impact credibly
Install or maintain clean reference modules with known calibration. Log soiled versus clean current at similar irradiance, or compute irradiance-normalized PR daily. Compare seven days pre-clean to seven days post-clean, excluding inverter outages and grid curtailment.
Use PR calculation methods consistently month to month. Drone visual inspections help operations but do not replace meter proof for finance.
When cleaning does not raise output much
If strings have blown fuses, tracker misalignment, or clipping from inverter limits, cleaning will not fix PR. If modules were already near clean baseline, spend is wasted. If crews stripe rows or robots miss blocks, average recovery understates true potential on untouched zones.
Always triage outliers before blaming soiling alone.
Partial shading from dust is not uniform: bottom edges, leading row modules, and tracker stow positions soil asymmetrically. Cleaning restores transmission where the film is worst, which is why block-level measurement beats plant-average PR alone when proving benefit.
Bifacial and high-efficiency module considerations
Bifacial modules add rear-side gain sensitivity to albedo and rear soiling. Front glass cleaning remains primary on utility tables, but owners should monitor whether dust on rear sides or ground reflectance changes matter on single-axis rows with exposed backs. High-efficiency modules cost more per watt, which raises the rupee value of each recovered PR point after cleaning.
On a 20 MW bifacial tracker project in Gujarat, finance may value a 2% PR recovery higher than an older 20 MW fixed-tilt site because annual MWh per MW is larger. Cleaning economics should use current yield, not generic benchmarks.
Soiling measurement tools that support proof
Reference modules remain the most trusted field method on Indian utility sites: one cleaned string beside soiled strings, compared at similar irradiance using handheld meters or SCADA sub-metering. Soiling stations and IV curve tracers add precision on large portfolios when calibrated quarterly.
Drone-based soiling maps help prioritize blocks but should confirm with meter data before finance approves spend. Taypro and peer operators increasingly pair robotic pass logs with PR deltas per zone to close the loop between activity and outcome.
Communicating results to non-technical stakeholders
Board members and lenders respond to recovered MWh and ₹, not transmission physics. Translate a 3.5% PR recovery on 25 MW into annual MWh and rupees at stated PPA, then show cleaning cost per recovered MWh. That framing avoids arguments about whether "efficiency" was the right word in a vendor brochure.
Include one chart: PR trend with cleaning event markers and irradiance-normalized methodology footnoted. Consistency month to month builds credibility when off-takers challenge Q2 shortfalls.
Does cleaning increase efficiency on a 50 MW tracker plant after monsoon?
It increases output where mud splash and organic films remain after rain. Trackers with soil splash on lower edges often show 3–6% PR recovery on affected blocks after approved wet or hybrid cleans. Plants that assume monsoon equals "free clean" without reference module data often discover Q3 PR still 2–4% below baseline in low-lying zones.
Key takeaways for plant managers
- Cleaning restores irradiance transmission; it does not change cell efficiency specs.
- Expect recovery roughly equal to soiling loss removed, block by block.
- Model average annual PR, not one-day post-clean peaks.
- Prove impact with reference modules and normalized PR.
- Measure before spending; skip cleans when soiling loss is below economic threshold.
Separate cell efficiency from soiling loss in every board report. Cleaning recovers transmission; it does not change module nameplate efficiency.
Related resources
Frequently asked questions
No. Cleaning removes dust and films blocking light reaching the cell. Meter output and performance ratio rise because more irradiance is transmitted through glass, not because the photovoltaic conversion physics of the cell improved. Marketing language conflates these; utility O&M should not.
Often similar magnitude to the soiling loss present before the clean. Lightly soiled modules may recover 2–4% PR; heavy post-storm dust on exposed Rajasthan rows can show 5–15% immediate recovery on reference strings until redeposition begins.
Until dust redeposits. In dry western India, measurable re-soiling can appear within days after a storm cycle. That is why frequency economics matter more than one spectacular post-clean PR spike on a single afternoon.
Compare irradiance-normalized PR or reference module current against clean baselines before and after, over similar weather windows. Exclude single midday snapshots on partly cloudy days, which mislead control rooms and finance.
Uneven soiling, partial row coverage, tracker vs fixed-tilt geometry, and electrical issues masquerading as soiling all suppress recovery. Always pair cleaning verification with IV curve or string checks on outlier blocks.