Summary for plant managers
Common failure points in solar cleaning robots, such as sensor drift and mechanical drive wear, are typically mitigated through routine NECTYR-monitored diagnostics and scheduled maintenance. Choosing between robotic cleaning and manual labour requires balancing immediate CAPEX against long-term operational consistency to avoid permanent performance degradation. By assessing the long-term O&M and soiling costs, plant managers can better justify the shift to automated systems.
- Typical soiling losses in India range from 15% to 30% without consistent cleaning, particularly in arid zones.
- Common robot failure points include sensor obstruction, battery degradation, and mechanical drive wear.
- Manual cleaning cost can fluctuate up to 20% due to labour availability, whereas robotic CAPEX provides predictable long-term OPEX.
- Switching to dry-cleaning robots can reduce water consumption by up to 90% in water-stressed sites like Rajasthan.
- Robotic cleaning is generally recommended for sites exceeding 5MW to ensure consistent yield targets.
For a 5MW+ site, the primary decision driver is the site-specific soiling profile rather than equipment cost alone. Asset owners prioritizing high availability should evaluate robot failure modes against the performance risk of delayed manual cleaning cycles, which can lead to permanent soil cementing on modules.
Common failure points in solar cleaning robots explained
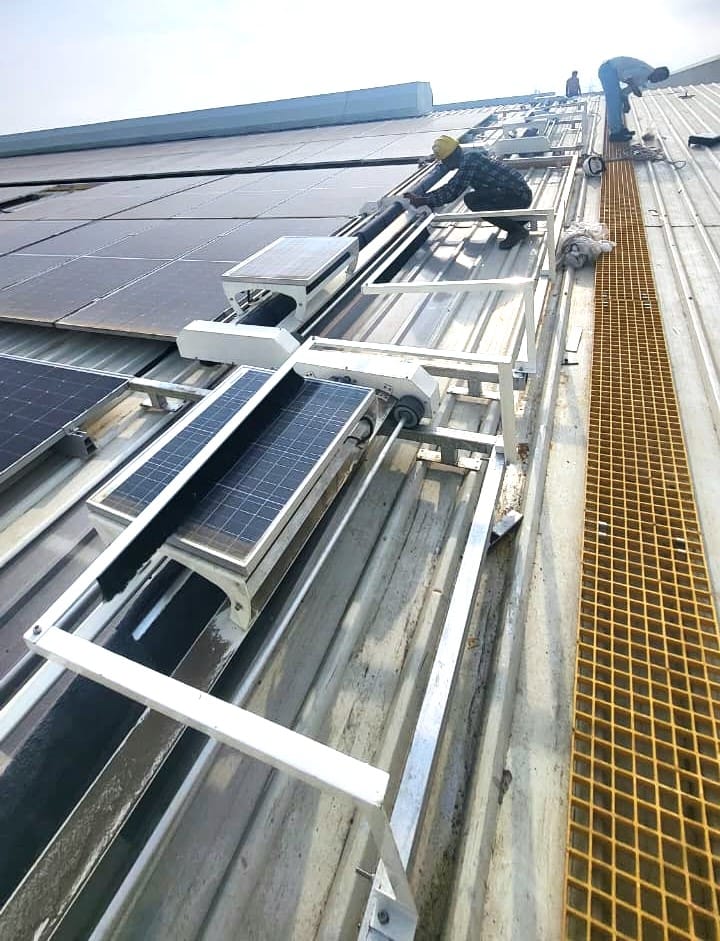
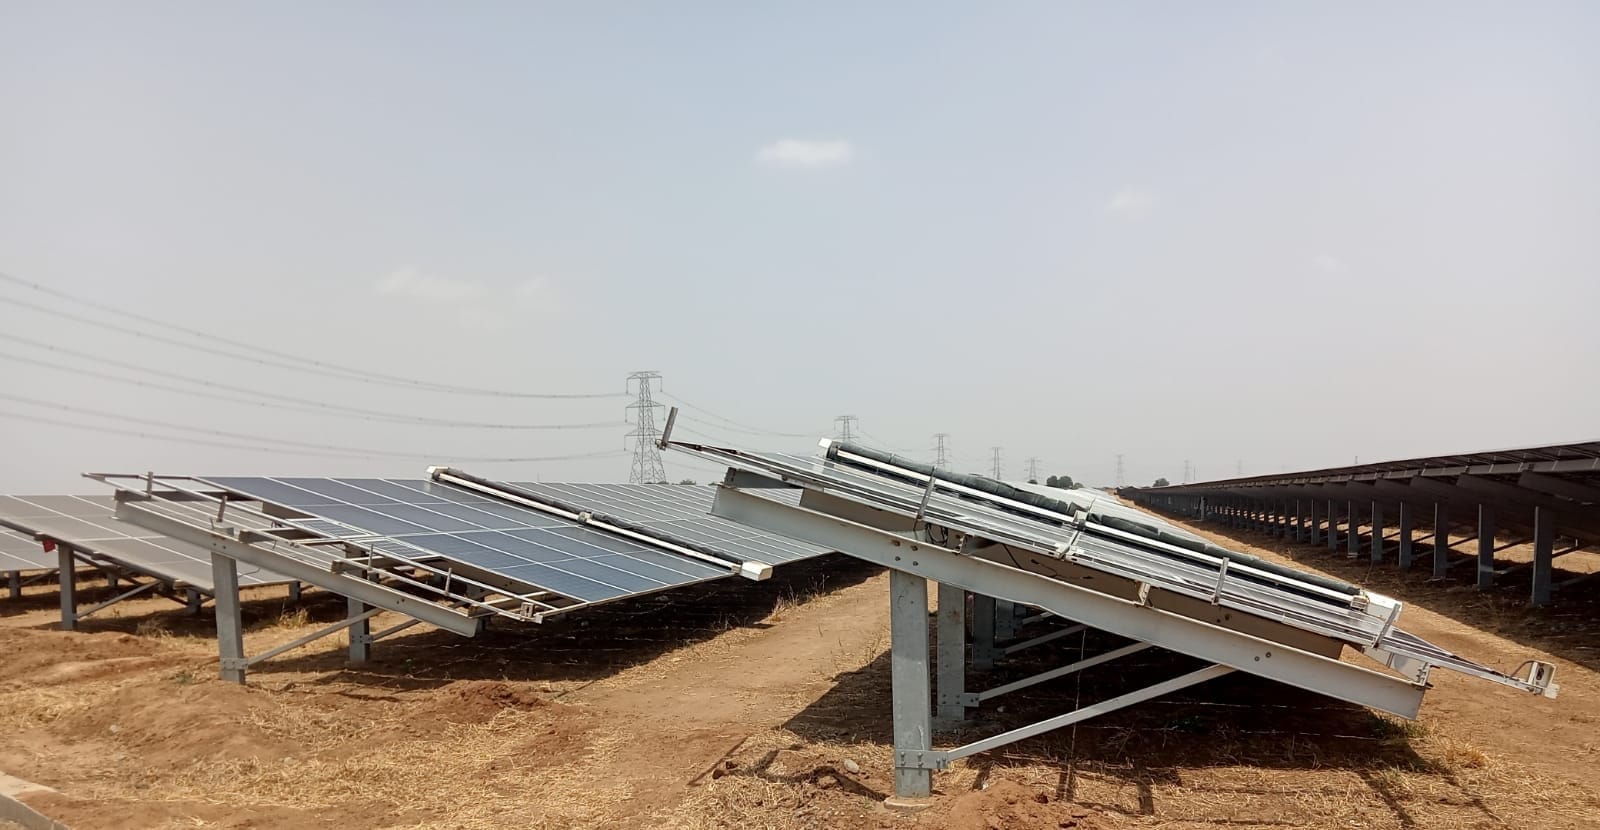
Understanding the failure modes of autonomous cleaning hardware is critical for any utility-scale plant manager. Most robotic system issues stem from environmental stressors that exceed design tolerances. Sensor obstruction is a leading cause of downtime, where dust buildup on proximity or edge-detection sensors leads to navigation errors. In high-dust corridors like Gujarat, robots lacking robust IP65-rated enclosures often suffer from particulate ingress that affects motor longevity and drive-train efficiency. These sensors are susceptible to micro-pitting caused by wind-blown silica, which can render ultrasonic sensors blind after only 1,000 operational hours if not regularly wiped.
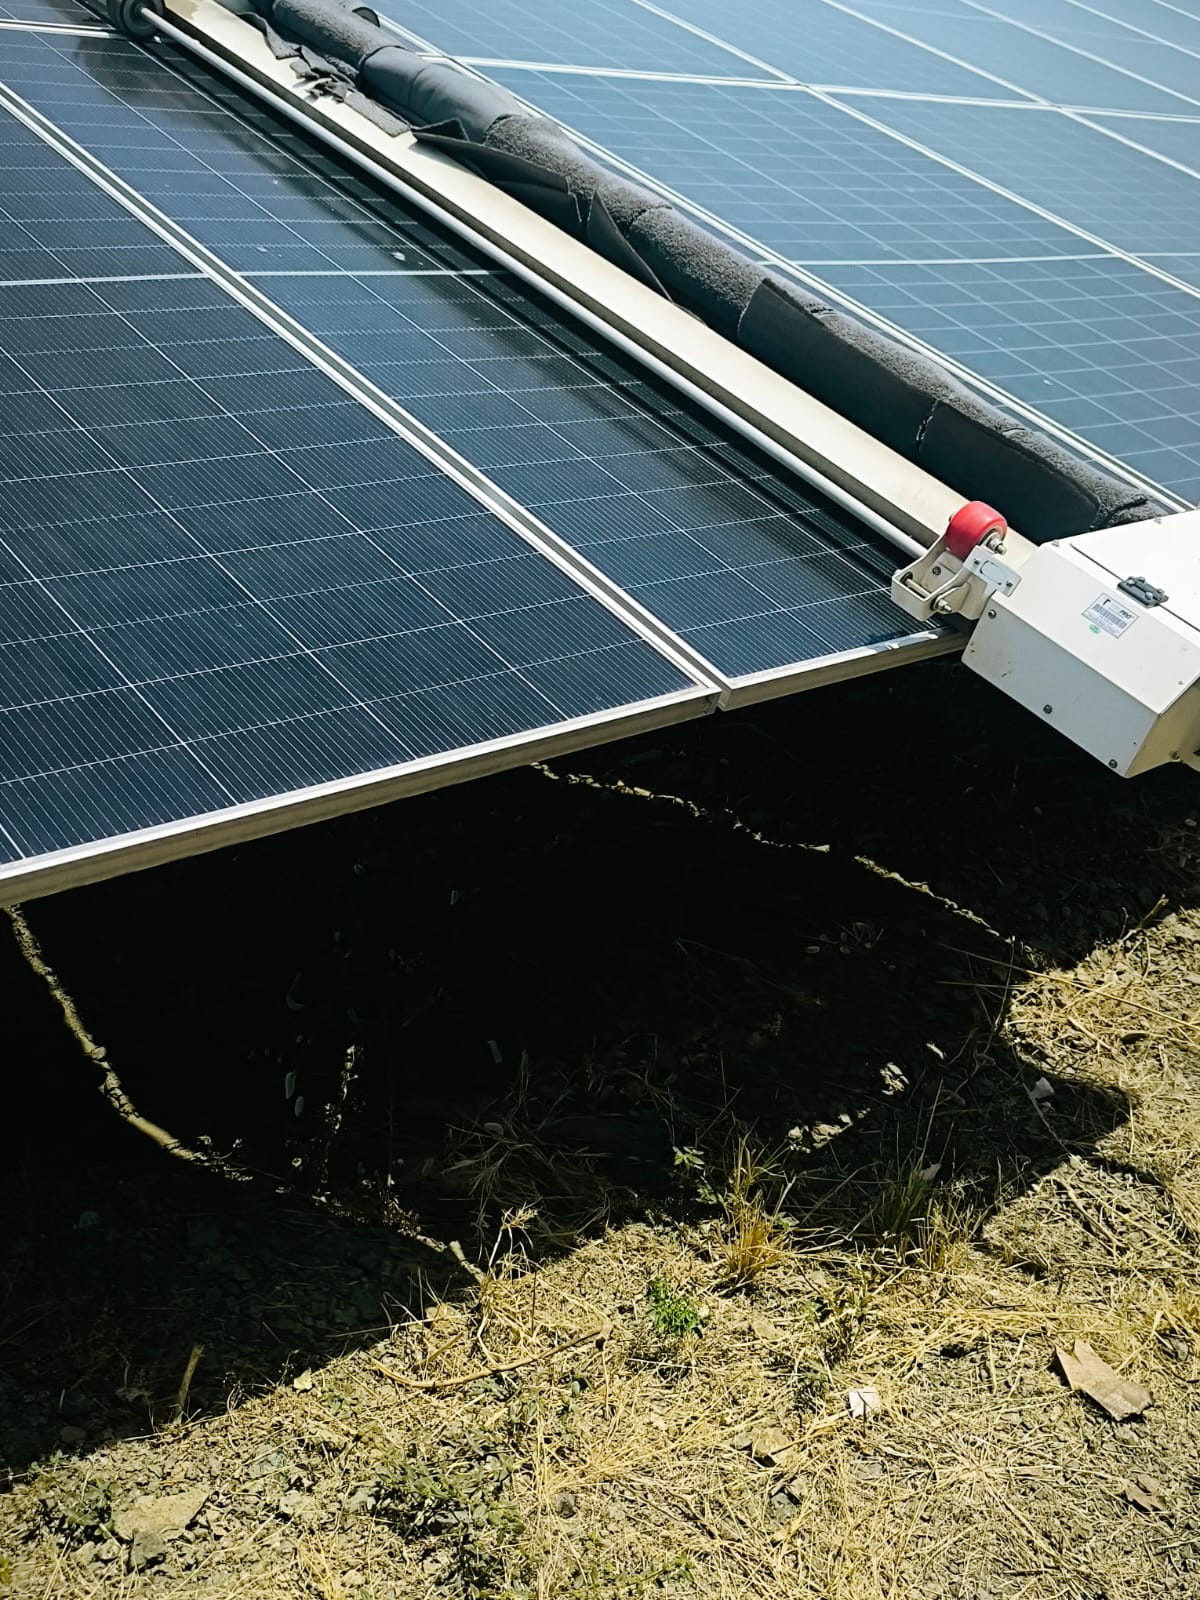
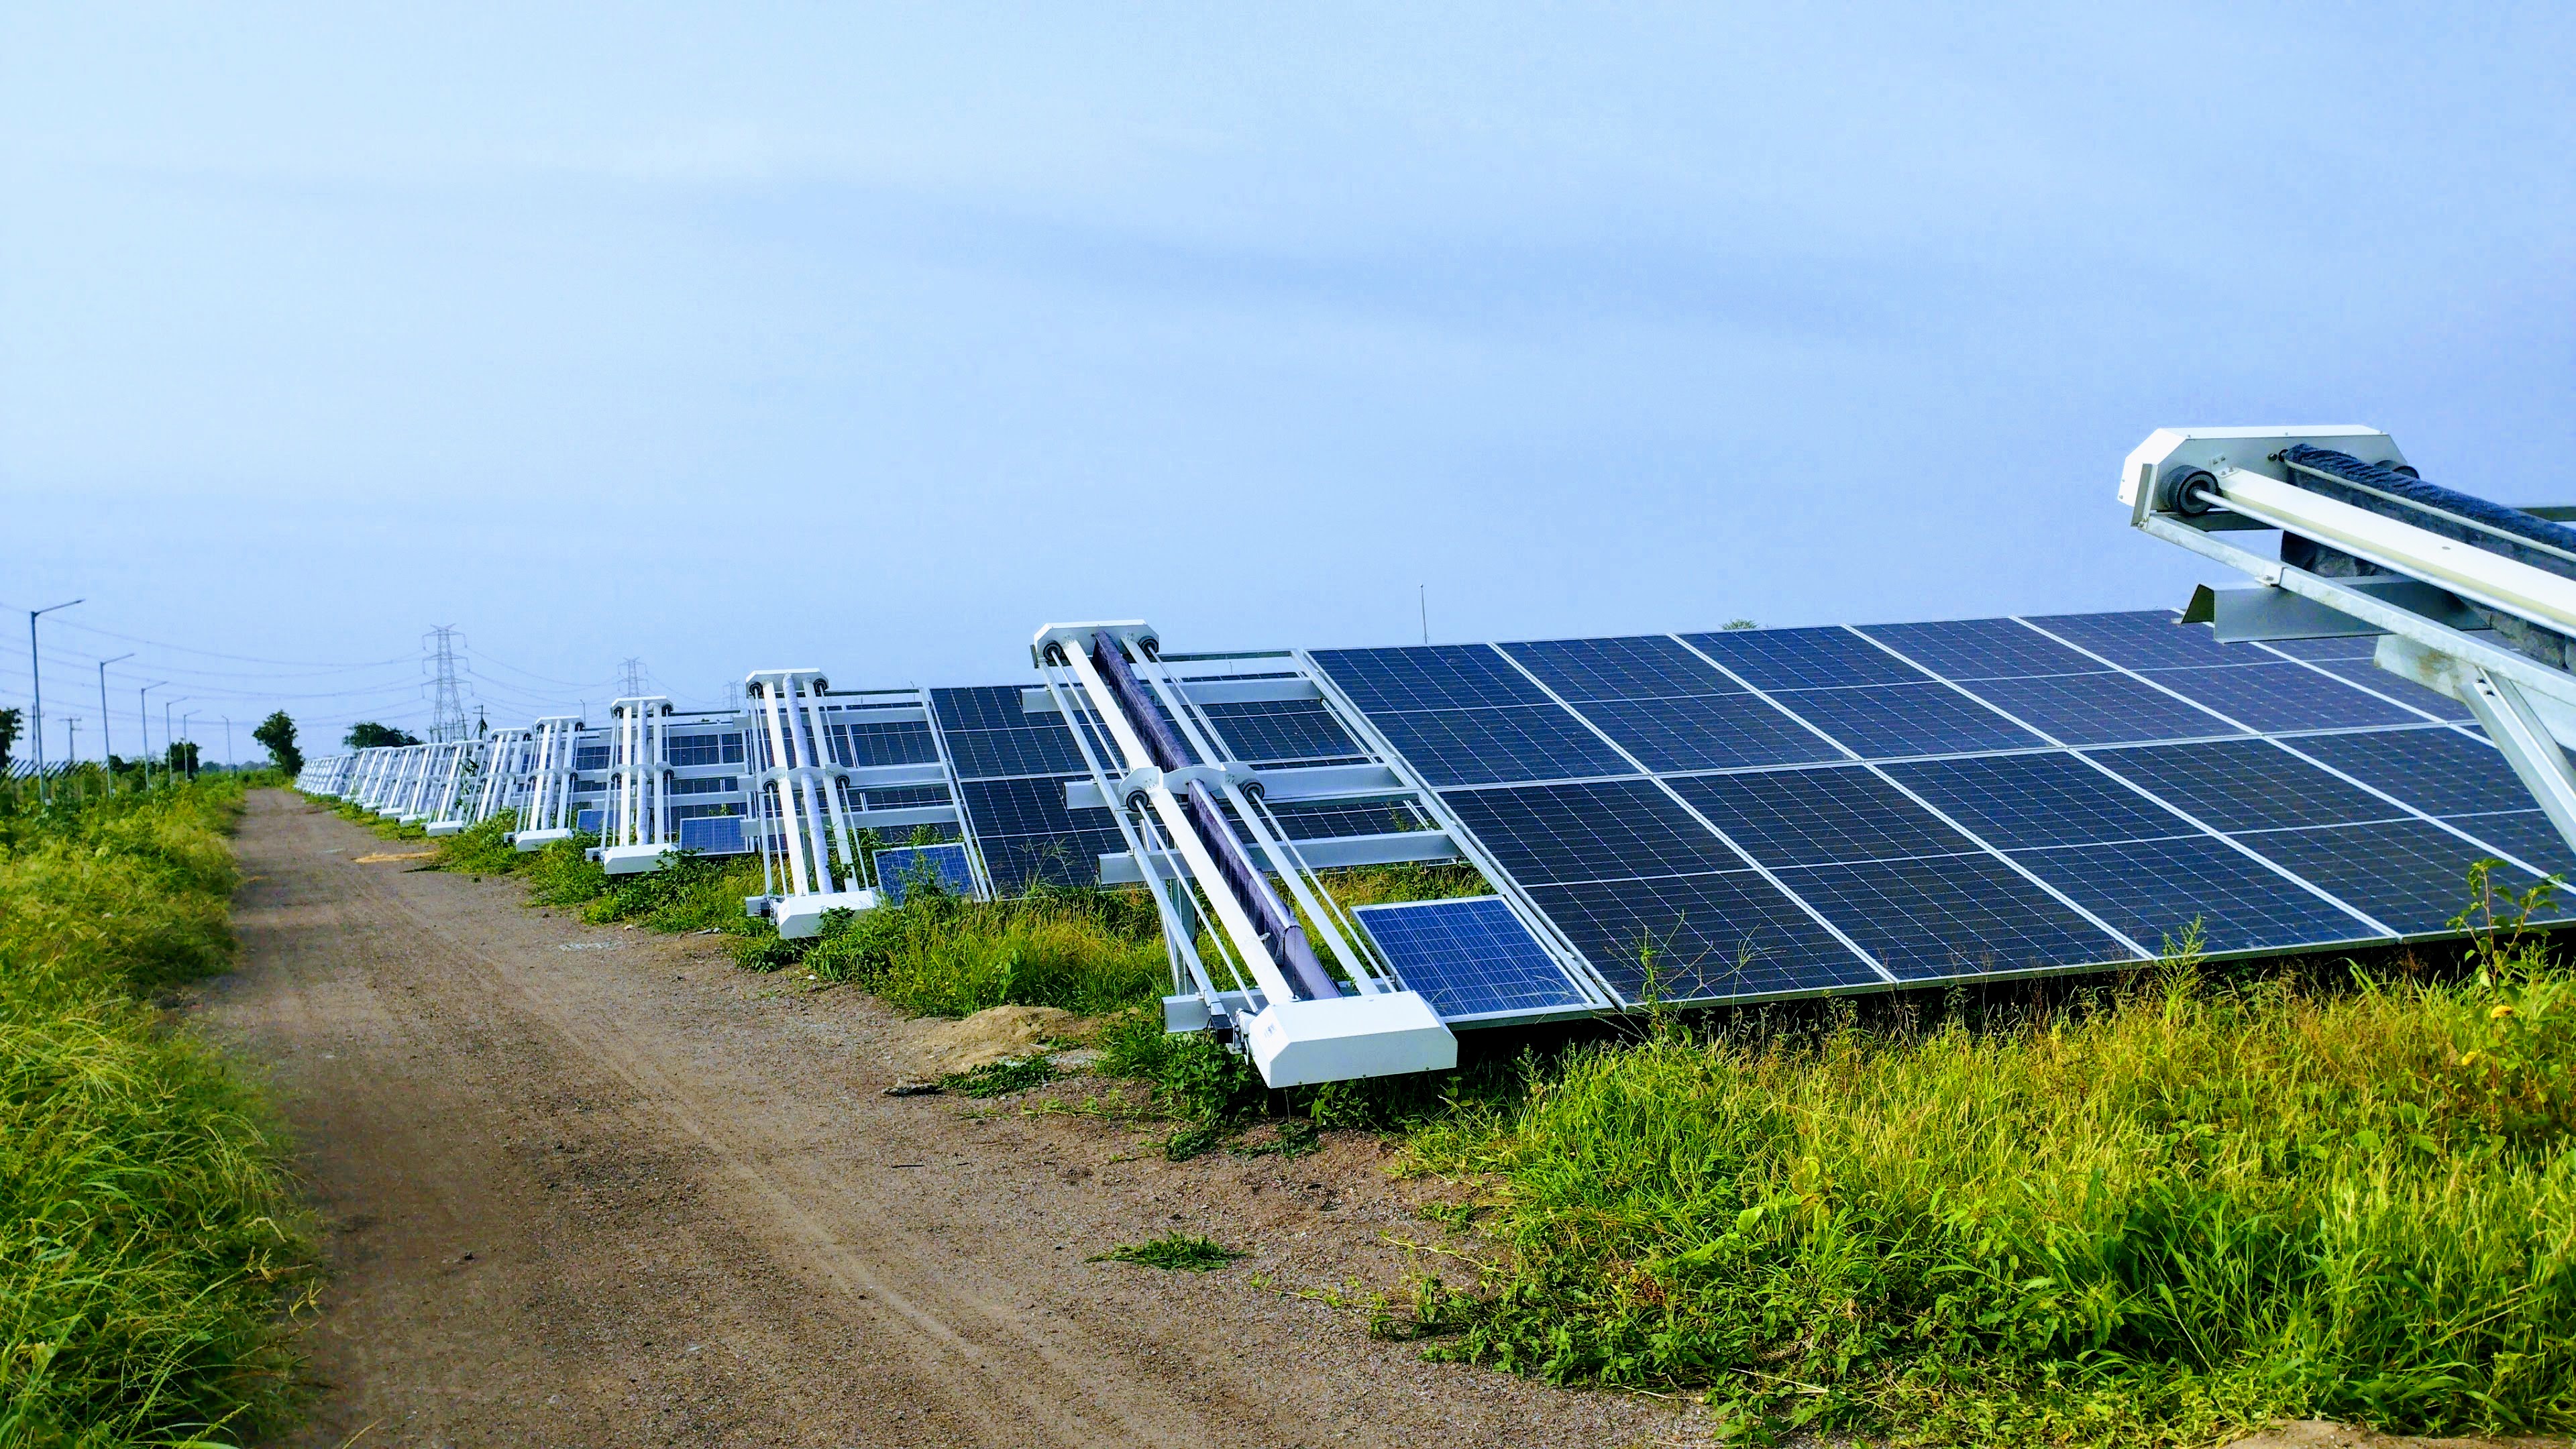
Mechanical wear also remains a significant point of concern. Robots utilizing brush-based cleaning, such as the NYUMA line, rely on high-quality UV-stable components to manage single-pass operations effectively. When these materials degrade due to prolonged exposure to intense heat, brush pressure can become inconsistent, leading to uneven clearing of the module surface. Similarly, battery degradation remains a failure point in large, distributed arrays. Fleet management systems like NECTYR help operators track cell health and schedule recharges before failure occurs, ensuring that robots do not strand mid-row. Proactive monitoring transforms these potential failures into manageable maintenance tasks rather than surprise generation losses.
Furthermore, communication link instability can lead to idle robots. In large-scale deployments where robots operate on a mesh network, radio frequency interference from surrounding electrical infrastructure or signal attenuation in long rows can cause the robot to lose connection to the NECTYR dashboard. When this occurs, the robot defaults to a 'safe stop' state to prevent damage. Maintaining a robust RF gateway network every 500 meters is an essential, often overlooked, preventative measure for robotic fleet reliability in utility-scale environments.
Predictive maintenance strategies for robotic reliability
To maximize uptime, O&M teams must shift from reactive repair to predictive maintenance. By leveraging real-time data from NECTYR, managers can identify the early warning signs of common failure points in cleaning robots before they trigger a system-wide fault. The goal is to move from a corrective maintenance schedule (fixing after breakdown) to a condition-based maintenance schedule, which can extend the operational life of the robot by 30% to 40%. Successful implementation often relies on strategic O&M integration to align hardware performance with plant-wide energy production goals.
Battery lifecycle management
Battery performance often follows a predictable decay curve. In extreme desert temperatures, thermal stress accelerates chemical degradation. Operators should implement a structured charge management policy that prevents deep discharge cycles (dropping below 20% capacity). By monitoring voltage drops during duty cycles, the software can flag underperforming units for localized replacement, preventing the robot from becoming stranded in the middle of a long string. For a 50MW site, managing a fleet of 50 to 100 robots, it is advisable to keep 5% of the total battery capacity in reserve as ready-to-swap spares to ensure zero downtime during critical cleaning windows.
Sensor calibration and diagnostic loops
Navigation sensors, including LiDAR and ultrasonic proximity detectors, often fail due to the accumulation of fine particulates. A recurring issue in dusty environments is lens pitting, where coarse sand particles micro-abrade the optical surfaces. Implementing a bi-weekly visual inspection checklist ensures these sensors remain calibrated. Robots with self-diagnostic loops can signal a degraded signal strength long before navigation failure occurs, allowing the maintenance crew to perform a simple wipe-down rather than a costly sensor module replacement. When calibrating, ensure the robot undergoes a factory reset of its inertial measurement unit (IMU) at least every six months to compensate for vibrations experienced during high-speed transit between rows.
Technical evaluation of mechanical drive train failures
The mechanical assembly of a cleaning robot represents the most significant physical failure point. Because these machines move across thousands of square meters of glass, the drive train experiences constant frictional wear. Understanding these failure modes is essential for long-term site planning, especially when deploying units across uneven terrain or mounting structures with varying tilt angles.
Drive motor integrity and torque monitoring
Drive motors are prone to overheating when cleaning high-friction surfaces or navigating steep tracking angles. If a motor struggles to maintain consistent speed, this is often an indicator of debris buildup in the gear housing. Monitoring current draw is the most effective way to detect early motor failure. A spike in energy consumption while traversing a standard row usually suggests that the mechanical drivetrain is facing excessive resistance, often caused by dust ingress into internal bearings or gear degradation. In high-wind sites, drive wheels may experience higher slip ratios, leading to accelerated tread wear; therefore, rubber compound hardness should be matched to the site-specific mounting material (e.g., anodized aluminum vs. galvanized steel).
Component life expectancy checklist
To avoid sudden failures, track the following critical components against their expected service life:
| Component | Failure Indicator | Maintenance Interval |
|---|---|---|
| Brush Motor | Spike in current or amperage | 18–24 Months |
| Drive Wheels | Traction slip or degradation | 12–18 Months |
| Battery Cells | Rapid voltage drop or capacity fade | 24–36 Months |
| Edge Sensors | Navigation errors or erratic path | 6–12 Months |
| Transmission Belts | Audible whining or belt slip | 18–24 Months |
How does robotic cleaning compare to manual labour on a 50 MW plant?
For a 50 MW installation, the operational contrast between manual teams and robotic cleaning is stark. A manual crew of 30 workers can clean a 50 MW plant in approximately 10 to 14 days, but the cleaning quality is subject to fatigue, human error, and inconsistent brush pressure. Conversely, a robotic fleet of 60 to 80 units can cover the same site in 3 to 5 days, maintaining uniform cleaning cycles that prevent the formation of soil cementation. The cost-benefit analysis typically shows that while manual labour has a lower immediate expenditure, the loss of generation yield due to slower cleaning cycles and localized hot spots results in a 5% to 8% lower performance ratio annually compared to robotic fleets. Implementing comprehensive O&M strategies is key to maintaining consistent yields in these large-scale environments.
Is a robot worth the investment over manual labour?
Choosing between manual labour and automated cleaning involves a fundamental trade-off between flexible, low-CAPEX expenses and consistent, high-uptime robotic performance. In utility-scale plants exceeding 5MW, manual teams often struggle with seasonal variability and quality control, leading to inconsistent cleaning patterns that create localized hot spots on module strings. While manual crews offer a low barrier to entry, the long-term impact of uneven brush pressure and water-based chemical degradation can outweigh initial savings. Manual cleaning also creates safety risks for staff working at height and around high-voltage equipment, leading to potential liability insurance premiums that are often ignored in the initial cost comparison.
Automated systems, such as the NYUMA or GLYDE, provide high-frequency, repeatable cycles that stabilize the plant's performance ratio. The comparison table below highlights the decision drivers for utility-scale deployments in India.
| Factor | Manual Cleaning | Robotic Cleaning |
|---|---|---|
| Consistency | Low (Labour availability, fatigue) | High (Pre-programmed cycles) |
| Water Use | High (1–2 Litres per panel) | Near-Zero (Dry cleaning) |
| Module Impact | Variable (Manual scratch risk) | Low (Constant brush pressure) |
| Scalability | Requires linear headcount increase | Scalable via fleet management (NECTYR) |
| Cost Profile | Variable OPEX (Labour inflation) | Predictable CAPEX + low OPEX |
Impact of soiling and failure on India utility-scale performance
Soiling loss is one of the most critical performance drains in India, with yield reductions ranging from 15% to 30% annually in high-dust regions like Rajasthan and Gujarat. When a robot suffers a technical failure, the immediate impact is a localized dip in the performance ratio of a single row or block. However, an effective fleet strategy treats these as manageable events rather than catastrophic failures. By using NECTYR for real-time diagnostics, operators can identify sensor obstructions or battery issues before they escalate into persistent soiling losses.
In contrast, when manual cleaning crews are delayed, the risk is cumulative. Dust that stays on modules for extended periods can undergo a cementing process, particularly in coastal or humid regions, making it significantly harder to remove during the next cycle. For a 50MW+ site, the cumulative cost of these delays frequently exceeds the cost of maintaining a robust, automated robotic fleet. In the Indian market, where irradiance levels are high, even a three-day delay in cleaning can lead to a 2% drop in quarterly revenue. The robotic advantage lies in the ability to run cleaning cycles overnight or during low-load hours, effectively bypassing the logistical friction of managing large crews during business hours.
How do cleaning robot failure rates compare to manual crew turnover?
In utility-scale operations across India, the primary operational risk shifts from machine reliability to human variability. Manual cleaning crews often face high turnover rates during harvest seasons or local construction cycles, leading to significant fluctuations in cleaning quality and safety oversight. When a manual team is understaffed or poorly trained, performance drops, resulting in streaks of uncleared debris that directly increase string mismatch losses. In contrast, robotic failure is technical and measurable. Fleet management software like NECTYR provides diagnostic alerts for battery health or sensor obstruction, allowing O&M teams to address issues before they become systemic.
While a robot might experience a mechanical failure, the downtime is typically localized to a single row or block. A missing or ineffective manual crew member, however, can impact an entire 5MW+ site block for days. For asset managers, the comparison is clear: robotic systems offer a predictable, low-variance failure rate, whereas manual labour introduces higher volatility in cleaning quality. The trade-off favours automation when maintenance schedules require strict adherence to performance ratio targets, especially in regions with high dust density where cleaning frequency cannot be compromised.
Operational decision matrix for utility-scale solar
Selecting the right cleaning method requires evaluating local environmental factors against your plant size. The following decision matrix helps plant managers determine the path of least resistance for their specific site conditions.
| Decision Driver | Manual Cleaning | Robotic Cleaning |
|---|---|---|
| Site Size | Below 5MW | 5MW+ Utility scale |
| Soiling Type | Seasonal, loose dust | Daily, heavy soiling |
| Water Access | Plentiful | Scarce or high-cost water |
| Labour Cost | Low to moderate | High volatility |
| Safety Compliance | Variable | Automated consistency |
For sites exceeding 5MW, the path toward automatic solar panel cleaning systems becomes the operational baseline. Managers should prioritize systems with remote diagnostic capabilities to mitigate the failure points associated with sensors and battery life. By centralizing management through a single software layer, you minimize the risks associated with both machine wear and labour inconsistency, ensuring your plant maintains its expected performance ratio throughout the high-irradiance months. This transition also allows the O&M budget to shift from variable labour costs to predictable asset depreciation, which is a more favorable accounting treatment for long-term utility asset management.
Key takeaways for plant managers
- Evaluate current soiling losses against local dust chemistry: annual yield losses in arid regions like Rajasthan often range from 15% to 30%.
- Shift from manual to robotic cleaning when plant capacity exceeds 5MW to stabilize long-term O&M budgets against labour turnover.
- Prioritize robots with remote diagnostic connectivity to transform common failure points into actionable maintenance alerts.
- Deploy waterless solutions to save up to 90% in water usage, particularly in regions where liquid cleaning resources are costly or unavailable.
- Benchmark O&M expenditure at 1–2% of total CAPEX, using robotic automation to maintain high availability and meet grid-connected PR guarantees.
- Establish a regular 6-month calibration cycle for IMU and navigation sensors to prevent drift-related navigation errors.
What plant managers should do next
- Run a Soiling Audit: Use site-specific data to calculate your current revenue loss due to soiling. This data provides the essential baseline for your robot price and ROI analysis.
- Verify Module Compatibility: Ensure the robot's brush material (such as UV-stable PBT or microfiber) is certified for your specific module manufacturer to avoid voiding long-term warranties.
- Test Connectivity: Verify that your site's network infrastructure supports the RF mesh or LTE/Wi-Fi requirements for full autonomy and remote monitoring via NECTYR.
- Initiate a Pilot Block: Deploy robotic units on a single 1MW block for 90 days to gather performance data before committing to a site-wide rollout.
Sources and further reading
Frequently asked questions
Common failure points in solar cleaning robots, such as sensor drift and mechanical drive wear, are typically mitigated through routine NECTYR-monitored diagnostics and scheduled maintenance. Choosing between robotic cleaning and manual labour requires balancing immediate CAPEX against long-term operational consistency to avoid permanent performance degradation.
Manual labour costs can fluctuate by up to 20 percent based on local availability and performance, making it less predictable. In contrast, robotic cleaning provides consistent operational costs, and potential equipment failures can be managed through fleet diagnostic software.
Robotic cleaning offers higher ROI by preventing the 15 to 30 percent soiling losses common in Indian sites without consistent cleaning. Additionally, dry-cleaning robots can reduce water consumption by up to 90 percent, which significantly lowers operational costs in arid regions.
Robotic cleaning is generally safer for high-efficiency modules because it avoids the performance risk of delayed manual cleaning cycles, which can cause permanent soil cementing. Using automated systems with UV-stable components ensures consistent brush pressure and prevents the physical damage often associated with irregular manual scrubbing.