Summary for plant managers
Choosing between drone-based soiling inspection and ground-based cleaning robots involves balancing diagnostic precision with automated operational throughput. Aerial inspections provide critical visibility into performance gaps, while robotic cleaning systems deliver the repeatable, consistent intervention required to maintain yield at utility scales. Effective O&M strategy requires integrating these technologies to ensure intervention is data-led rather than schedule-driven, particularly in large-scale plants across Rajasthan, Gujarat, and other high-soiling Indian regions. Through the use of predictive maintenance strategies, managers can now foresee performance drops before they impact the bottom line.
- Aerial drone inspection typically identifies performance hotspots with >3% loss per block.
- Robotic cleaning is recommended when daily soiling accumulation exceeds 0.5% in arid regions.
- Operational budgets in India typically allocate 1-2% of annual revenue for advanced O&M technology.
- Target 90% water reduction by moving from manual washing to autonomous dry cleaning systems.
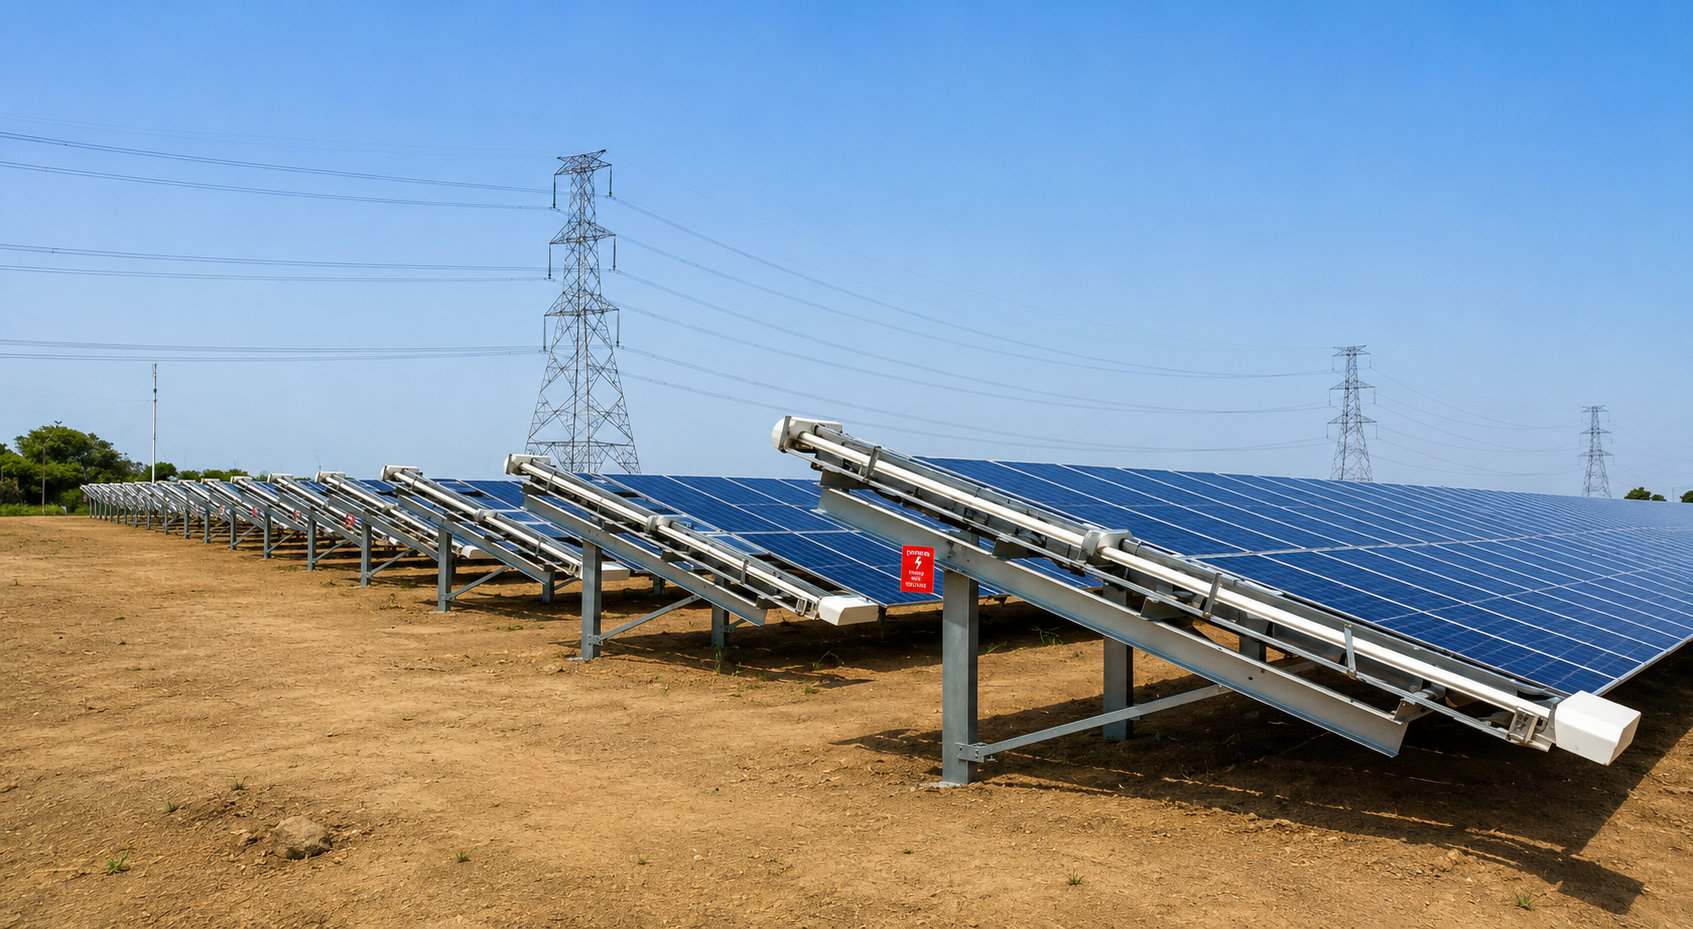
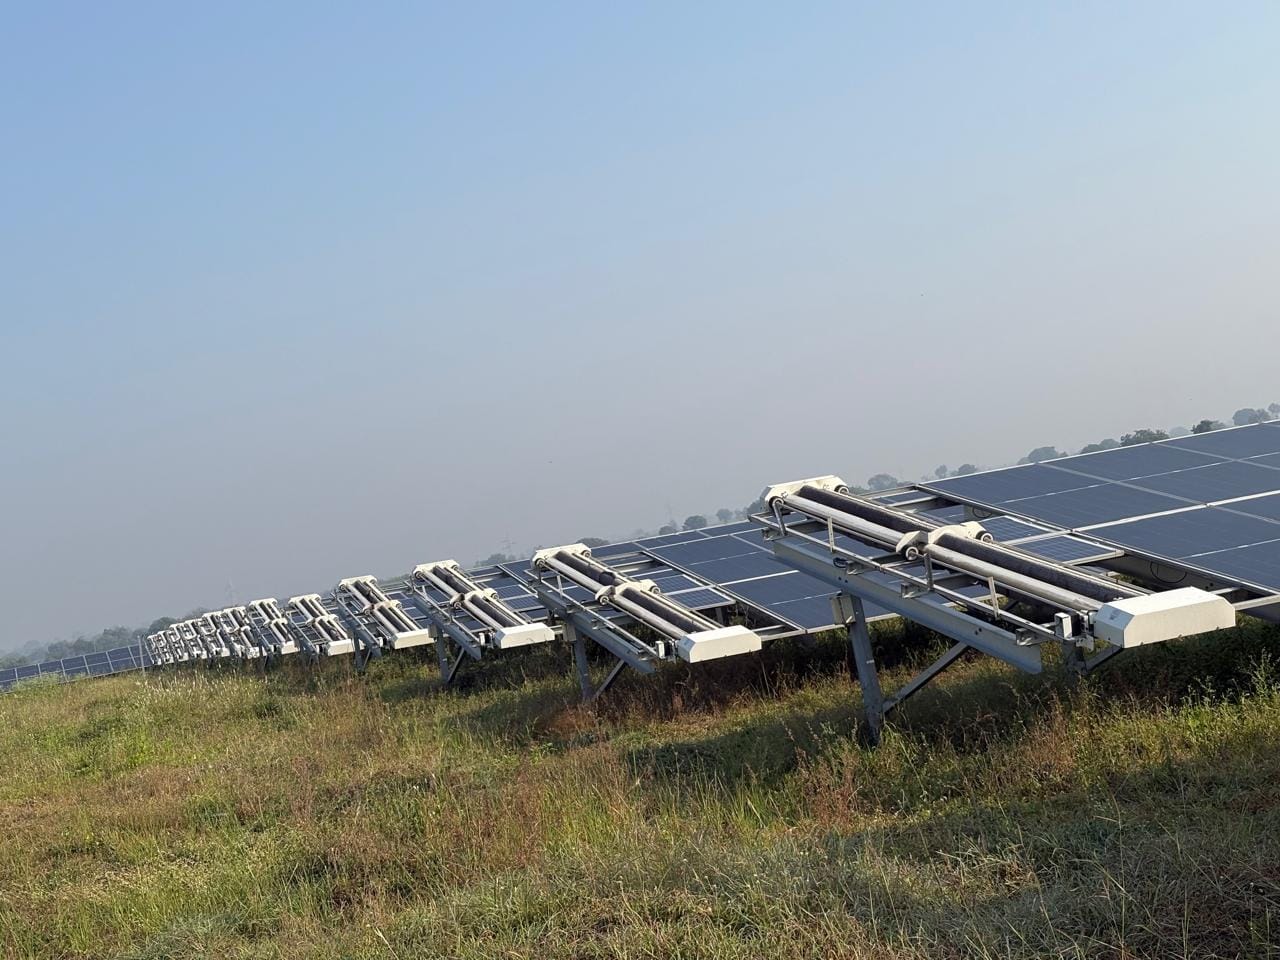
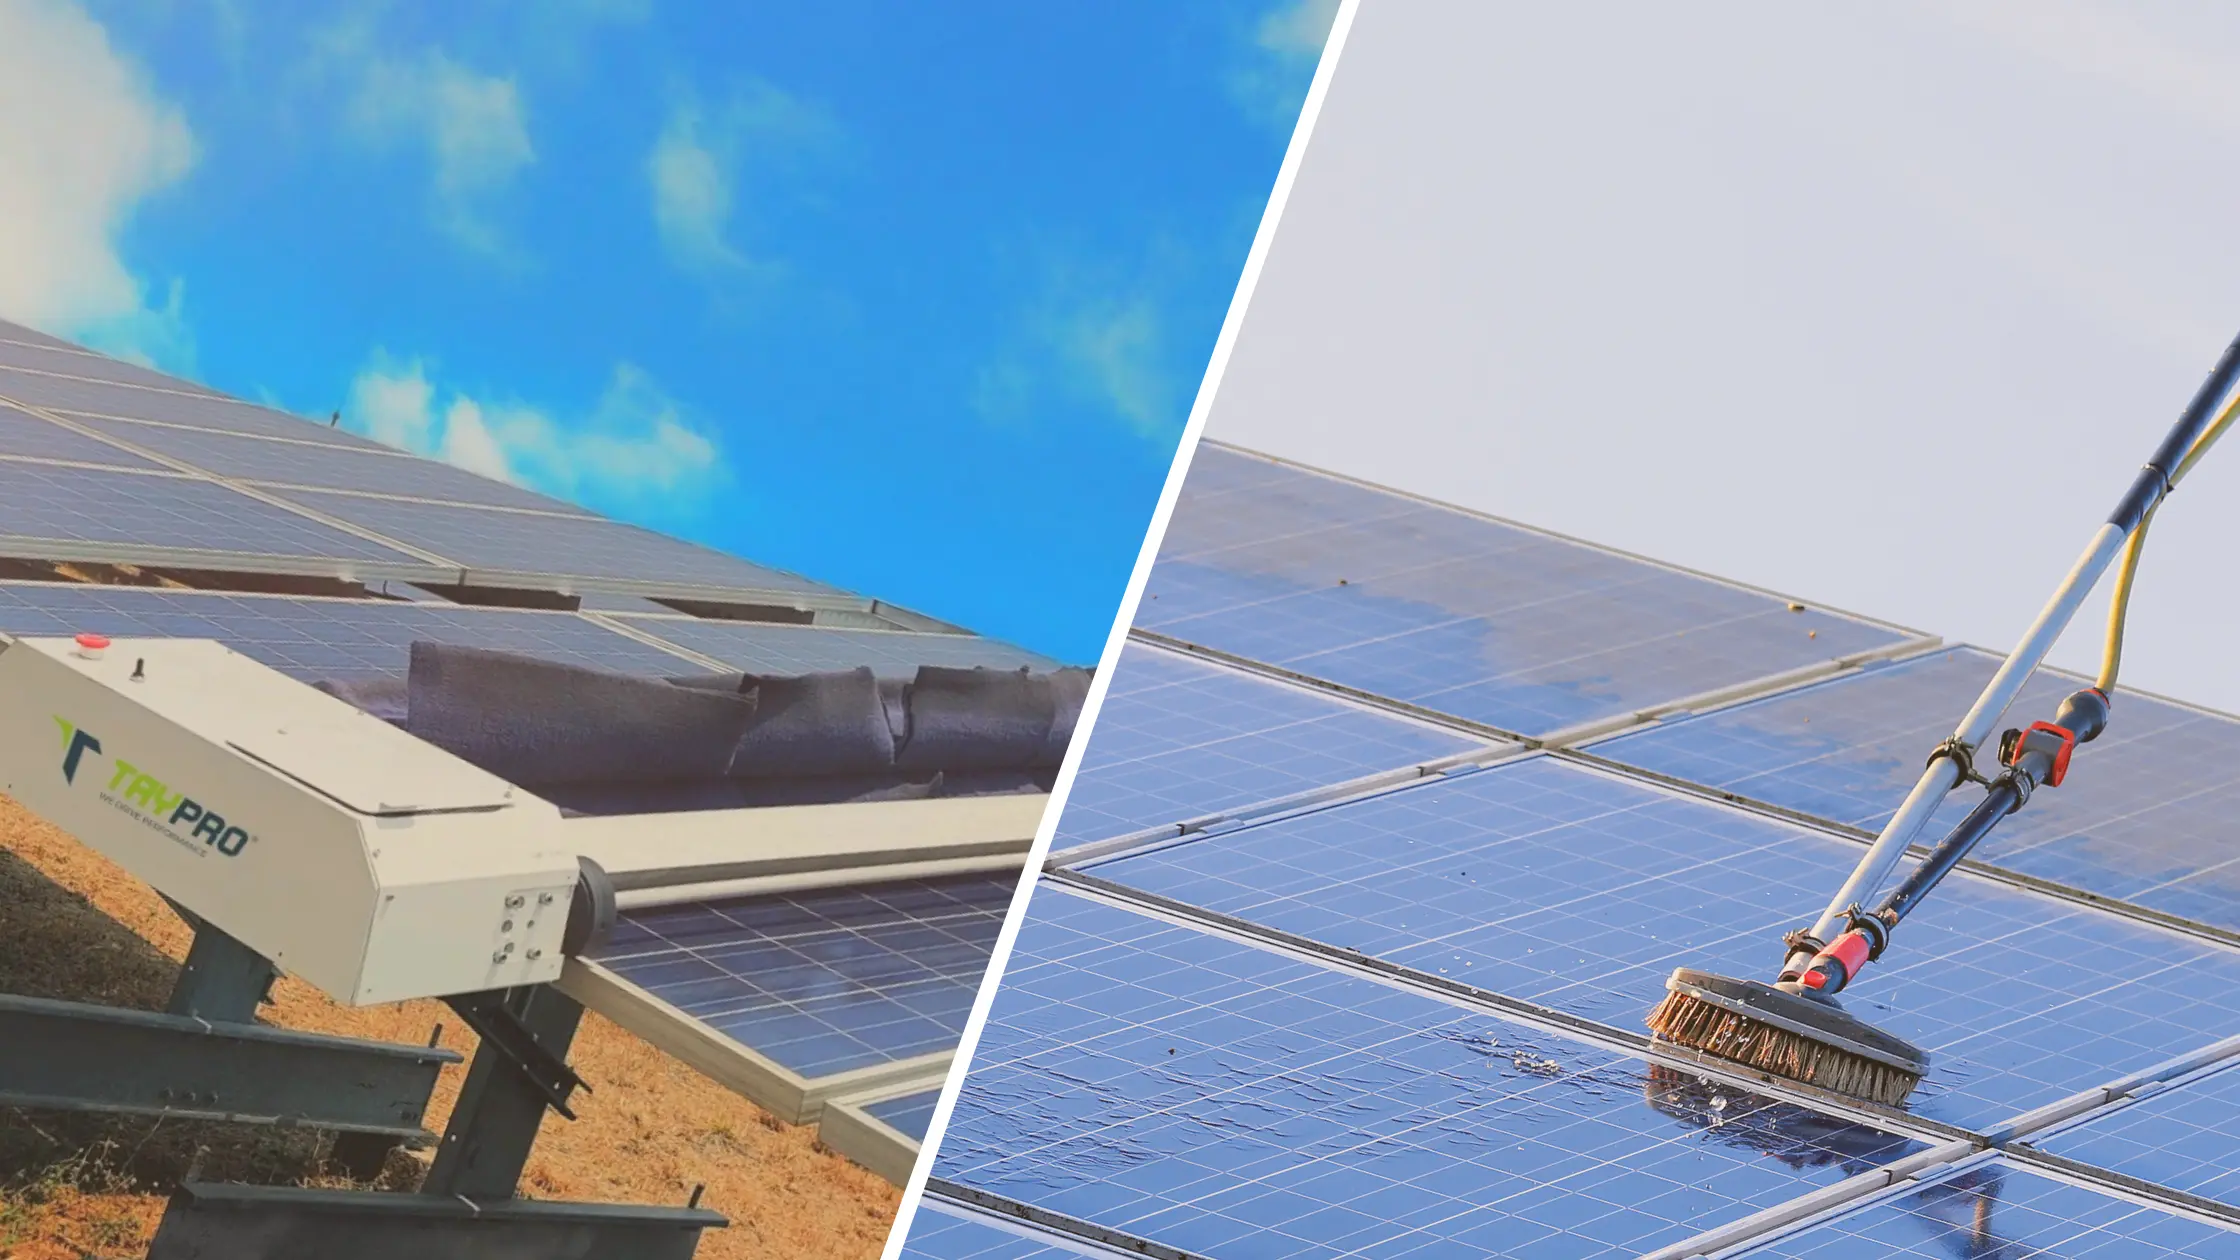
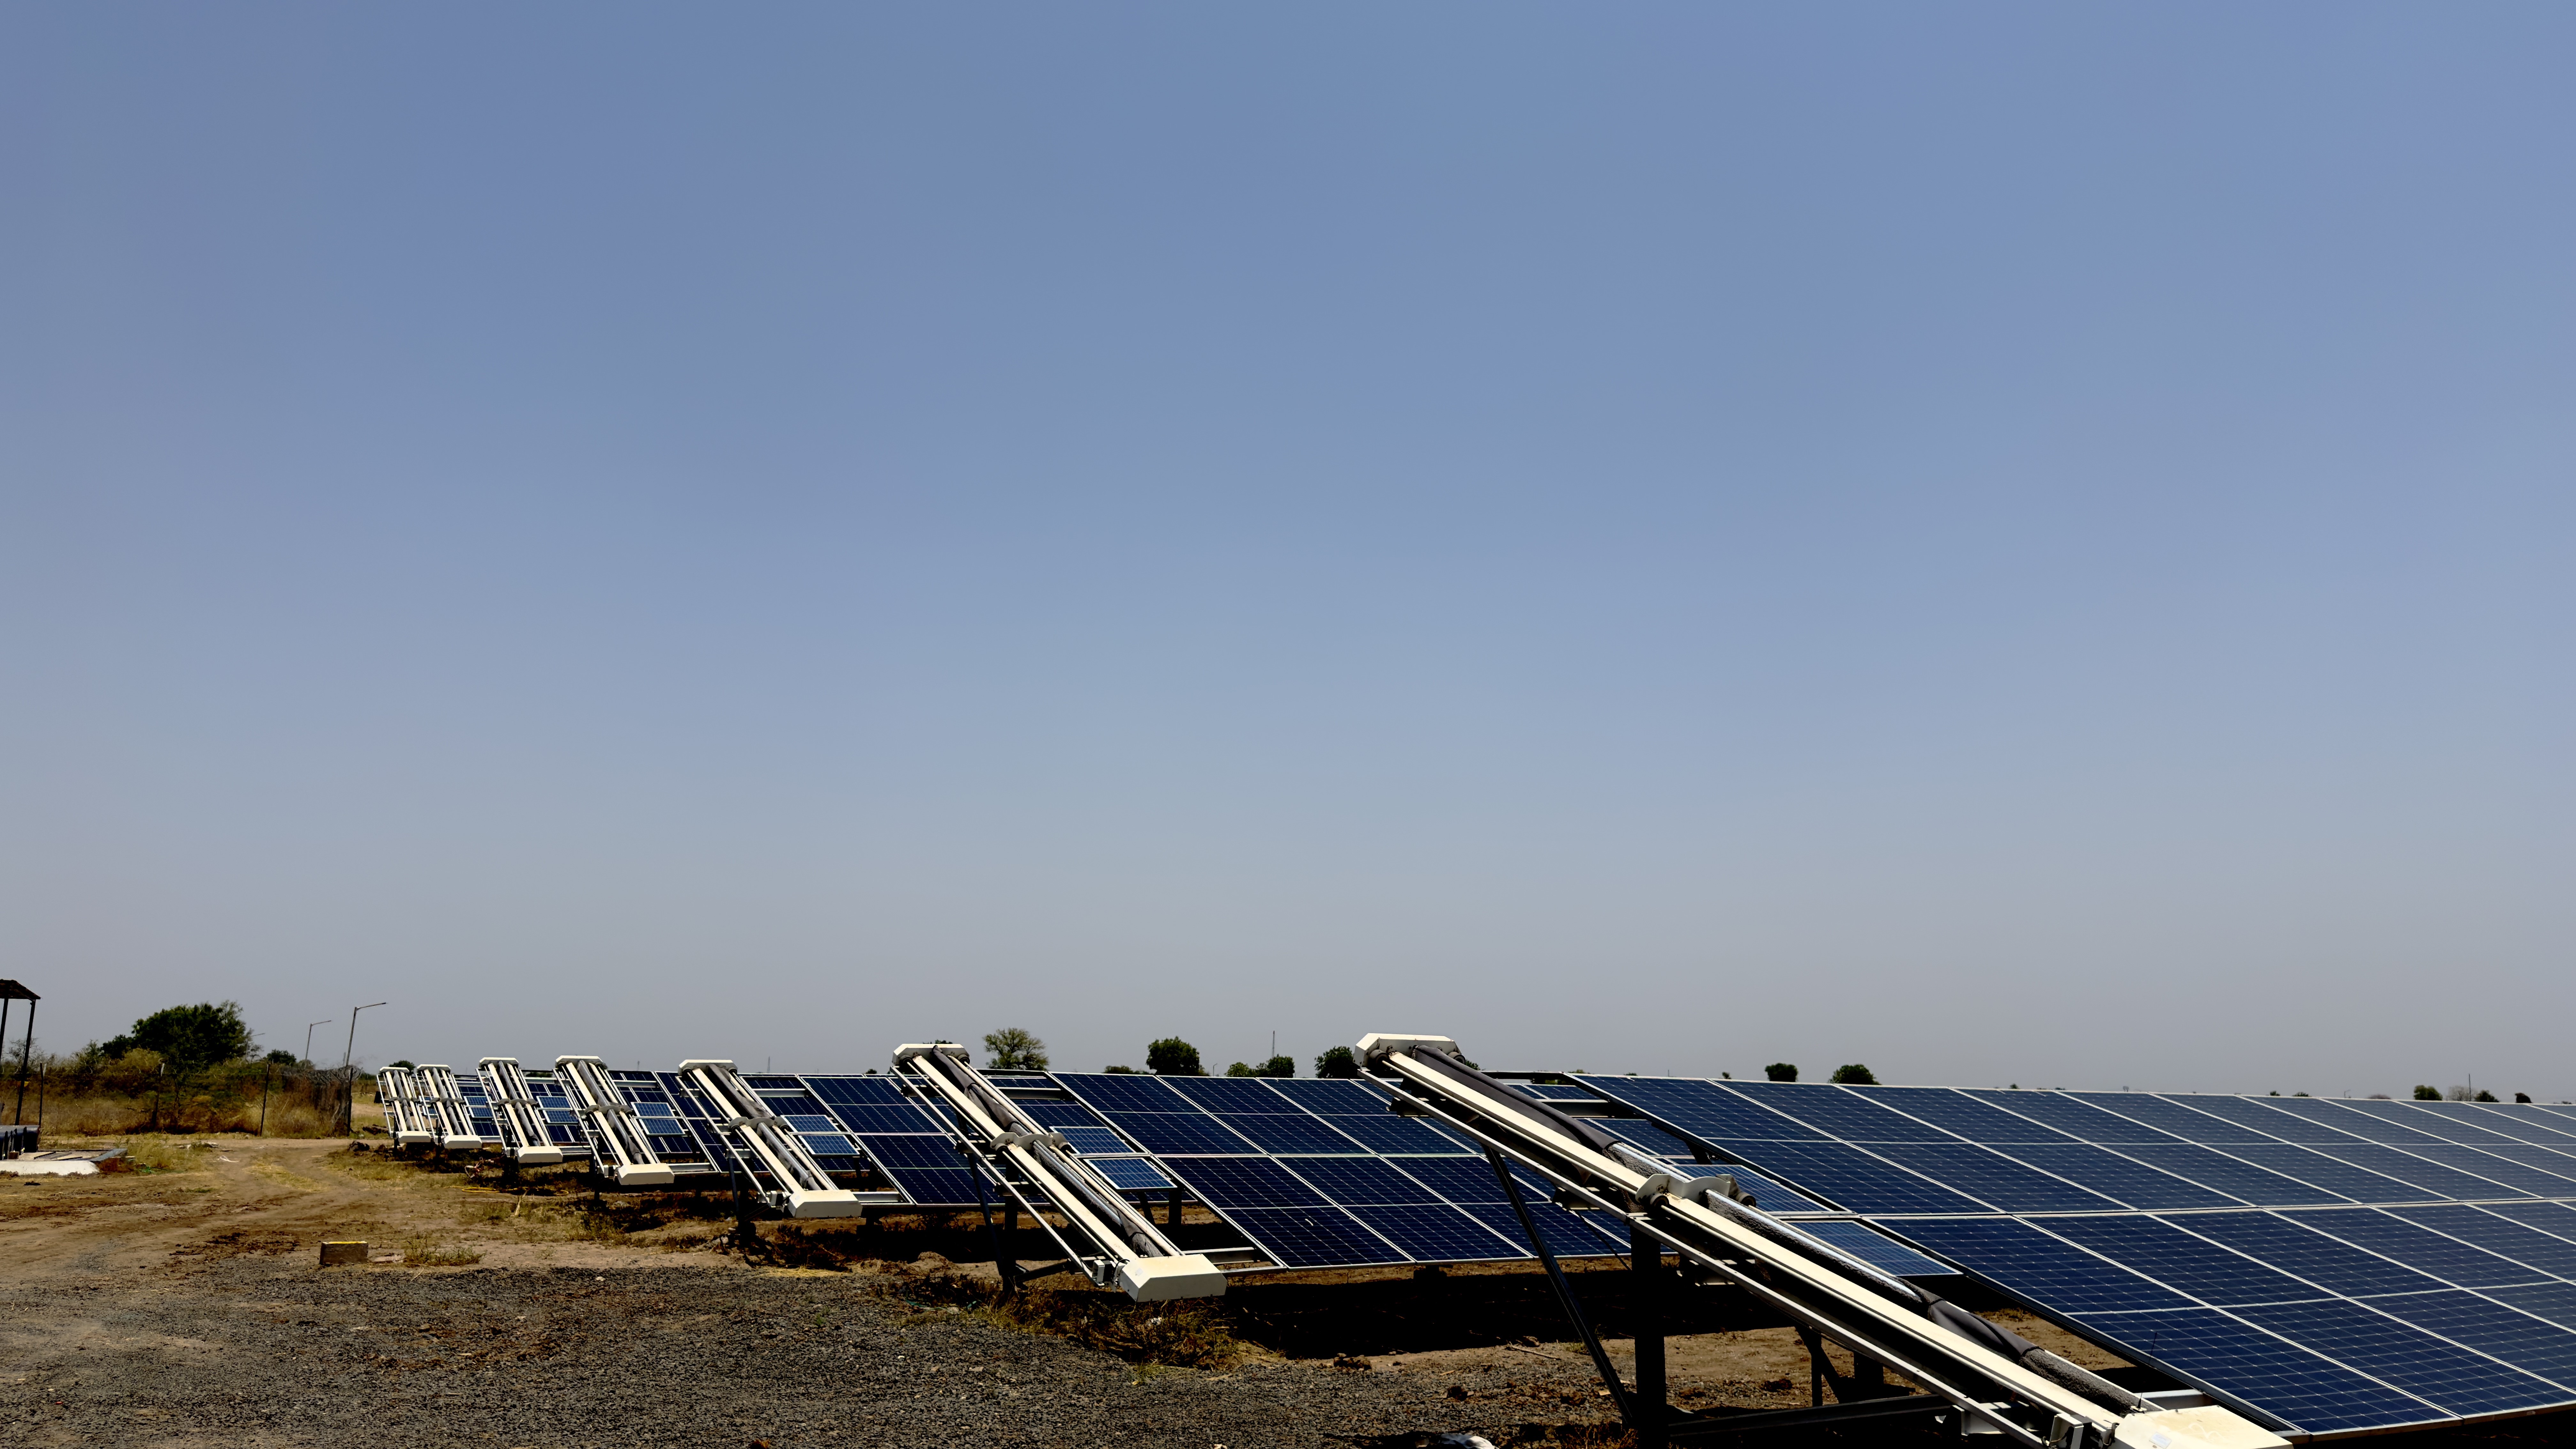
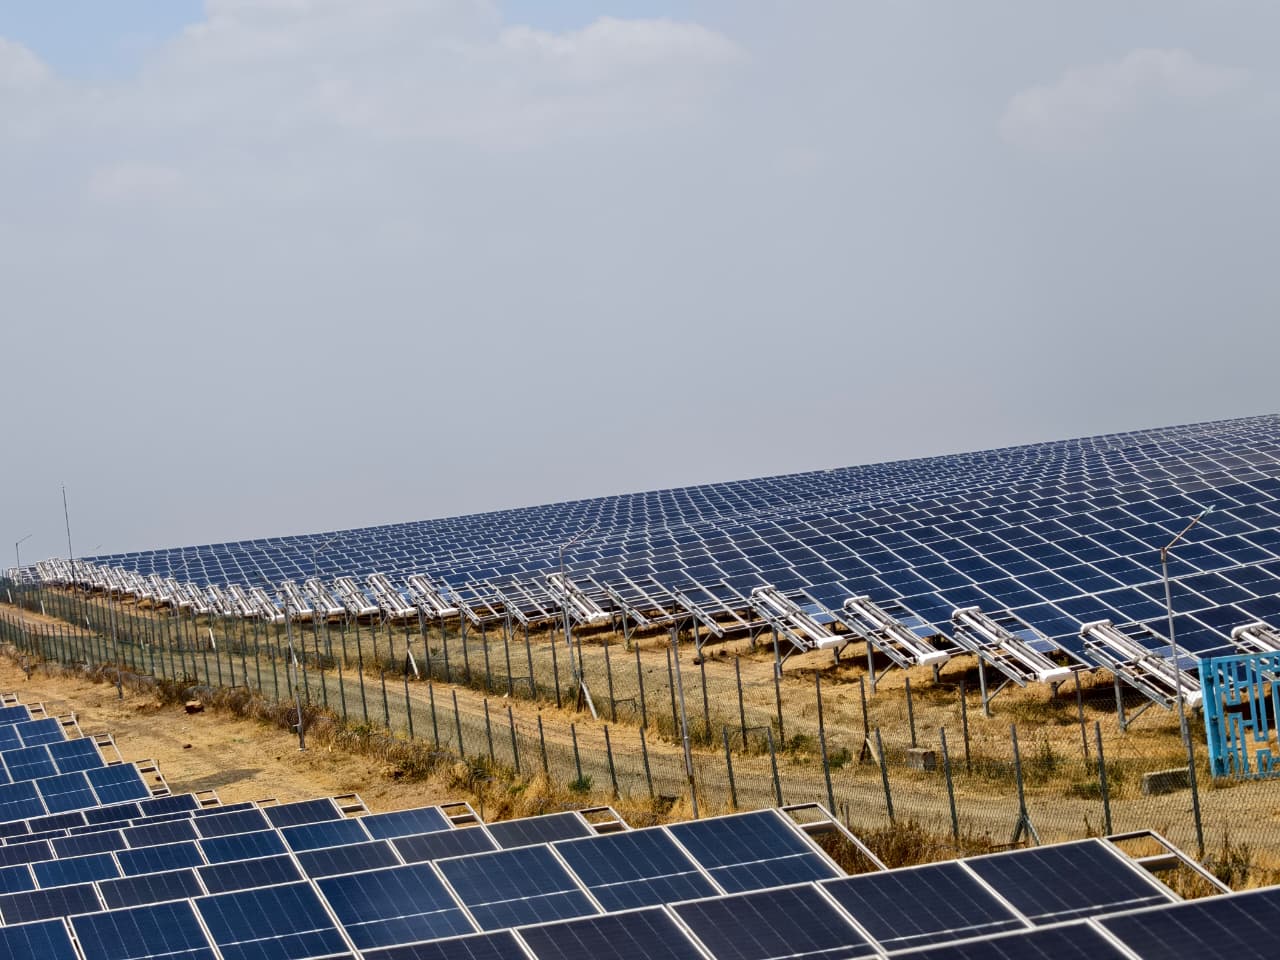
For plant managers operating 50 MW+ portfolios, the goal is to shift from reactive manual washing to a predictive O&M model. Drones provide the granular data needed to prioritize cleaning zones, preventing unnecessary robot deployments in areas with minimal soiling. This synergy protects module coatings, as robotic systems like GLYDE use non-abrasive methods to restore output without the water-related risks associated with traditional manual cleaning. By using diagnostic insights to schedule autonomous cleaning, plants can optimize their Performance Ratio (PR) while significantly reducing the labor costs and water consumption typically tied to utility-scale asset maintenance.
How does drone based soiling inspection vs ground cleaning robots impact your O&M workflow?
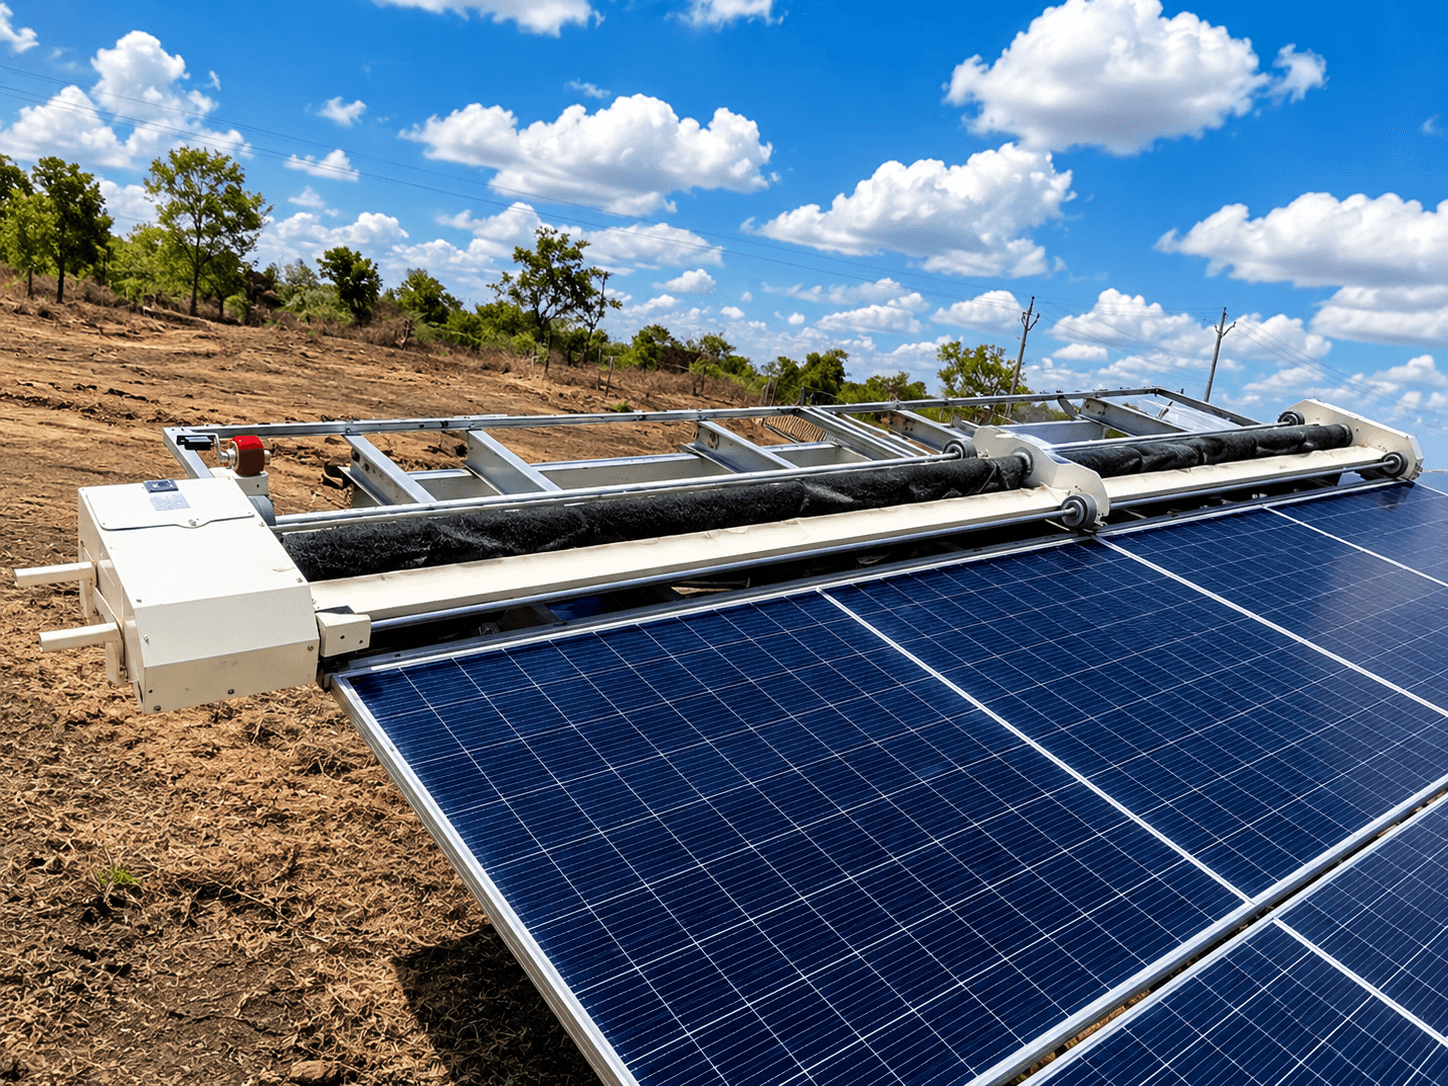
Integrating drone based soiling inspection with ground cleaning robots moves your plant from a calendar-based cleaning program to a demand-driven intervention strategy. In large-scale sites, this transition allows O&M teams to allocate robots only where data confirms high soiling severity, effectively protecting module coatings and reducing the wear associated with unnecessary cycles. By mapping the plant into high-loss zones, asset owners ensure that autonomous cleaning assets like GLYDE or NYUMA operate only when the cost of inaction outweighs the cost of the intervention. Our recent insights on Green AI and robotic innovation highlight how these workflows are revolutionizing the Indian market.
The impact on your workflow is measurable through two primary channels:
- Precision Targeting: Drone aerial thermography identifies specific row-level anomalies, preventing crews from cleaning rows that are already clean, which saves power and reduces mechanical strain on the robot fleet.
- Data-Driven Scheduling: By integrating inspection imagery into the NECTYR monitoring platform, managers can trigger automated cleaning only after specific loss thresholds are breached, optimizing the performance ratio (PR) and maximizing energy yield per block.
Without this diagnostic layer, cleaning cycles often remain static, leading to either under-cleaning in high-soiling pockets of the plant or over-cleaning in wind-swept areas. For utility operators in regions like Rajasthan or Gujarat, where dust accumulation varies significantly due to local topography and agriculture, this dual-tech approach mitigates the risk of downtime while ensuring consistent output across the entire portfolio. By treating inspection as a prerequisite to robotic deployment, plants achieve a more sustainable O&M model that balances asset longevity with aggressive yield recovery goals. Understanding the nuanced impact of Performance Ratio calculations is key to validating these gains.
Step-by-step process for integrating aerial diagnostics with robotic cleaning
For a 50 MW+ utility plant in India, the integration of drone data with robotic cleaning must follow a structured pipeline to avoid operational bloat and ensure that intervention is always tied to tangible ROI. The goal is to move from manual schedules to dynamic, data-triggered deployment.
- Step 1: Baseline Mapping and Segmentation. Conduct an initial drone flight to map the plant into performance blocks. Use thermal imagery to identify recurring soiling hot spots, particularly those near dusty access roads or agricultural boundaries.
- Step 2: Automated Threshold Definition. Establish trigger points in your NECTYR platform. In arid regions like Rajasthan, an industry-typical threshold of 0.5% daily output loss serves as the trigger for a robotic cleaning cycle.
- Step 3: Intelligence-Led Robot Deployment. Instead of cleaning the entire 50 MW facility, deploy robots only to the zones flagged by the most recent drone scan. This saves battery life and extends the service life of cleaning components like brushes and microfiber.
- Step 4: PR Validation. Post-cleaning, perform a secondary drone inspection on a sample row. This verifies the efficacy of the GLYDE or NYUMA cleaning cycle and updates your site-specific soiling recovery model.
- Step 5: Feedback Loop Integration. Use the data gathered during the cleaning cycle to adjust future inspection frequencies. If a block shows consistent low soiling, push the next drone scan back by 15 days to lower O&M overhead.
By treating drone data as the upstream input for your robot fleet, you avoid the common trap of over-cleaning. This process directly correlates to the Performance Ratio (PR) stability that utility-scale IPPs require to meet PPA guarantees while managing costs in high-soiling climates.
Which cleaning approach fits utility-scale operations in India?
For plant managers, the choice is rarely between drone-based soiling inspection and ground cleaning robots. Instead, the strategic decision lies in how to integrate these two technologies into a single, cohesive workflow. Drones act as the diagnostic layer, providing high-level visibility, while robots act as the execution layer, performing the physical work. In the Indian context, specifically for utility-scale plants in arid zones, relying on only one of these tools often leads to operational inefficiencies. When selecting an approach, managers must also evaluate Opex vs Capex maintenance models to ensure fiscal sustainability.
A purely manual approach or a "blind" robotic cleaning schedule (cleaning based on time rather than actual need) is no longer viable for large-scale assets. For a 100 MW plant, the cost of over-cleaning due to inaccurate scheduling can be as damaging to the bottom line as the soiling itself. To make an informed decision, consider the following technical comparison of the three primary approaches used in the industry today:
| Approach | Primary Objective | Water Intensity | Scalability (MW) | Operational Logic |
|---|---|---|---|---|
| Drone-Based Inspection | Diagnostic (Identify Soiling) | Zero | 50 MW - 1 GW+ | Data-driven mapping and anomaly detection. |
| Ground Cleaning Robots | Remediation (Active Cleaning) | Zero (Waterless) | 10 MW - 500 MW+ | Targeted, high-efficiency cleaning based on data. |
| Manual Wet Cleaning | Remediation (Active Cleaning) | High | < 10 MW | Labor-intensive, scheduled by calendar. |
The hybrid advantage for Indian IPPs
In states like Rajasthan and Gujarat, where water scarcity is a critical operational risk, the shift toward waterless cleaning is mandatory. However, simply replacing manual labor with robots is only half the solution. Without drone-based intelligence, robots may be deployed to clean entire blocks when only specific rows require intervention, wasting battery life and increasing mechanical wear.
The most effective approach for utility-scale operations is a hybrid model: use drone thermography to identify specific high-loss blocks and then deploy a robotic fleet, such as the GLYDE or NYUMA, to clean only those identified zones. This integration minimizes the cost per MWh by ensuring that every cleaning cycle is tied to a measurable recovery in the Performance Ratio (PR). This precision is what allows operators to move from a reactive O&M mindset to a predictive, high-yield management model.
Technical thresholds: When to deploy inspection vs intervention
In utility-scale O&M, the most common error is either infrequent cleaning that results in permanent soiling accumulation or excessive intervention that leads to unnecessary wear on your robot fleet. For a 50 MW+ plant, data-backed triggers are essential to keep costs within the projected 10–15% OPEX threshold. Use drone-based soiling inspection when your site Performance Ratio (PR) dips by 1.5% to 2% over a rolling 14-day window. If the drone survey confirms a uniform soiling layer across an entire block exceeding 3%, immediate robotic intervention is required to prevent cementation of dust, which makes future cleaning more energy-intensive and abrasive.
For localized issues, such as bird droppings or vegetation-induced shading near plant boundaries, deploy your robotic fleet only to the specific affected strings. At the 100 MW+ scale, managing your robot fleet via an integrated platform like NECTYR allows you to trigger these row-specific cleaning cycles automatically based on the drone report. This precision ensures you avoid running robots on clean rows, which protects your equipment life and reduces unnecessary charging cycles. Consider the following thresholds for standard Indian climate zones:
- Proactive Scan Frequency: Once every 15–20 days during the peak dust months (March to June).
- Threshold for Full Block Cleaning: > 3% soiling loss identified via thermography.
- Threshold for Targeted Spot Cleaning: < 3% loss but with high-intensity hotspots or bird-dropping density.
- Dryness Constraint: Do not initiate robotic cleaning during or immediately after light rainfall to avoid mud streaking, which can further reduce panel transmittance.
By strictly adhering to these thresholds, you move from calendar-based maintenance to a data-driven model that protects your asset longevity while maintaining a high Performance Ratio. In arid states like Rajasthan, where soiling losses can reach 30% without intervention, these specific triggers are the difference between meeting PPA targets and underperforming on energy yield.
Operational trade-offs for 50MW+ utility sites
Managing utility-scale assets beyond 50 MW introduces significant logistical hurdles that manual washing teams struggle to overcome. In Indian regions like Rajasthan or Tamil Nadu, a manual crew requires days to cover a single block, whereas a robotic fleet can perform the same duty in a few hours without using a single litre of water. The primary operational trade-off for plant managers is the upfront requirement for row-end infrastructure, such as dedicated rail tracks or charging points, compared to the ongoing, variable cost of labour and water logistics associated with traditional cleaning.
For large-scale sites, you must weigh the reliability of autonomous fleets against the need for local site support. Utilizing an integrated platform like NECTYR provides the visibility to track fleet health, battery cycles, and cleaning status in real time. This digital oversight is essential to avoid common failure points that arise when robots are left unmonitored for weeks. By shifting to a hybrid model where drones identify hot spots and autonomous robots handle the execution, you reduce the physical footprint of O&M teams within the energized zones of the solar plant, significantly improving site safety.
The following table outlines the operational differences between manual and robotic maintenance at scale:
| Criterion | Manual Washing | Robotic (Dry) |
|---|---|---|
| Water Usage | High (15,000+ litres/MW) | Negligible |
| Safety Risk | High (Manual labour in field) | Low (Autonomous operation) |
| Cleaning Consistency | Variable (Human factor) | High (Programmable cycles) |
| PR Recovery | Delayed | Immediate/Data-Driven |
| Operational Cost | High Variable OPEX | High CAPEX/Low Opex |
At the 50 MW+ threshold, the ROI on robotic integration is typically achieved within 24 to 36 months, depending on the site-specific soiling rates and local water costs. By prioritizing sites with high dust accumulation and clear access paths, asset owners can optimize their fleet deployment to ensure the fastest payback while protecting module warranties from improper cleaning methods. For further insight on financial planning, you can use our ROI price calculator to model your specific fleet requirements.
What plant managers should do next
For operations teams managing utility-scale assets in India, the transition from manual washing to a data-driven hybrid model is the most effective way to safeguard your PR. You should not attempt a full-site overhaul without validating performance gains on a single block. Follow these steps to optimize your strategy:
- Phase 1: Pilot Deployment: Select one 5–10 MW block with consistent soiling history. Deploy drone-based inspection to baseline your current soiling loss vs. cleaning frequency requirements.
- Phase 2: Data Correlation: Integrate inspection outputs into your NECTYR dashboard. Correlate drone findings with inverter-level PR drops to define your site-specific threshold for autonomous intervention.
- Phase 3: Scaling Strategy: Use your pilot results to model the ROI for the remaining fleet. Prioritize rows with the highest soiling impact to maximize generation recovery and ensure the fastest payback on equipment.
- Phase 4: Operational Integration: Shift your site staff from cleaning duty to monitoring and maintenance of the robotic fleet. Focus on ensuring charging infrastructure and row access are maintained for optimal robot uptime.
By moving to a systematic deployment, you mitigate the variability of manual labour while providing your team with actionable insights. For further assistance in planning your fleet deployment, explore our robot price guide or contact our technical team for an on-site feasibility assessment. Adopting these technologies now prepares your 50 MW+ plant to meet the rigorous performance demands of future power purchase agreements.
Sources and further reading
Frequently asked questions
Choosing between drone-based soiling inspection and ground-based cleaning robots involves balancing diagnostic precision with automated operational throughput. Aerial inspections provide critical visibility into performance gaps, while robotic cleaning systems deliver the repeatable, consistent intervention required to maintain yield at utility scales.
For large-scale plants, drone-based inspections should be conducted whenever data is needed to prioritize maintenance zones, particularly when daily soiling accumulation is suspected to exceed 0.5 percent. This frequency allows for precise scheduling of robotic cleaning interventions, preventing unnecessary wear on panels and optimizing labor allocation.
Yes. Integrating drone data into your O&M workflow allows you to identify high-loss zones and trigger autonomous cleaning robots specifically in those areas. This approach moves your operations from reactive, manual washing to a predictive model that targets specific segments of the plant, significantly reducing water usage by up to 90 percent.
Operational budgets in India typically allocate 1 to 2 percent of annual revenue for advanced O&M technology. While robotic systems require an initial investment, they provide a long-term cost advantage by replacing labor-intensive manual washing, protecting module coatings through non-abrasive methods, and reducing water consumption by 90 percent.