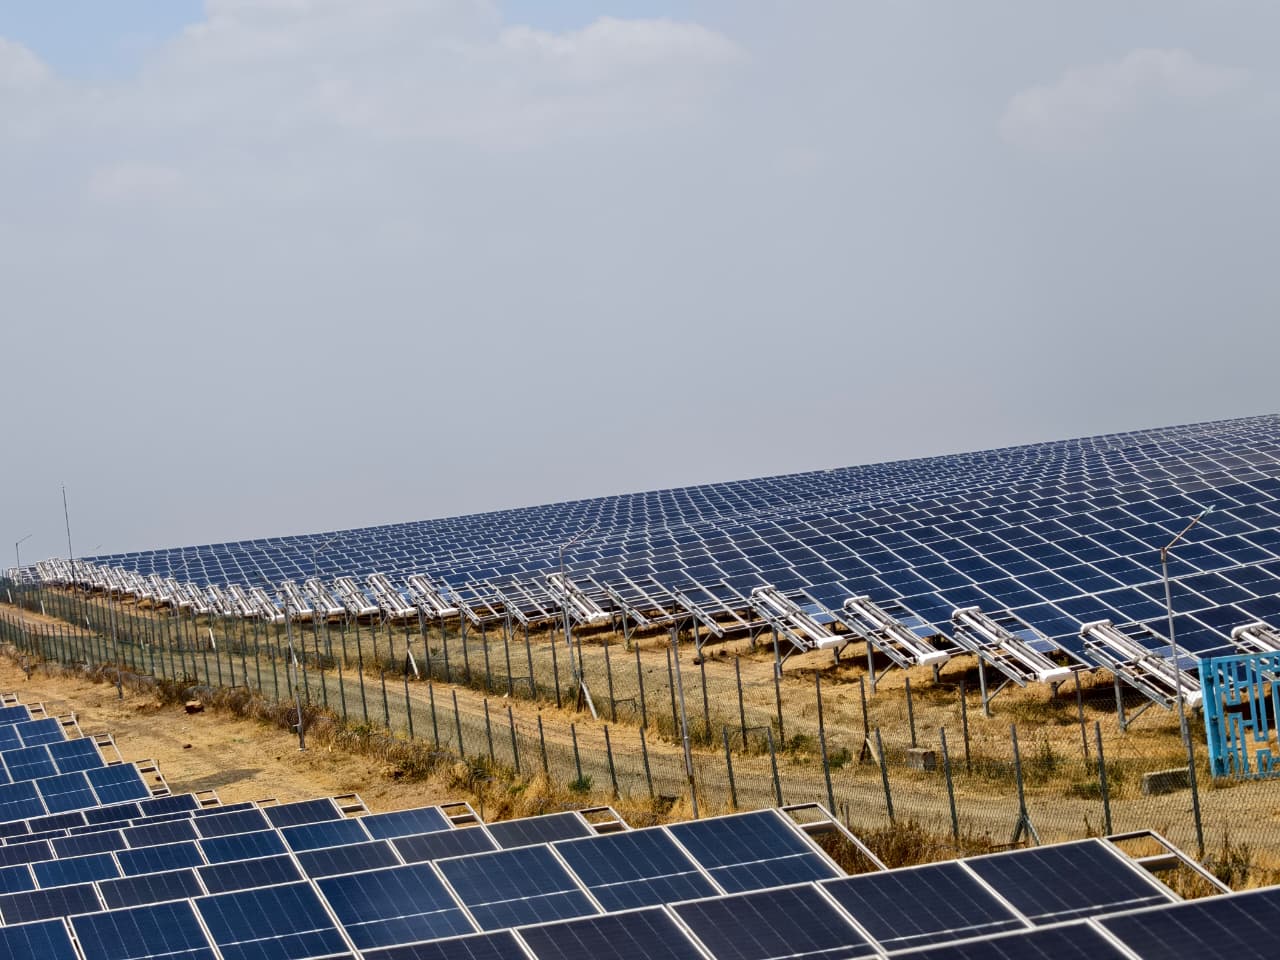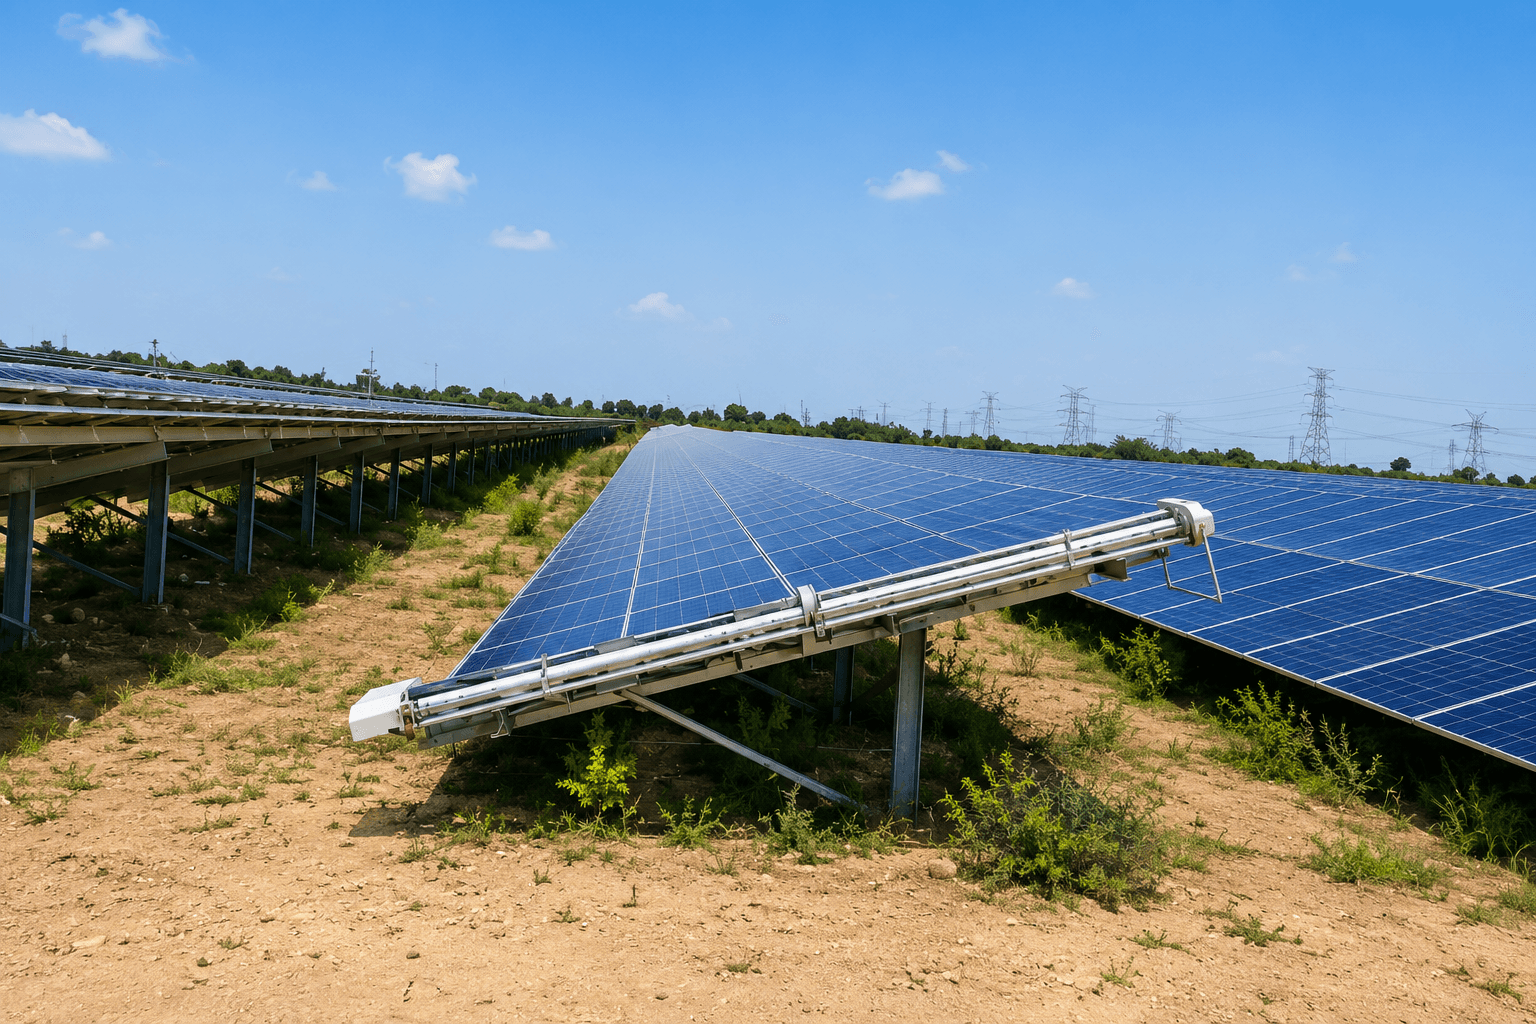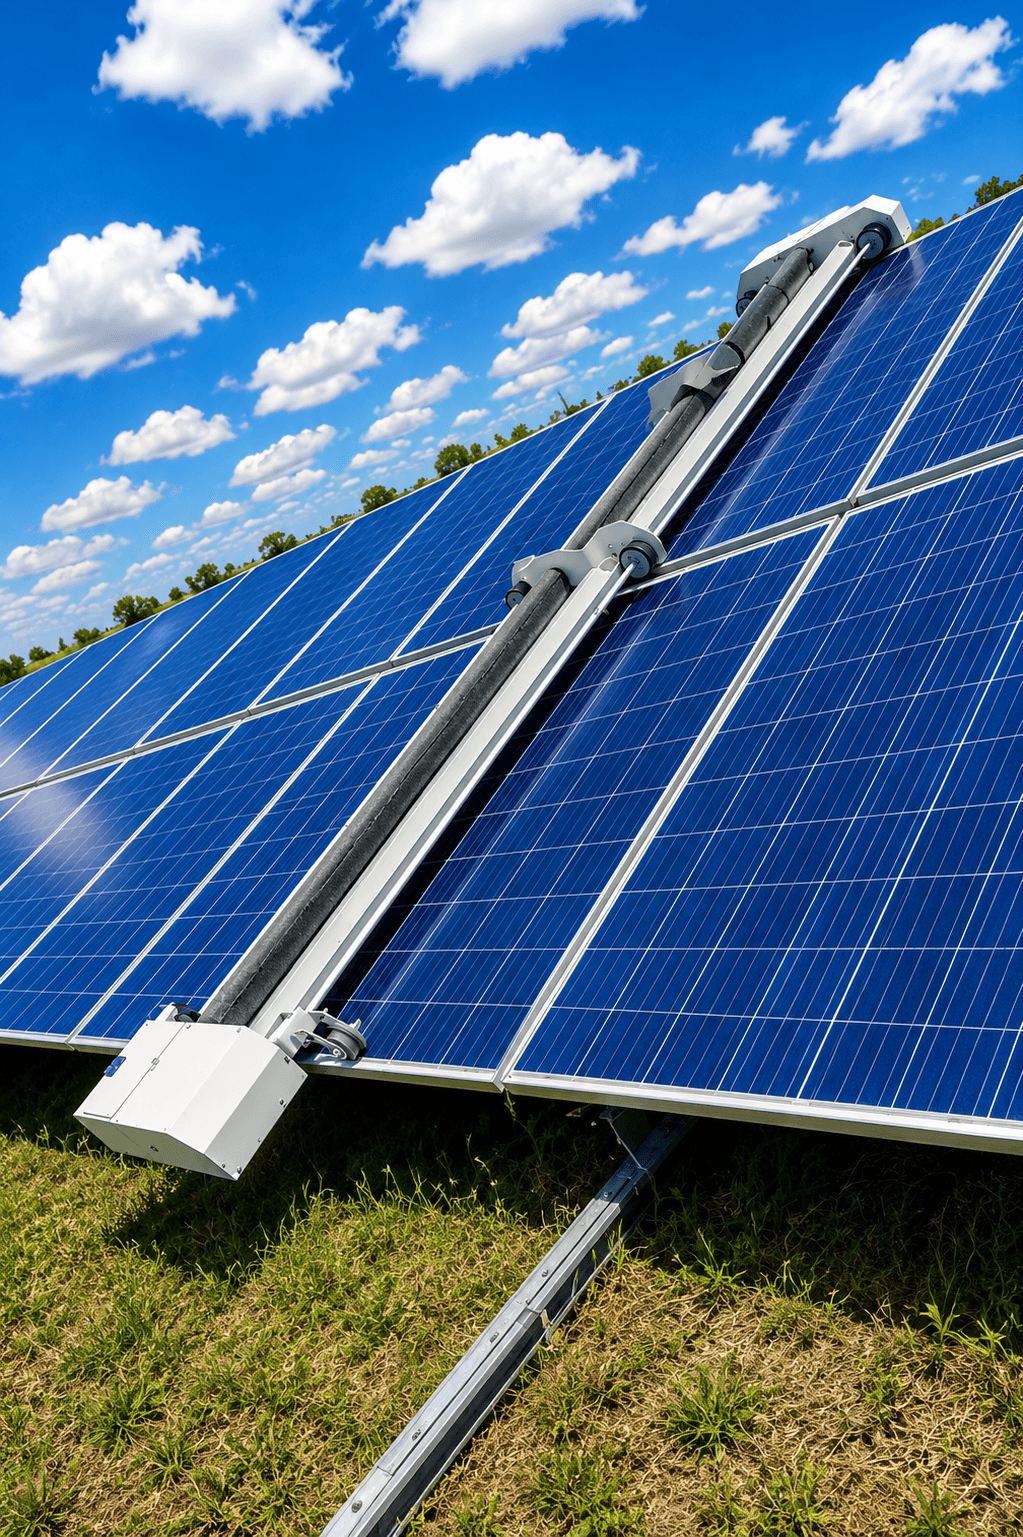
Selecting the right asset management software is a high-stakes decision for O&M leads. These leads manage utility-scale solar portfolios in India. Soiling losses cause 10% to 30% of yield drops in arid regions. Your software layer handles more than just reporting. It drives operational efficiency and protects your revenue.
The right platform connects field-level hardware to executive performance metrics. This ensures you optimize every megawatt against local environmental challenges.
Quick answer
- Utility-scale plants in India lose 10–30% of yield due to dust. Software must feature real-time Performance Ratio (PR) monitoring.
- Integration requires robust APIs. These must connect to existing inverter and weather station SCADA systems.
- Platforms should provide automated cleaning triggers. These should be based on daily soiling rates of 0.1% to 0.5%.
- MW-scale assets require monthly capacity updates. You must also generate grid-compliance reports per CEA standards.
O&M leads must transition toward digitized management. This shift moves teams from reactive site visits to predictive maintenance. Modern software must harmonize telemetry from inverters and meteorological stations. It also needs SCADA integration cleaning robot fleets. Managers can use a centralized dashboard to turn raw data into maintenance work orders. This directly counteracts regional dust patterns. This data-first approach supports requirements for green bonds and ESG reporting. It keeps plant performance transparent for investors while maximizing generation.
What defines asset management software for utility-scale solar?
Asset management software is a digital nerve center for portfolios over 50 MW. It goes beyond basic SCADA monitoring. SCADA tracks electrical telemetry like voltage and current. True asset management software adds context to that data.
It correlates electrical data with environmental logs and financial targets. This provides a clear view of plant health. A robust platform prioritizes three data inputs for Indian operators:
- Meteorological Correlation: The software must use local weather data to calculate expected PR. This isolates soiling loss from module degradation.
- Operational Maintenance Logging: Log every cleaning cycle, inverter reset, and tracker adjustment. This creates an audit trail for CEA standards and warranty claims.
- Predictive Alerting: Move past reactive alarms. Use thresholds, such as a 2% generation drop over 48 hours, to trigger urgent cleaning needs.
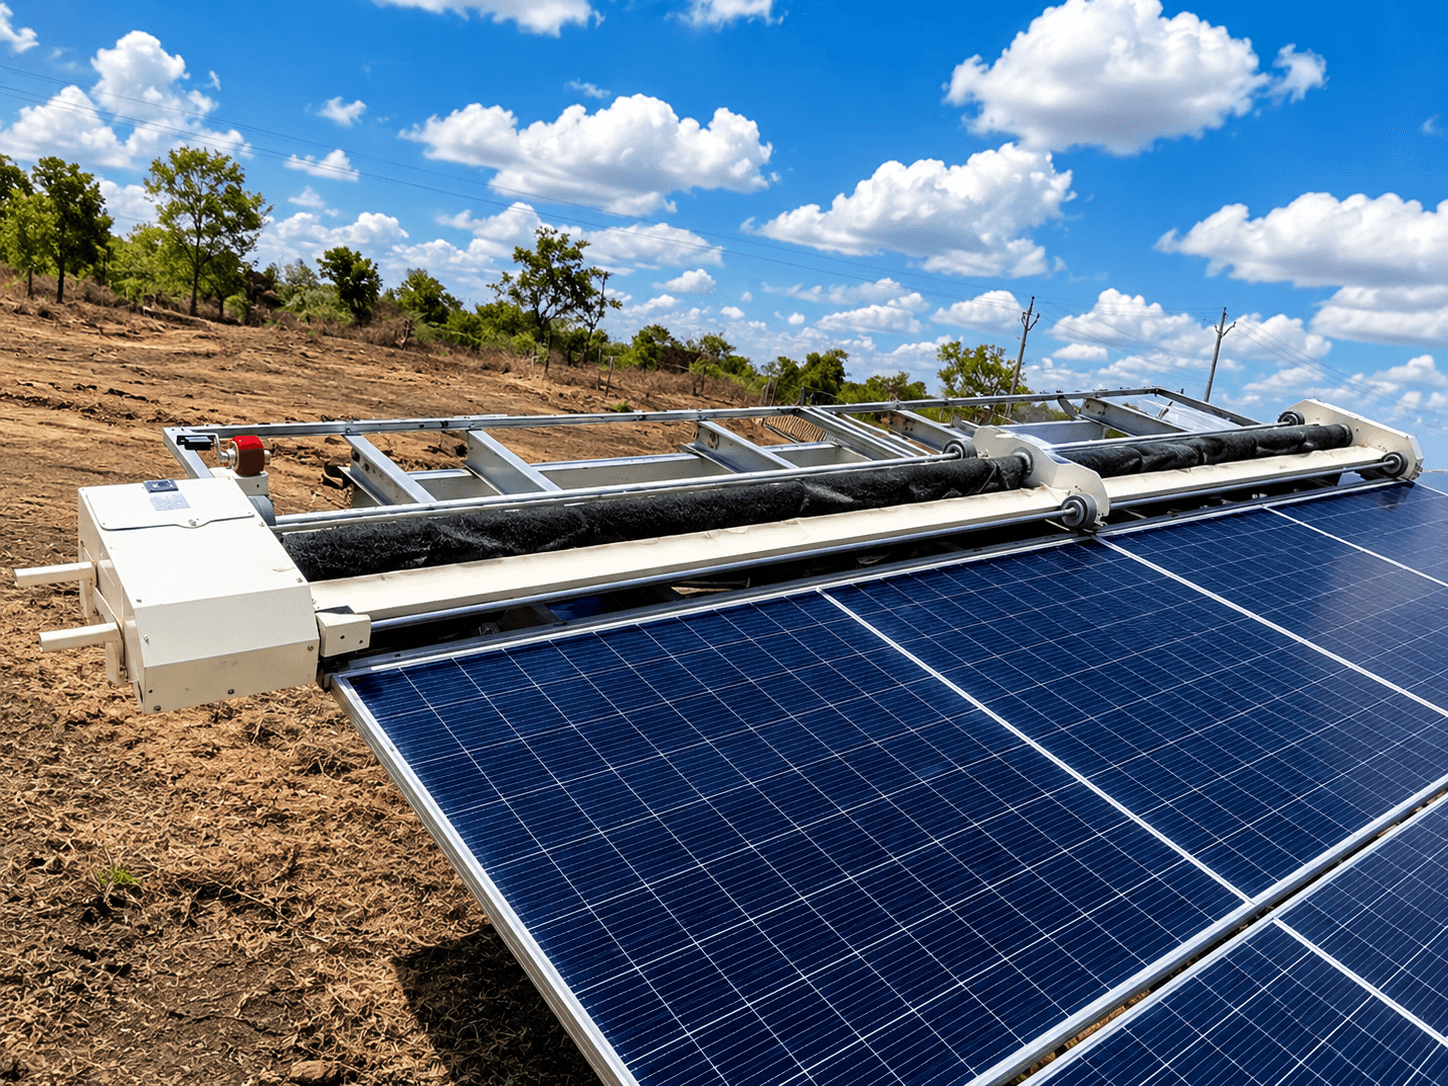
Look for platforms that integrate with your SCADA integration cleaning robot fleets. The software should verify that a robot finished a row-cleaning pass. It does this by checking for a boost in string current. This closed-loop verification is essential in regions like Rajasthan or Gujarat. Dust levels there fluctuate by 0.1% to 0.5% daily. The software should replace manual spreadsheets with automated data. This supports green bonds and ESG reporting. O&M leads often lose visibility without this granular link between field activity and plant generation.
How do I choose between software platforms for my plant?
Choose your software based on technical requirements, not just interface style. Indian utility-scale assets require high data interoperability. Your software must handle site-specific environmental variables. Evaluate your needs based on these three pillars:
- Protocol Compatibility: Ensure the software supports common protocols like Modbus TCP/IP. These are standard for most Indian solar inverters and sensors.
- Granularity of Reporting: Choose platforms that distinguish between forced downtime, planned outages, and regional dust patterns.
- Automation Readiness: Evaluate if the platform can send commands to external systems. This includes automated cleaning triggers or field team ticket tools.
Perform a gap analysis of your current manual reporting. If you spend over two days per month on Excel, you need an API-first reporting approach. Ensure the vendor has experience with SCADA integration cleaning robot fleets. This is the most complex layer of solar O&M. A platform that cross-references string current and robot logs provides a superior audit trail. Large utility projects require this technical oversight to prevent missed performance guarantees.
Technical steps for integrating software with existing O&M systems
Integrating asset management software requires a structured approach. Define clear communication protocols like Modbus TCP/IP or OPC UA. These are standard for most Indian grid-connected equipment. Once you identify the hardware, establish an API integration. This pulls real-time string current, voltage, and irradiance data.
Align timestamps for plants using SCADA integration cleaning robot fleets. Inverter data and robot logs often drift, creating reporting errors. Synchronize ingestion at 5-minute or 15-minute intervals. This allows you to correlate cleaning events with energy yield increases. You can then build a performance baseline that reflects local dust conditions.
Implement a validation layer to flag data transmission anomalies. Large sites exceeding 50 MW often face network latency or sensor failure. Set up automated 'heartbeat' signals for all connected controllers. This helps you identify dead zones immediately. This foundation allows for reliable, automated reporting. It supports warranty claims and demonstrates performance to regulators.
Managing soiling losses through software-driven cleaning schedules
Effective soiling management requires a move to dynamic, data-backed cleaning. Software platforms that track solar irradiance allow you to set precise PR thresholds. When PR drops below a set benchmark, the software triggers an alert. In sites with SCADA integration cleaning robot fleets, it can trigger an autonomous cleaning cycle.
Regional soiling rates in India range from 0.1% to 0.5% daily. This can cause a 10–30% cumulative energy loss. Asset management software separates these losses from inverter efficiency or degradation issues. Analyze historical data to identify zones with high dust accumulation. Optimize cleaning schedules to prioritize these areas.
This data justifies your budget for cleaning robot maintenance schedule best practices. Correlate water usage or energy recovered with a rise in PR. This provides quantitative evidence for quarterly reviews. This transforms cleaning from a cost into a strategic tool. It helps operators meet generation guarantees while controlling expenses.
How does plant capacity influence software requirements?
Software requirements change as you scale from 10 MW to 500 MW. Sites under 20 MW prioritize simple dashboards for PR tracking. Once you cross the 50 MW mark, you need complex fleet orchestration. You must handle data from thousands of inverter strings and regional weather stations. Automating incident response becomes the main driver for software selection.
Capacity also changes your need for granular analytics. Large plants often have localized micro-climates. One part of a site may have higher dust levels than another. Your software must support zonated monitoring to assign performance baselines to different blocks. This detail, found in our guide on cleaning robot maintenance schedule best practices, prevents performance drops from being hidden by averages. Plants over 100 MW need platforms that offer automated reporting for grid compliance.
Your software must scale with the number of active assets. This includes all SCADA integration cleaning robot fleets. Large assets generate massive amounts of telemetry. Select platforms with tiered cloud storage or edge processing. This keeps high-resolution logs available for audits without slowing down system performance.
Summary for O&M leads
- Thresholds for complexity: Sites under 20 MW prioritize usability. 50 MW+ sites require automated anomaly detection and API integration.
- Integration priority: Synchronize telemetry between SCADA, inverters, and cleaning fleets to avoid false alerts.
- Zonated management: Large plants need sub-array reporting to target high-soiling zones, which typically see 10–30% yield impacts.
- Scalability: Choose an architecture that supports growth to maintain audit-ready documentation for investors.
What plant managers should do next
- Perform a data audit: Check if your SCADA system provides high-resolution data at 5–15 minute intervals.
- Correlate cleaning with PR: Map cleaning cycles against your PR to ensure your frequency is economically optimal.
- Test integration workflows: Pilot the software's ability to ingest telemetry from third-party cleaning fleets.
- Review compliance readiness: Ensure the software generates monthly reports required by the Central Electricity Authority (CEA).
Sources and further reading
Frequently asked questions
Utility-scale plants in India lose 10–30% of yield due to dust. Software must feature real-time Performance Ratio (PR) monitoring.
By providing data-driven maintenance insights, software reduces the 10–30% yield loss typical in arid Indian regions, effectively maximizing generation and supporting the transparent reporting required for green bonds and ESG compliance.
The software must include advanced analytics that provide automated cleaning triggers based on daily soiling rates of 0.1% to 0.5%, helping to counteract specific regional dust patterns.
Integration requires utilizing robust APIs to harmonize telemetry from diverse hardware, including inverters and weather stations, while ensuring the platform supports monthly capacity updates and grid-compliance reporting per CEA standards.