Summary for plant managers
Solar asset owners in India face a major choice. You can move from manual cleaning to a robotic model. This shifts costs from recurring labor to structured capital investment. The right model depends on your soiling rates and water access. It also depends on your ability to manage manual crews in isolated fields.
This guide compares robotic models against traditional manual services. We look at the automatic solar panel cleaning system and autonomous fleets. By using data to trigger cleaning, you can stop yield losses. This also helps control long-term site costs.
- Typical soiling-induced power loss in Indian arid regions: 15% to 30%
- O&M cleaning expenditure as a percentage of total costs: 15% to 25%
- Potential water savings with dry robotic cleaning: Up to 90%
- Standard annual module degradation: 0.5% to 0.7%
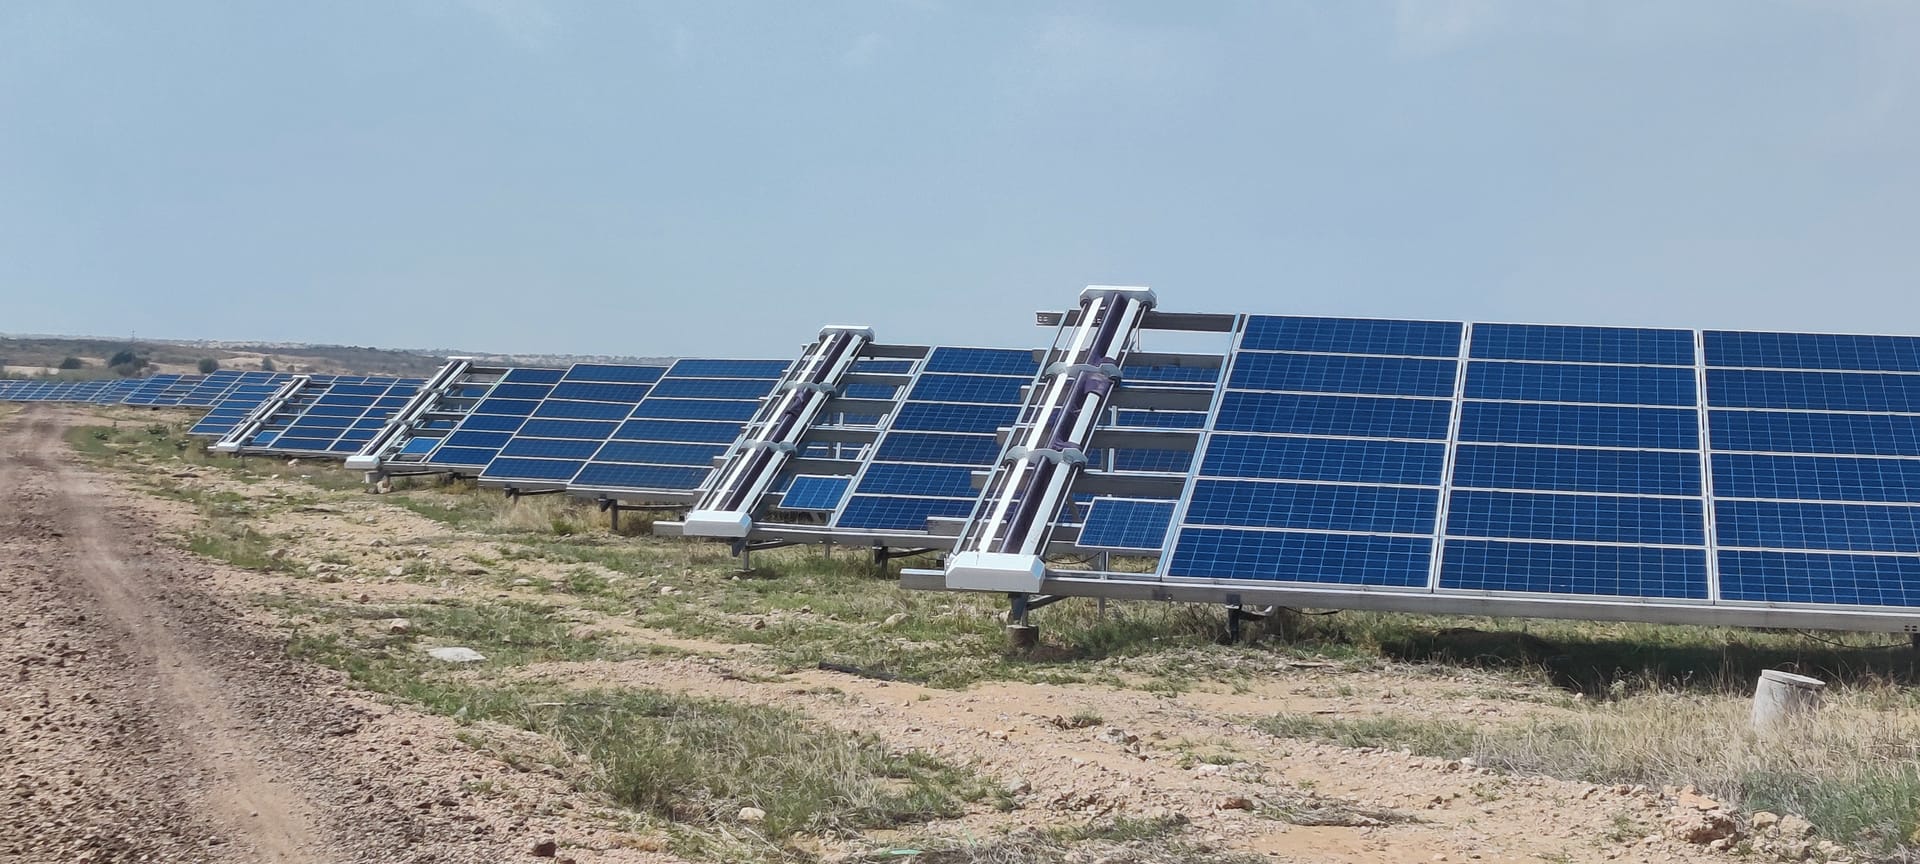
Geography and water access are key factors. In Rajasthan and Gujarat, water is scarce. This makes wet cleaning expensive. Robotic dry cleaning provides a predictable way to recover performance ratio (PR) losses. As we discuss in our guide on managing performance ratio losses, robots recover generation. They also standardize O&M for 5MW+ portfolios. The next sections explain the financial and operational details.
The financial breakdown of manual cleaning staffing models
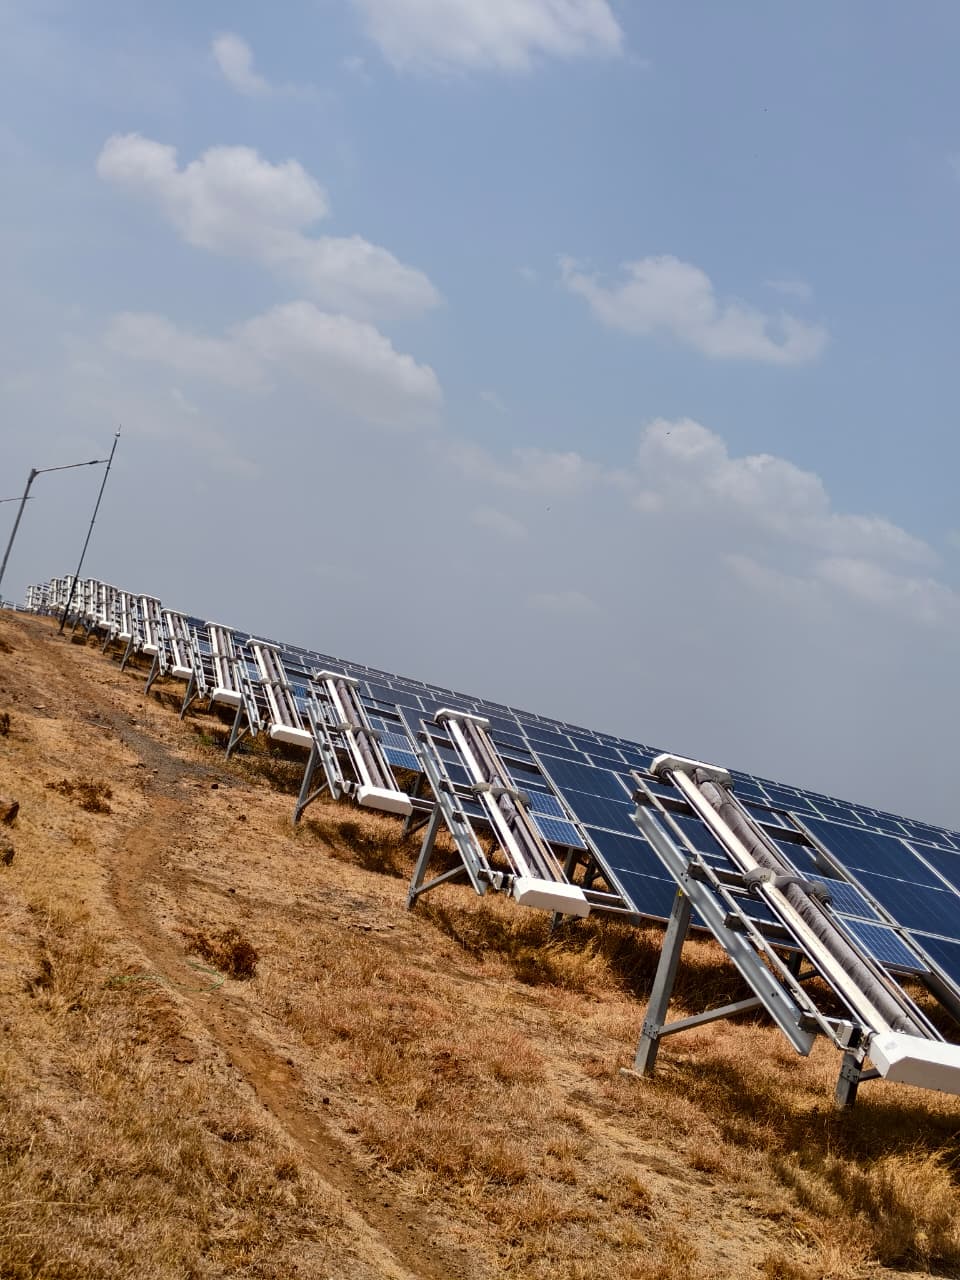
Manual staffing for 5MW+ sites in India uses large labor pools. Site supervisors manage these workers. Upfront costs are low. However, long-term O&M budgets grow quickly. You must pay for seasonal labor, daily wages, and logistics. A 5MW site often needs 10 to 15 workers. This depends on water access and array density.
The financial burden has three main parts:
- Direct Labor Costs: This includes monthly salaries and benefits. These costs change with worker turnover and productivity.
- Operational Logistics: This covers water tankers or DM plant costs. These costs rise with every cleaning cycle.
- Indirect Yield Loss: This is the cost of missed energy. Dust storms or dry spells often slow down manual teams.
Large portfolios face hidden costs. Manual schedules are often inconsistent. Crews often clean easy rows first. This leads to uneven module degradation. This 'performance drag' can lose 2% to 5% of annual revenue. As noted in our guide on managing performance ratio losses, manual cleaning also risks damage. Abrasive brushes can harm delicate anti-reflective coatings.
Transitioning to robotic cleaning: CAPEX vs. OPEX considerations
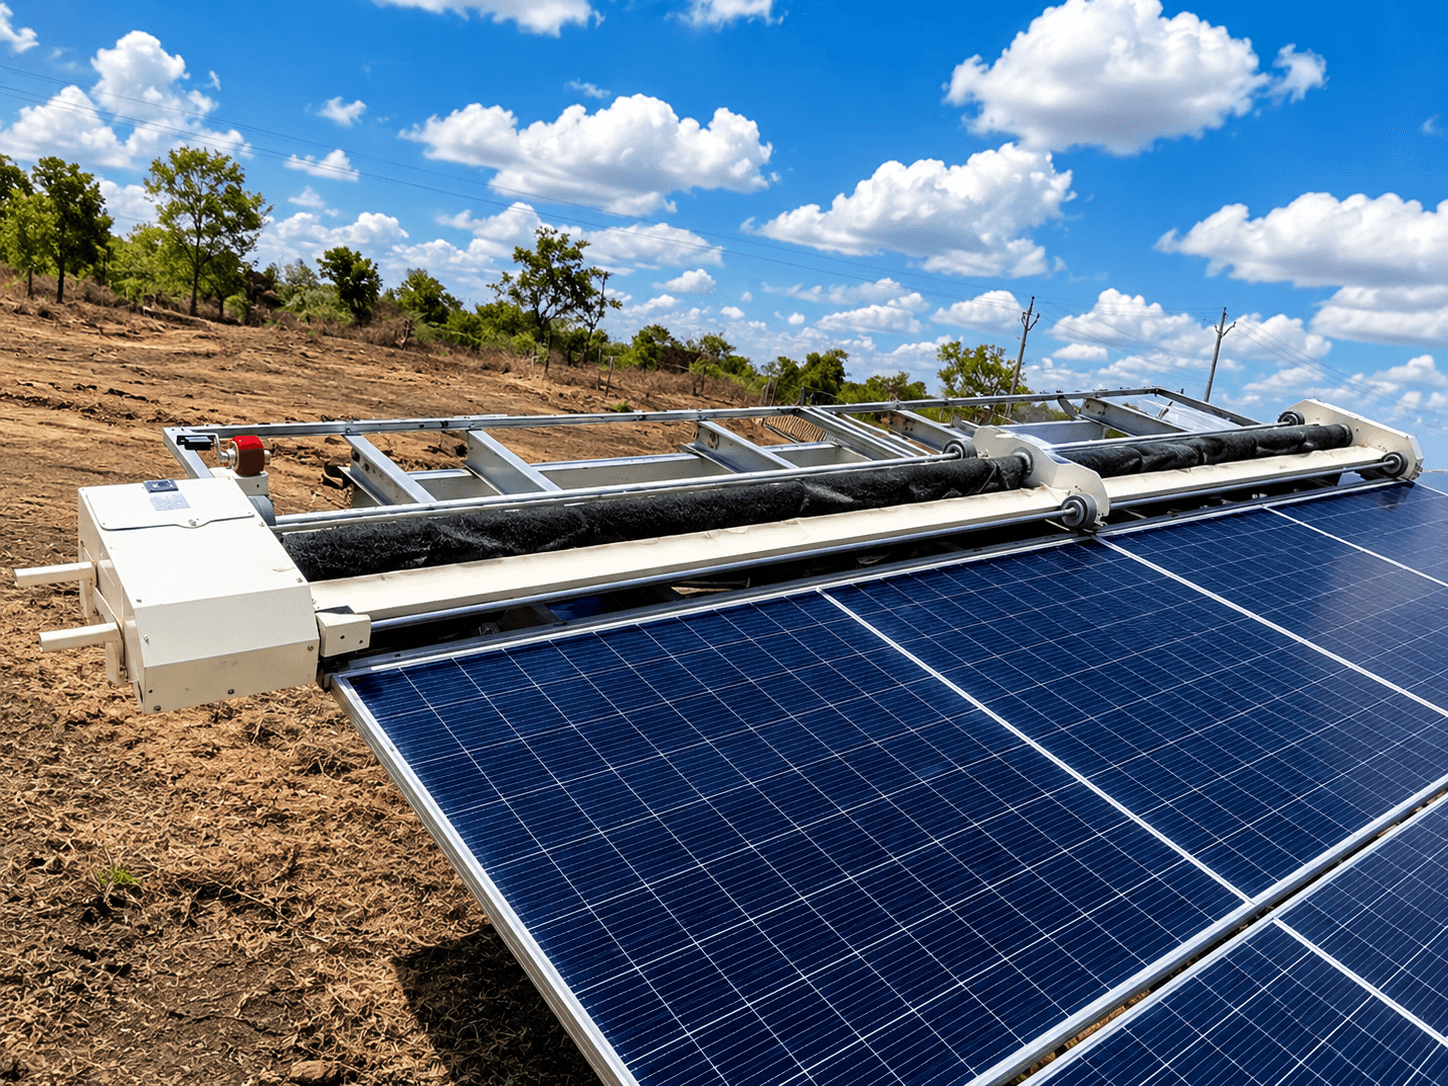
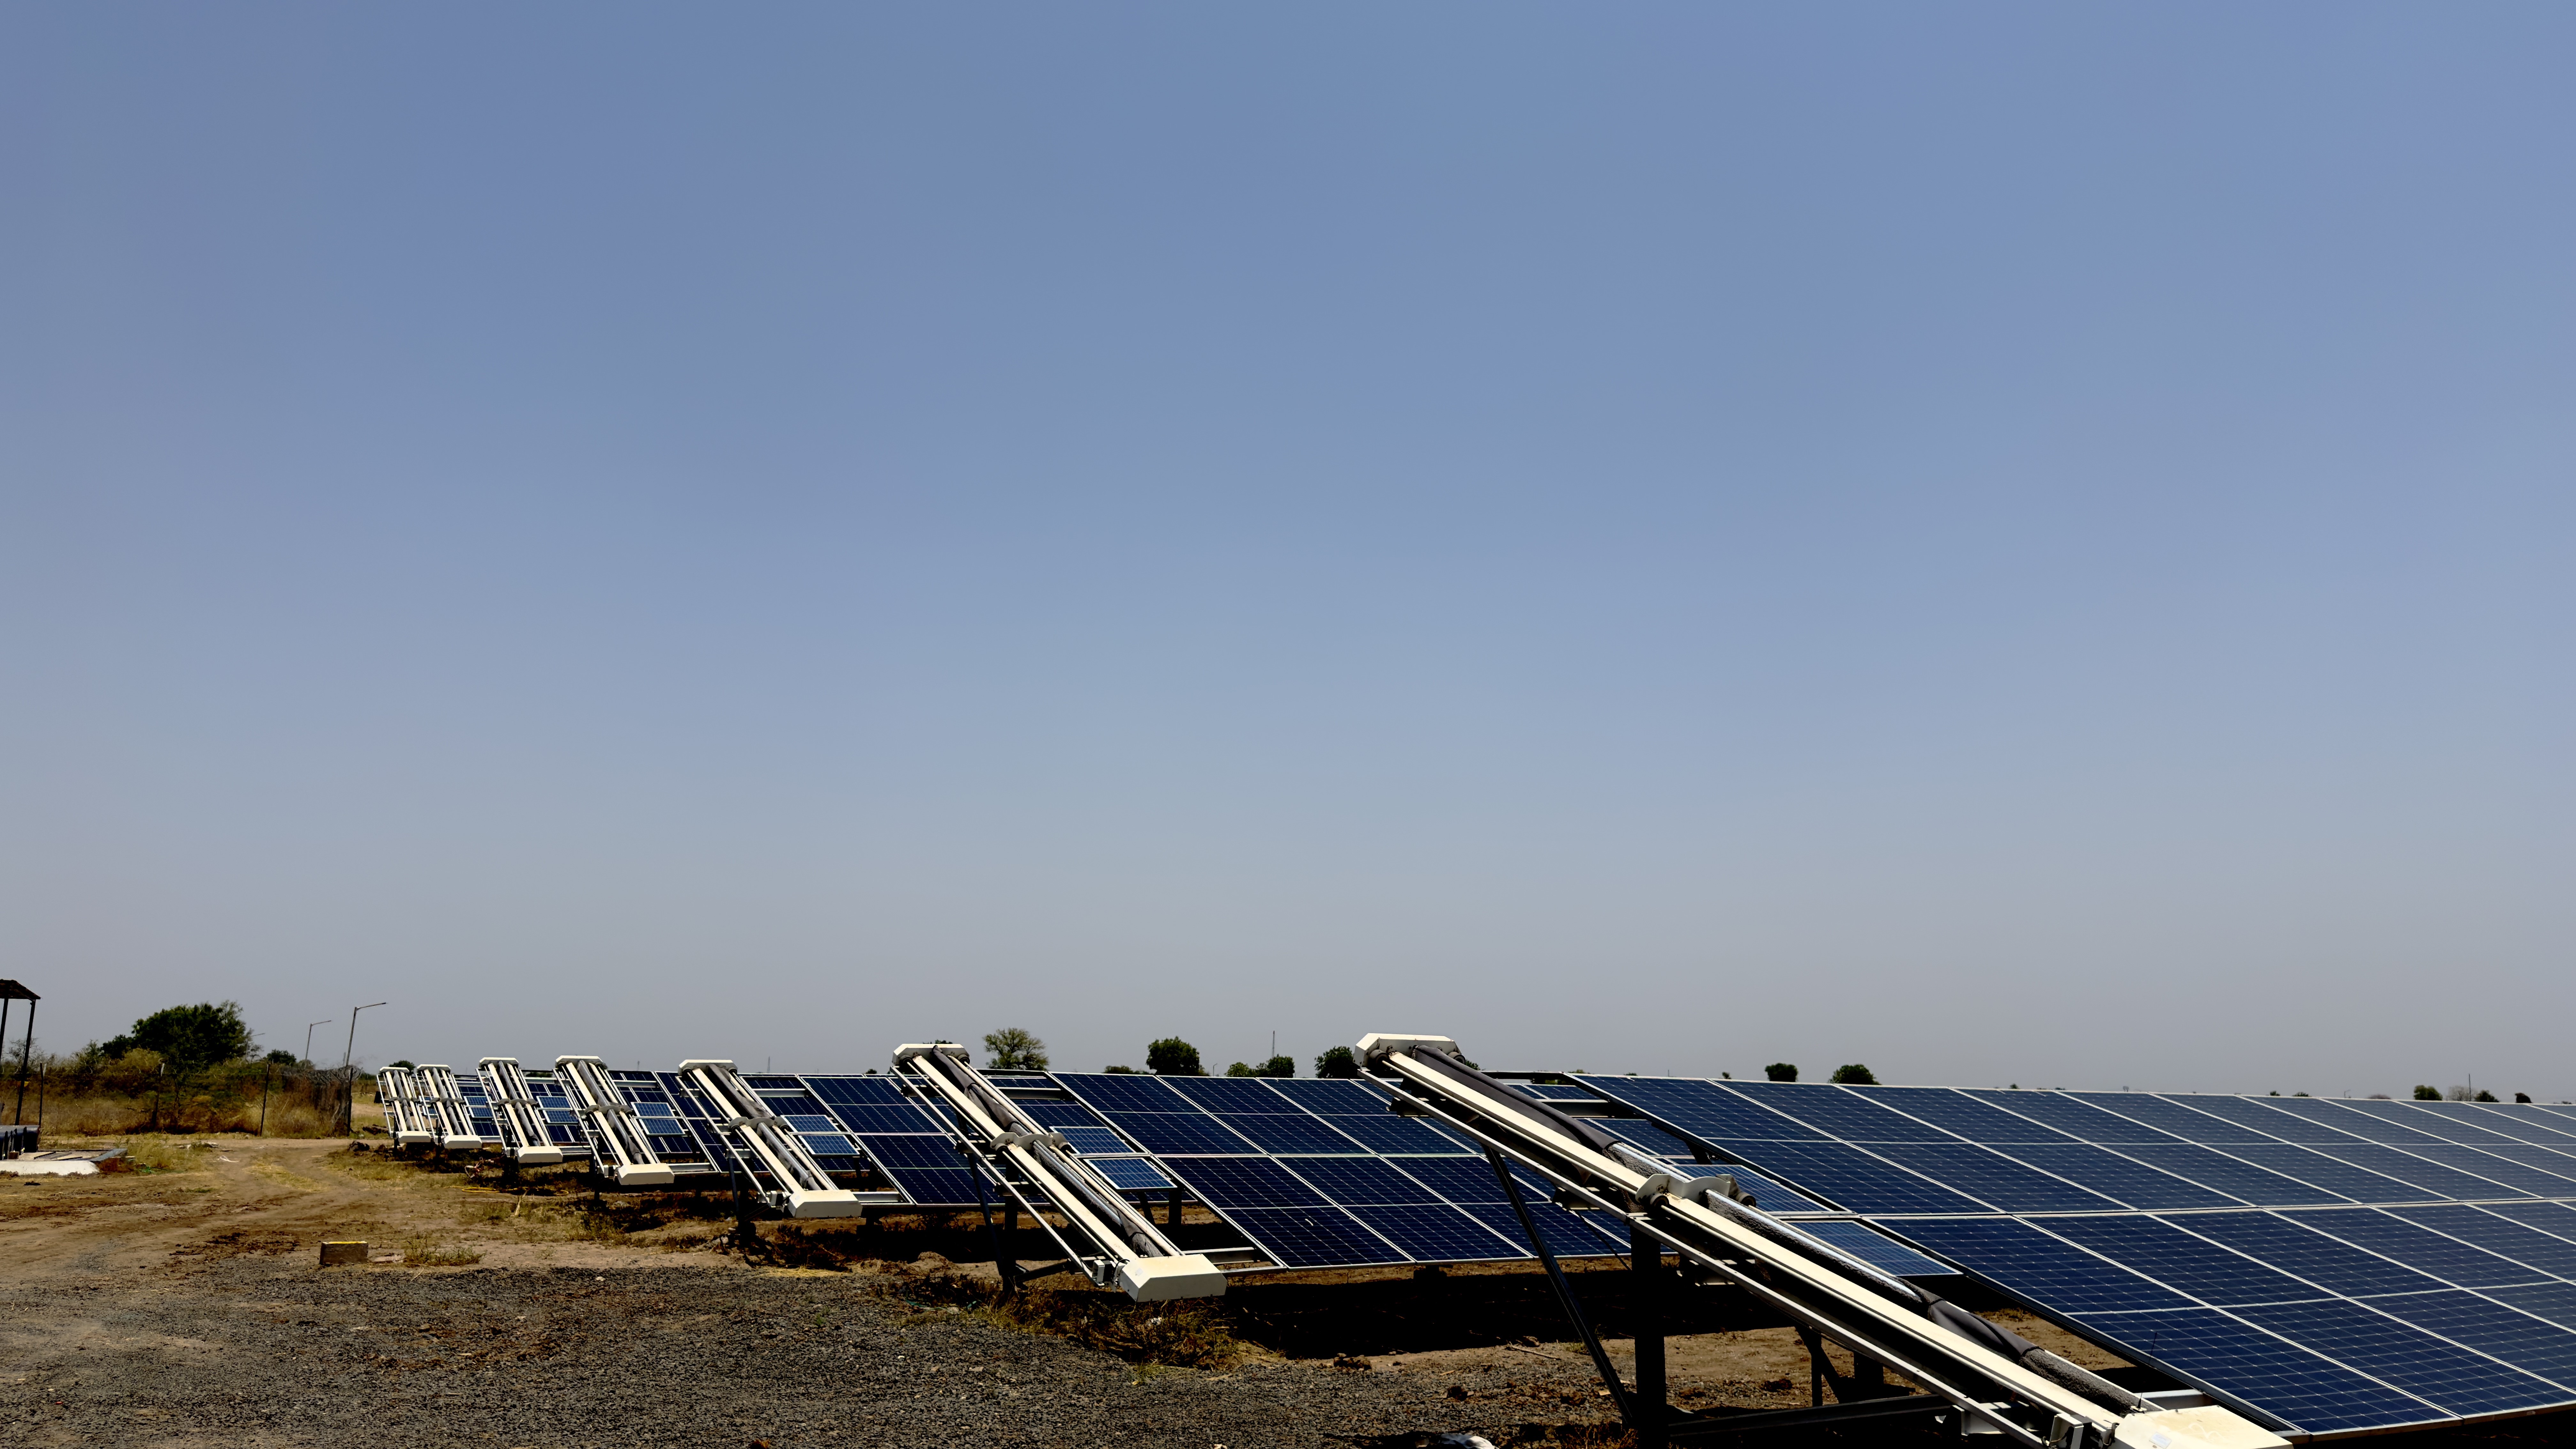
Moving to robots requires a new strategy. You shift from hiring people to investing in equipment. You must manage fleet uptime instead of human labor. In India, CAPEX for robots includes the units and docking stations like CRADYL. You also need software like NECTYR. CAPEX requires more money upfront. However, it stops wage inflation and turnover risks.
OPEX models offer more flexibility. Taypro's pay-per-clean service is an example. You pay based on power cycles. This avoids the burden of hardware maintenance. Service agreements bundle software updates into the cost. The cost crossover happens between 10MW and 25MW. At this scale, robots become cheaper than crews. As noted in our CAPEX vs OPEX procurement guide, the choice depends on your strategy. In high-soiling zones like Rajasthan, robots offer a huge advantage. They scale without adding more staff.
How does a solar panel cleaning robot impact long-term plant ROI?
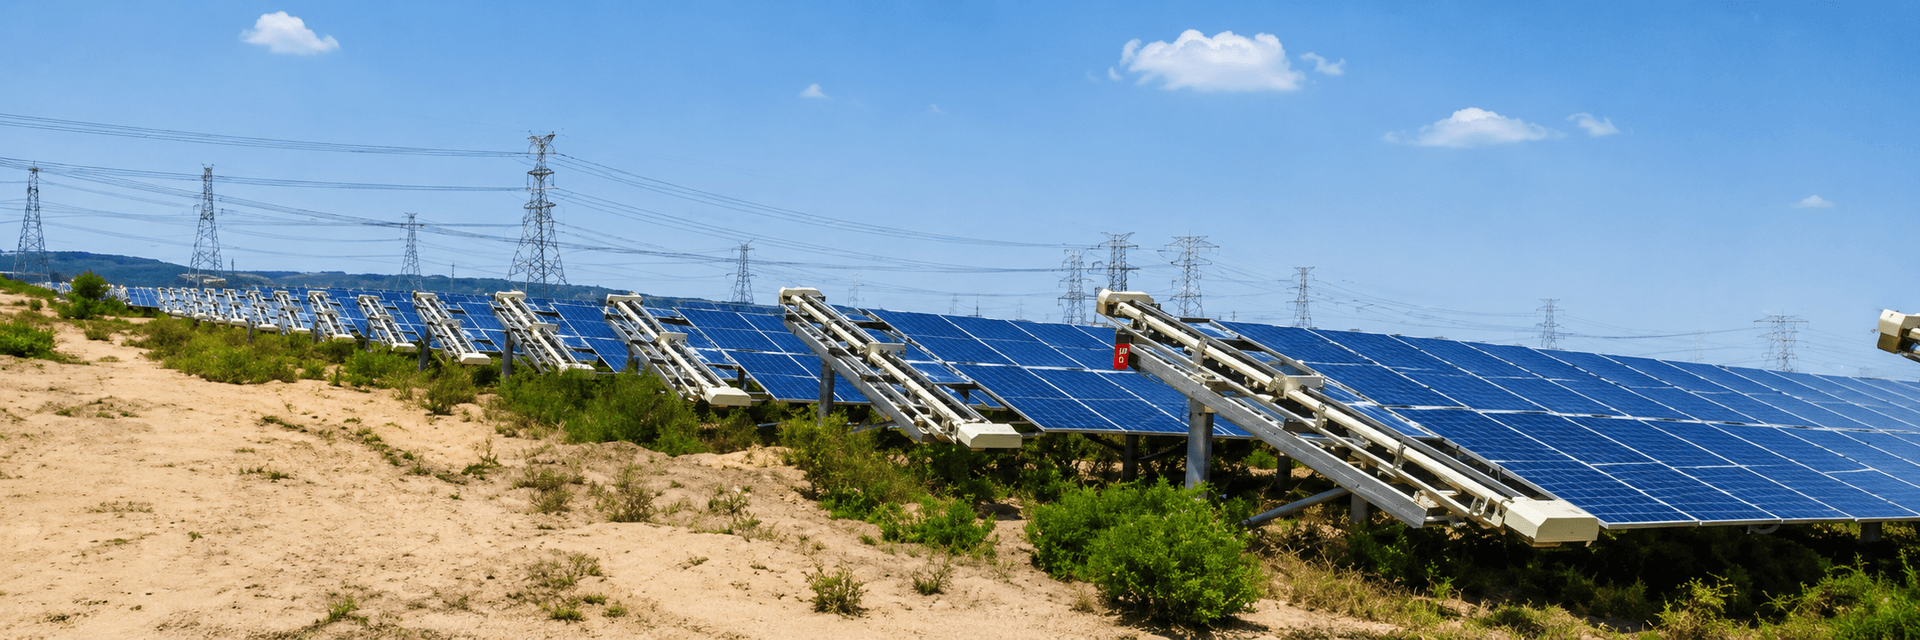
Robotic cleaning changes your financial profile. It turns heavy labor costs into predictable investments. These systems maintain a consistent Performance Ratio (PR). This prevents revenue loss from cleaning gaps. In Rajasthan, energy losses can hit 15% to 30%. Robots ensure cleaning stays on schedule even during dust storms.
ROI comes from three specific areas. First, it stops 'performance drag' from inconsistent manual work. Second, it lowers water costs. In dry regions, water transport is expensive. Third, it protects your modules. Robots avoid the physical wear caused by manual brushes. This protects coatings for the 25-year life of the panel.
Asset managers must look at the full picture. Calculate the recovery of lost MWh. Also, consider risks like labor injury. As analyzed in our guide on managing performance ratio losses, robots align budgets with energy cycles. Tools like the NECTYR portal help too. They let you focus on the dirtiest strings first. This speeds up your ROI.
Robots also offer economies of scale. This is true for plants between 10MW and 50MW. Owners who use robots during commissioning often see faster payback. This is discussed in our CAPEX vs OPEX procurement guide. By using technology, plants secure more stable cash flows.
Impact of cleaning models on utility-scale water consumption in India
Water scarcity is a major issue in Rajasthan and Gujarat. Moving from wet to dry cleaning is a big shift. Manual wet cleaning needs thousands of liters of water. This requires expensive tankers and high carbon costs. Robotic systems can save up to 90% of water compared to wet methods.
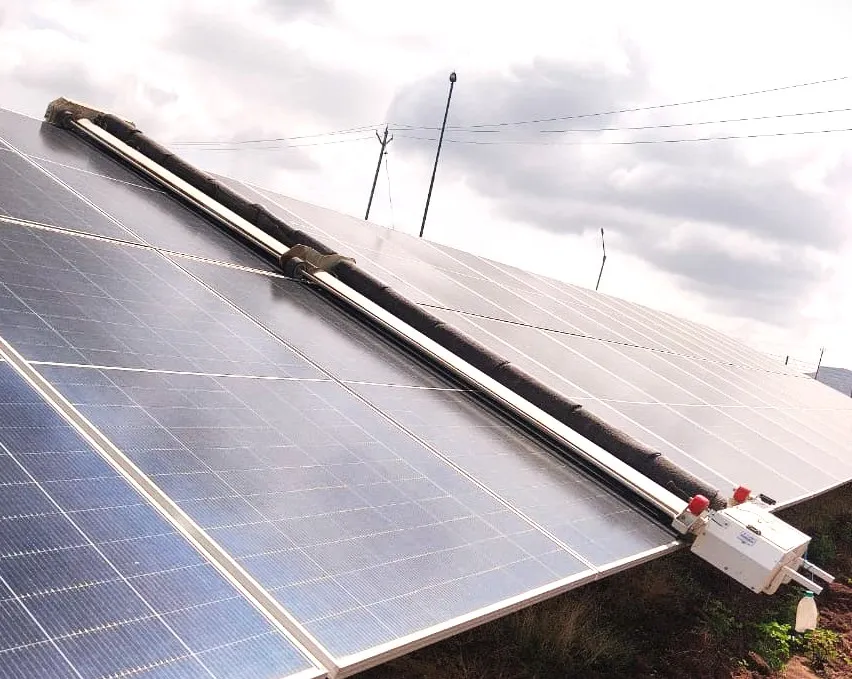
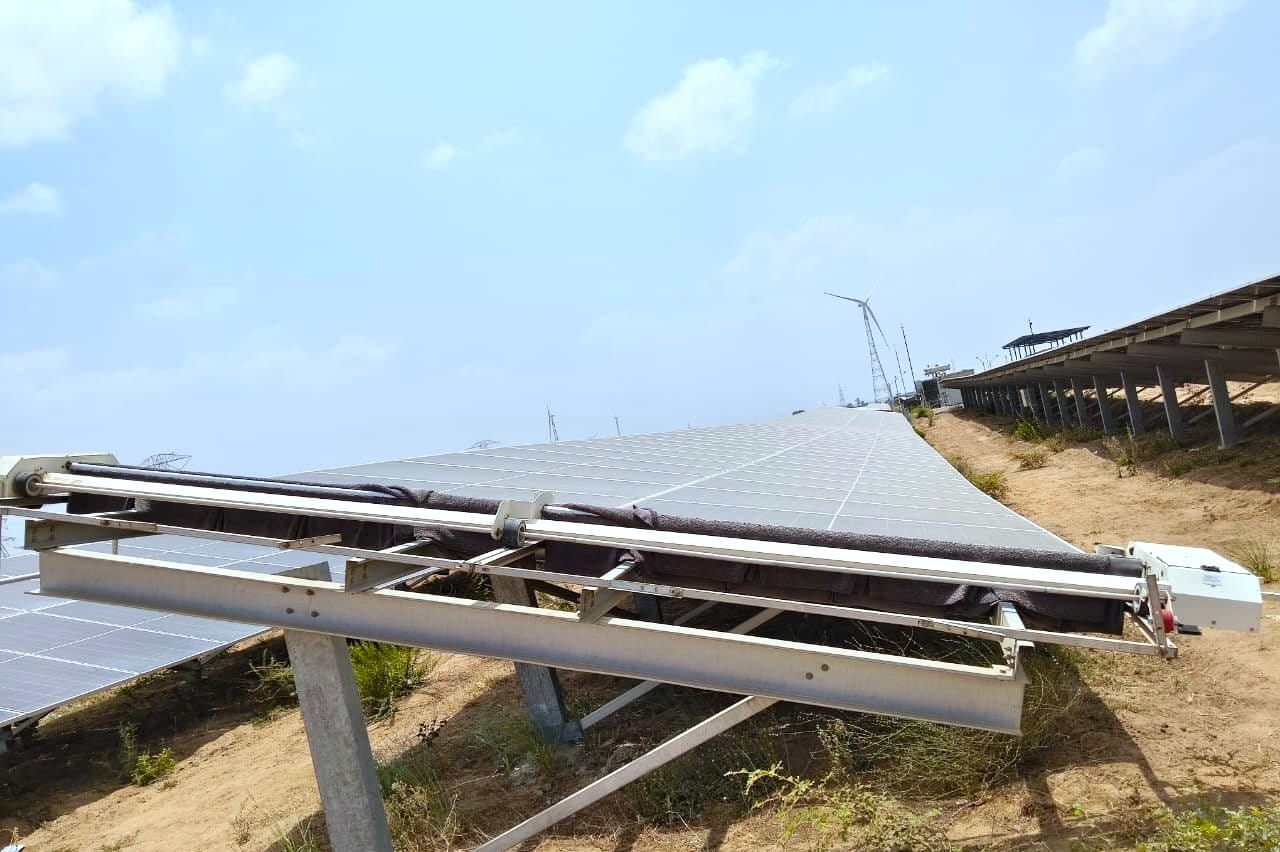
This shift reduces regulatory risk. Governments are tightening groundwater rules. This makes water more expensive. Waterless solutions like GLYDE-X or NYUMA use special brushes. They clean without water. These systems also need fewer access roads. This protects the soil and lowers site disturbance.
Water conservation also stabilizes your budget. In arid areas, tanker costs can reach 25% of cleaning OPEX. Autonomous fleets provide a predictable, water-free alternative. As noted in our waterless vs water-based cleaning analysis, waterless cleaning is safer. It prevents mineral deposits on panels. This prevents micro-shadowing and keeps output high.
Comparing TCO: Manual labor vs. automated cleaning fleets
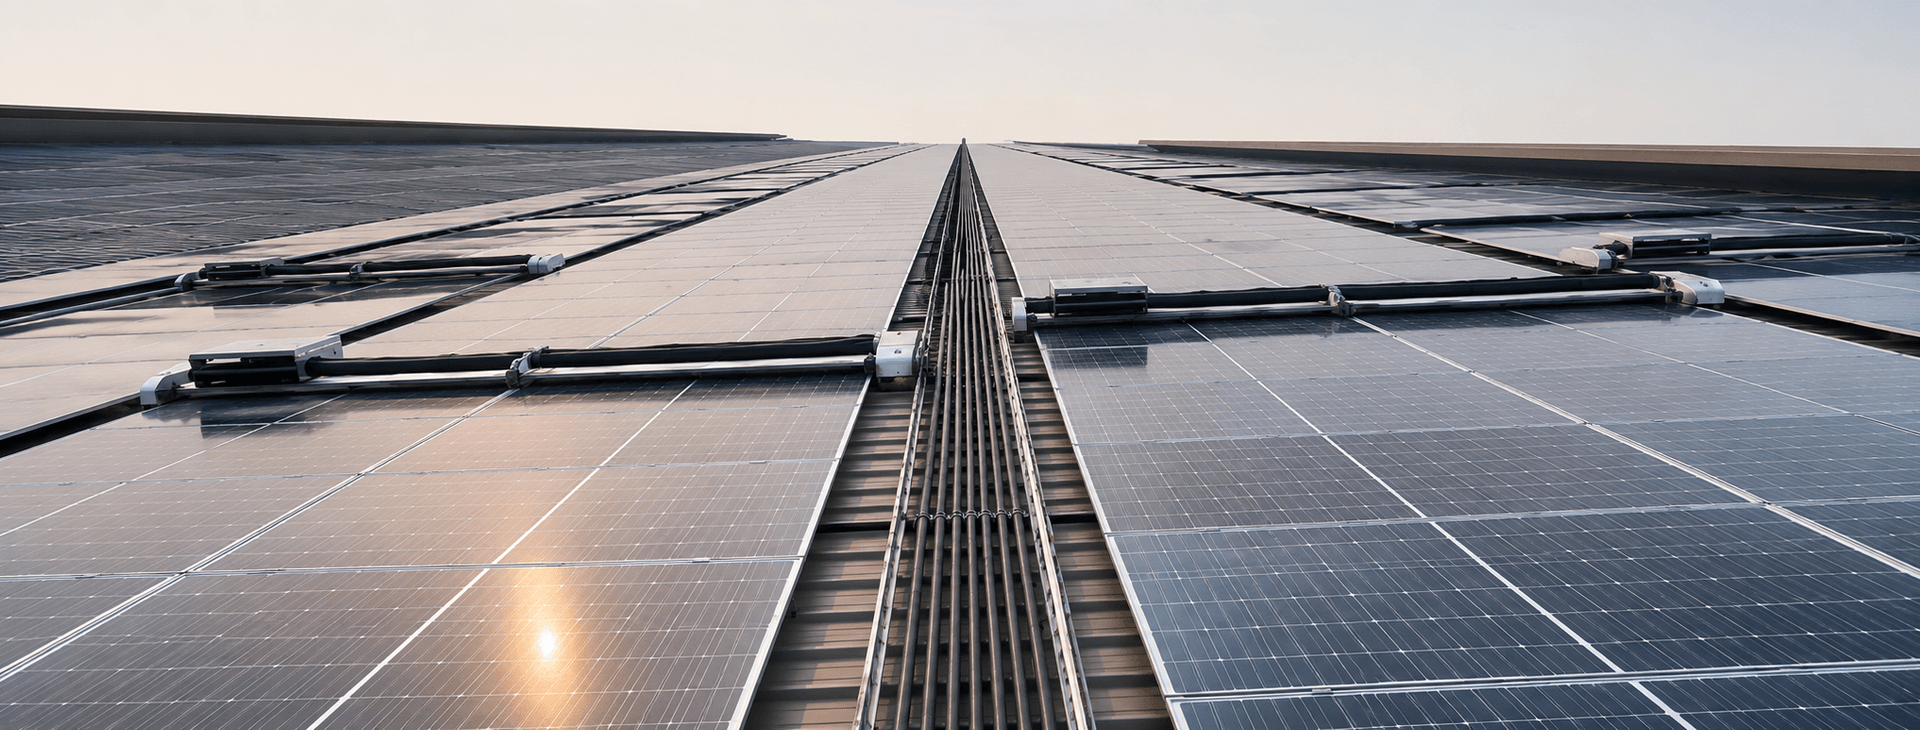
TCO analysis is about more than the robot's price. For a 50MW plant, manual costs rise 5% to 8% every year. This is due to wages and logistics. An automated fleet like GLYDE or NYUMA has higher upfront costs. But, it offers predictable, low-maintenance OPEX.
Consider these cost drivers over a 10-year period:
| Cost Component | Manual Labor Model | Automated Fleet Model |
|---|---|---|
| Labor | High (variable) | Minimal (oversight only) |
| Water Usage | High (costly transport) | Negligible (waterless) |
| Plant Uptime | Lower (slow cycles) | Higher (consistent cycles) |
| Module Safety | High risk (contact) | Low (automated) |
| Maintenance | Recurring training | Predictable upkeep |
In high-soiling areas, manual models fail to keep the PR high. This leads to lost revenue. Robots reduce human traffic between rows. This protects module connectors and tracker parts. Use your performance ratio loss mitigation strategies to check energy recovery. Monitoring tools like NECTYR help refine these schedules. They ensure you spend your budget on the dirtiest sectors.
Decision checklist: Selecting a staffing model for your 5MW+ site
Choosing a model requires looking at your constraints. A 5MW plant in a desert is different from a coastal plant. Use this checklist to ensure your approach delivers returns.
- Baseline site soiling rate: If losses exceed 0.5% daily, manual cleaning fails. Use GLYDE-X for frequent cycles.
- Water accessibility and logistics: Check your water distance. If tanker costs are high, go waterless. This prevents road damage and soil compaction.
- Capital allocation strategy: Do you want low CAPEX or predictable OPEX? For zero-CAPEX, use our fully managed cleaning service.
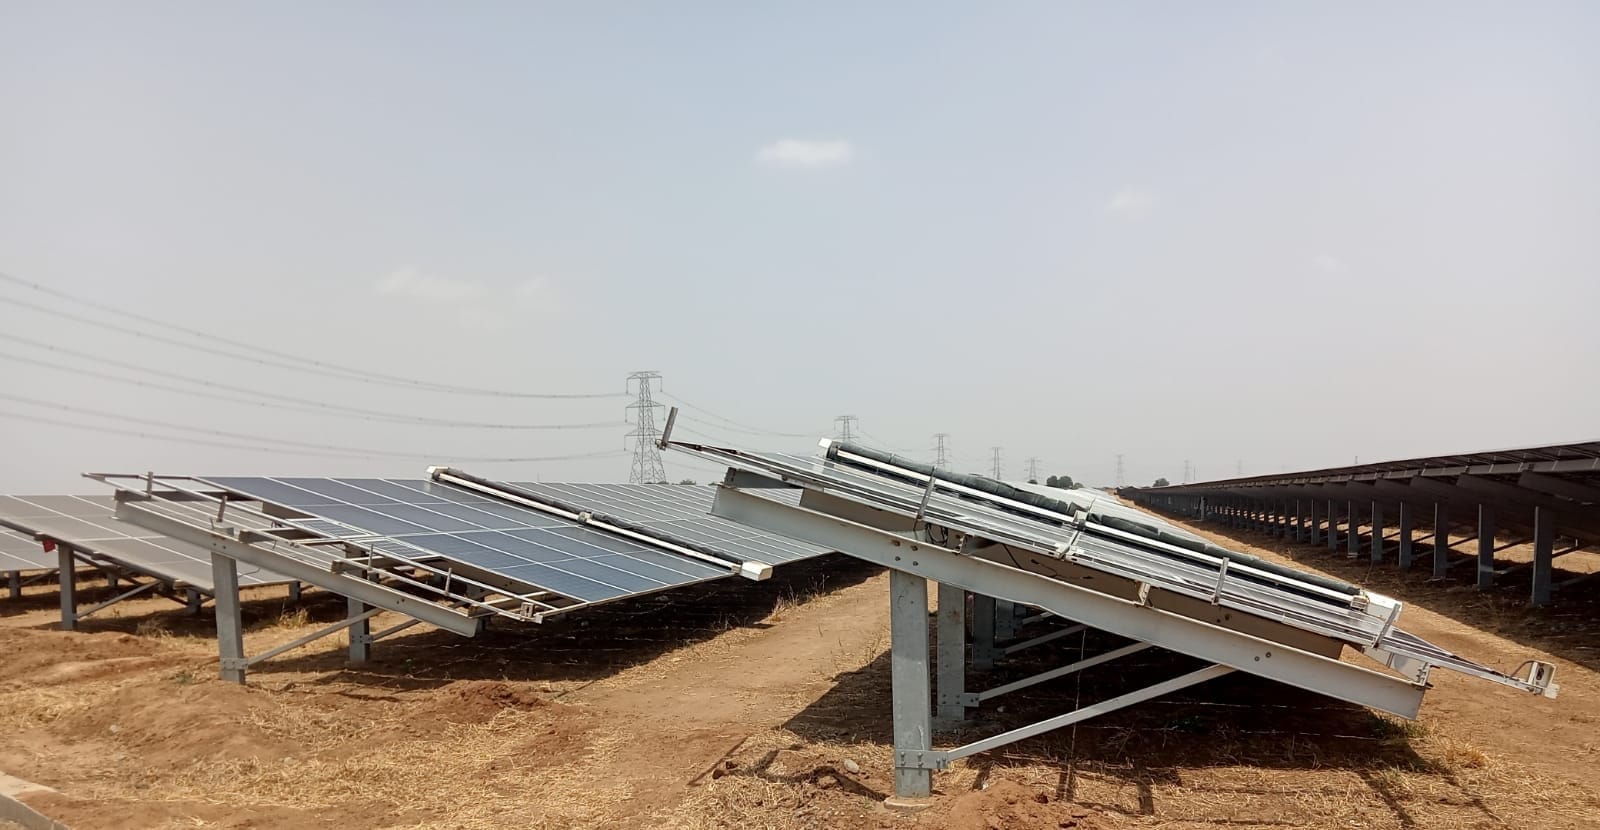
- Tracker geometry compatibility: Ensure the robot fits your structure. For single-axis trackers, use NYUMA-X.
- Data-driven O&M integration: Modern models need data. Use NECTYR to clean based on actual dust levels.
This assessment helps you move from reactive cleaning to a real strategy. It aligns your investment with long-term energy goals.
What plant managers should do next
Start with a phased approach. Do not roll out everywhere at once. Validate your site with a small pilot first.
- Perform a site-specific soiling audit: Use sensors to find your soiling loss. If monthly loss exceeds 2%, start with robots in those areas.
- Run a pilot project with an O&M partner: Try a 3-month trial with a dedicated tracker-compatible robot. Compare it to your old manual costs.
- Review your existing SCADA integration: Ensure your monitoring system works with advanced management portals.
- Calculate your TCO including water logistics: Include tanker transport and driver wages. These are often the largest variable costs in Rajasthan.
- Schedule a technical consultation: Contact us at sales@taypro.in or call +91 80438 43569. We can help with tracker needs and mounting. We offer autonomous waterless cleaning that scales with you.
Switching to robotic operations can reclaim 25% of your O&M budget. Stop losing money to inefficient maintenance. Start your audit today to build a higher-yield solar operation.
Sources and further reading
Frequently asked questions
Solar asset owners in India face a major choice. You can move from manual cleaning to a robotic model.
Shifting from manual labor to automated cleaning reduces dependence on large, seasonal workforces that often account for 15% to 25% of total O&M expenditure. Automating the process allows plant managers to optimize cleaning frequency based on data-driven triggers rather than fixed calendar intervals, which helps mitigate performance ratio losses more effectively.
The main drivers include the recurring cost of manual labor, logistical challenges in managing brush crews across isolated sites, and the rising expense of water procurement in arid regions like Rajasthan and Gujarat. These costs are compounded by the frequency required to combat high soiling rates that degrade system efficiency beyond standard annual module degradation of 0.5% to 0.7%.
Yes, robotic cleaning reduces the total cost of ownership by eliminating the need for large semi-skilled labor crews and minimizing water expenses. By utilizing dry robotic technology, operators can consistently recover generation losses, improve the long-term performance ratio of the asset, and standardize maintenance across large portfolios.