Summary for plant managers
A proactive solar plant audit requires rigorous tracking of cleaning-related red flags that threaten energy yield. By integrating real-time Performance Ratio (PR) monitoring with physical site inspections, O&M teams can transition from reactive cleaning to condition-based maintenance that protects module integrity and plant financial health.
- Typical soiling-related efficiency loss: 0.35% to 0.5% per day in arid zones like Rajasthan and Gujarat.
- Critical Red Flag: A Performance Ratio (PR) drop exceeding 3% due to soiling without immediate remediation.
- Resource Threshold: Excessive water usage exceeding 5L per module in water-stressed regions, which indicates inefficient manual cleaning cycles.
- Audit Focus: Presence of micro-cracks or hotspots caused by improper manual pressure or abrasive cleaning tools that void panel warranties.
Managers should evaluate their current cleaning frequency against localized dust profiles rather than following generic calendar-based intervals. For large-scale sites, shifting to autonomous systems or optimized cleaning schedules significantly reduces the risk of long-term degradation. For deeper insights on how cleaning frequency impacts your specific site capacity, refer to our guide on optimizing robot fleet sizing for utility plants.
Why cleaning-related red flags matter in Indian utility-scale audits
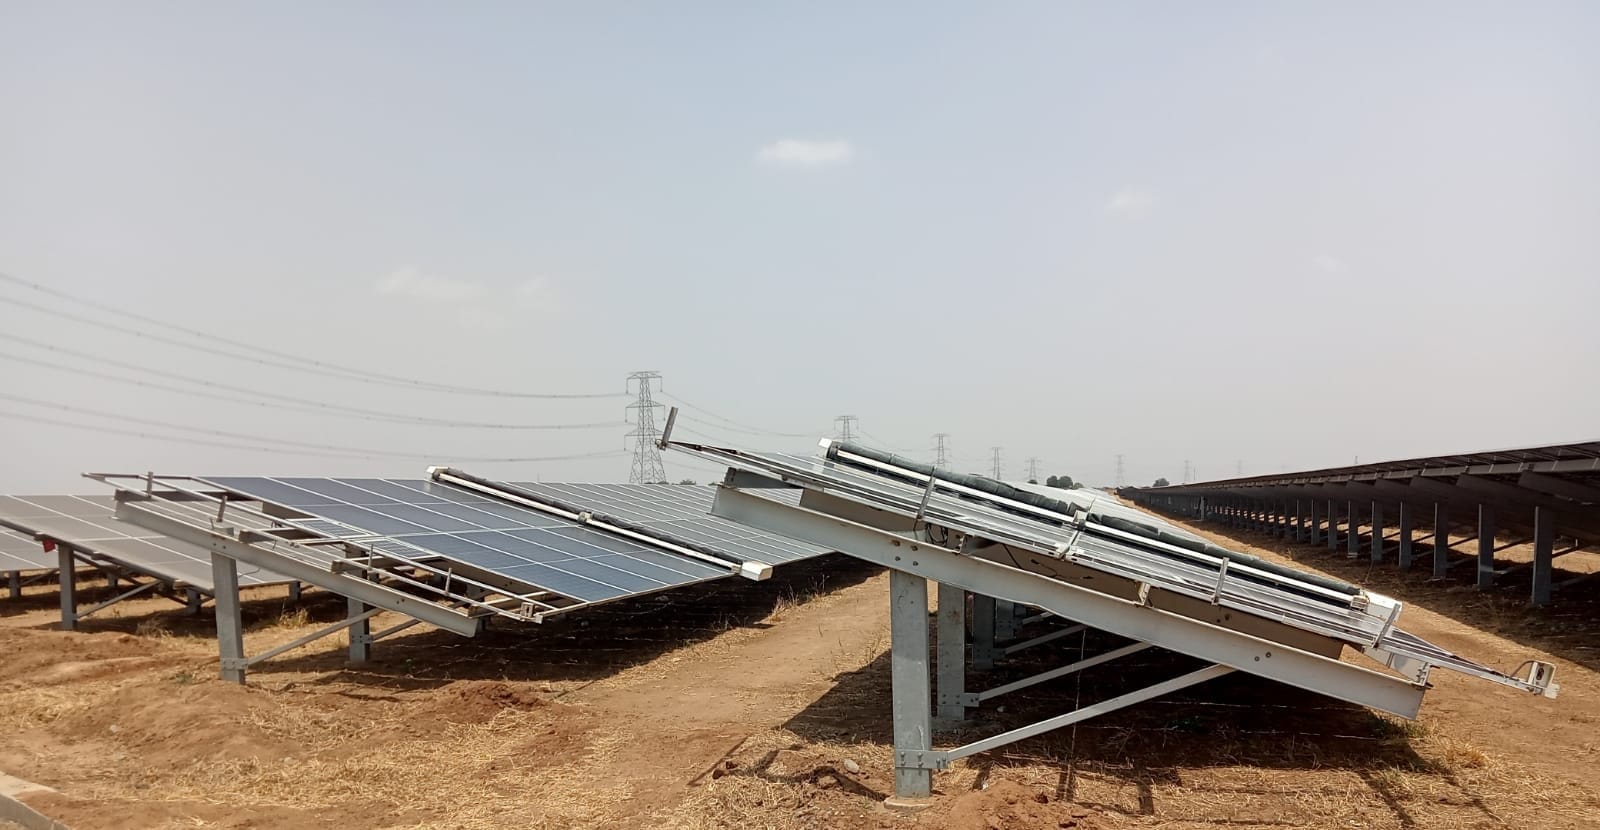
In the context of the 308 GW Indian non-fossil fuel capacity expansion, cleaning-related red flags are often the earliest indicators of structural O&M failure. Asset owners frequently overlook these signs until they manifest as significant drops in the Performance Ratio (PR), but by the time PR dips, energy revenue loss is already compounded. In regions like Rajasthan or Gujarat, where daily efficiency losses often range from 0.35% to 0.5%, even a minor delay in detection can lead to annual energy yield losses between 6% and 15%.
Ignoring these red flags creates a cascade effect on plant economics and equipment warranties. Manual cleaning teams may use abrasive brushes or incorrect water pressure, leading to micro-cracks on cell surfaces or damage to anti-reflective coatings. These physical defects represent an irreversible loss in module efficiency, far exceeding the cost of a proper audit cycle. Asset managers must prioritize identifying these patterns to safeguard their return on investment across the initial plant commissioning phase and throughout the operational life of the project.
Furthermore, standard monitoring systems often fail to distinguish between soil-induced PR degradation and genuine panel performance issues. A thorough audit identifies cleaning-related red flags by isolating soiling patterns from other system variables such as inverter downtime or grid curtailment. When operators fail to reconcile these datasets, they miss the opportunity to transition toward data-driven cleaning schedules, leaving valuable capacity on the table. Detecting these indicators early allows for immediate remediation, ensuring that the plant operates within the technical parameters defined by the CEA connectivity standards.
The plant audit checklist cleaning related red flags: Technical categories
An effective audit must segment cleaning-related red flags into three critical categories: resource methodology, mechanical integrity, and operational synchronization. When auditing a utility-scale plant, O&M teams should systematically evaluate the following indicators to prevent long-term degradation.
1. Resource and Methodology Audit
Assess if your cleaning operations rely on excessive water or abrasive tools that violate manufacturer warranty terms. A major red flag in India's water-stressed regions is water consumption exceeding 5 litres per module per cycle. If manual crews are using high-pressure sprayers without proper filtration, they are likely depositing mineral scales and creating streaks that accelerate localized soiling, known as the shadow effect.
2. Mechanical Integrity and Coating Assessment
Inspect module surfaces for micro-cracks and abrasion marks, particularly on anti-reflective coatings. Manual brushes with improper bristle density or worn-out components often leave microscopic scratches. These physical failures lead to increased hotspots and lower total irradiance capture over time. During your audit, check for uniform cleaning patterns; uneven streaks are a sign of improper labor rotation or malfunctioning robotic brushes.
Advertisement
3. Operational Synchronization and Data Consistency
A primary technical red flag is the discrepancy between scheduled maintenance logs and observed PR recovery. If a cleaning cycle is performed but the PR fails to show a corresponding recovery within 48 hours, the cleaning methodology is likely failing to clear the specific dust composition present at that site. This failure suggests that the current cadence is optimized for generic calendars rather than the real-time soiling conditions required by modern 300 MW+ scale operations. For teams managing large-scale assets, integrating SCADA-linked performance monitoring is essential to ensure that cleaning logs and generation data remain aligned.
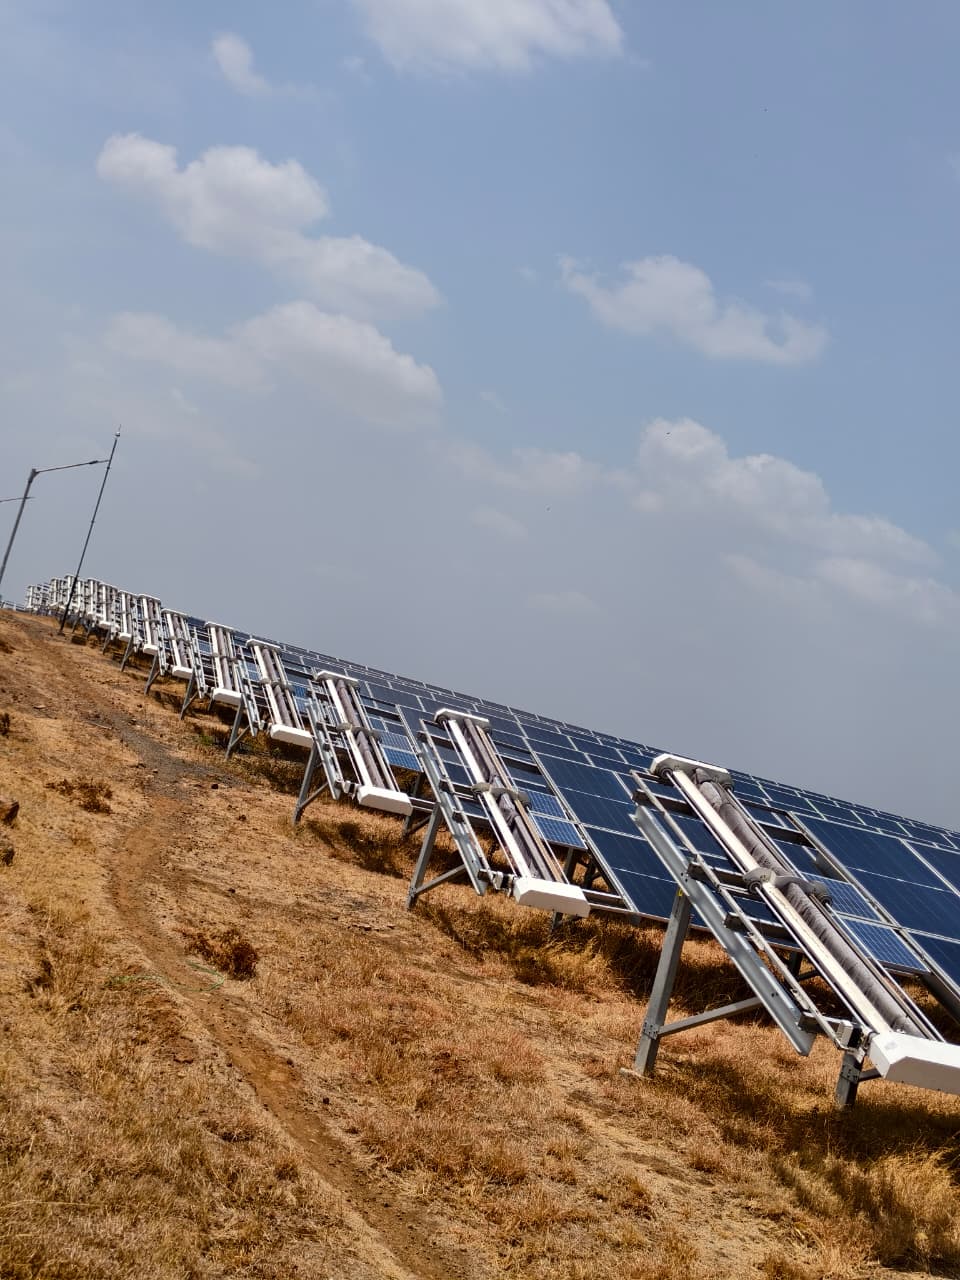
By maintaining a strict audit trail, managers can identify when to pivot from manual labor to autonomous robotic solutions that ensure consistency across large-scale arrays. Consistent, non-abrasive cleaning cycles not only protect the module warranty but also ensure that the plant reaches its expected design life without premature replacement costs.
How do soiling-induced PR drops signal a failed cleaning strategy?
Performance Ratio (PR) is the most sensitive metric for detecting cleaning inefficiencies. When soiling accumulation outpaces your cleaning cadence, the resulting PR decline follows a distinct signature that differs from equipment failure. A typical arid-zone plant in India experiences a daily PR drop of 0.35% to 0.5%. If your SCADA data shows a consistent downward trend that does not reset effectively after a scheduled maintenance window, you are looking at a failed cleaning strategy.
A successful audit correlates PR recovery with the actual cleaning event. If the system PR does not return to the expected baseline within 24 to 48 hours post-cleaning, the strategy is fundamentally flawed. This lag often indicates that the cleaning mechanism is failing to remove specific contaminants like bird droppings, sticky pollutants, or heavy dust layers in high-humidity zones. For operators managing portfolios, separating soiling loss from degradation is critical, as discussed in our module degradation vs soiling loss analysis. Without this distinction, you risk over-investing in panel replacements when the issue is simply an inadequate cleaning cycle.
The 5% Threshold and Operational Response
Industry-standard audits suggest that a PR dip of 5% below the monthly mean is the red-line threshold for immediate intervention. In large-scale utility plants, failing to address this gap leads to compounded generation losses. The optimal robot fleet size is designed to keep this variance under control by executing high-frequency, non-abrasive cycles that manual labor models cannot sustain. If your cleaning logs indicate that the frequency remains static despite fluctuations in actual irradiance and seasonal dust, your operational plan is not data-driven. This rigidity often results in the accumulation of stubborn soiling that becomes exponentially harder and more costly to remove as the dry season progresses.
Identifying resource-related red flags: Water scarcity and labor risks
An audit of your cleaning resources must look beyond current expenditures to identify structural operational risks. For utility-scale assets in India, water-based cleaning is the most significant red flag for long-term sustainability due to inconsistent groundwater access and rising costs of tanker-based supply. If your O&M ledger shows a recurring spike in water tanker invoices during peak summer months, your operational model is vulnerable to both scarcity and supply-chain instability.
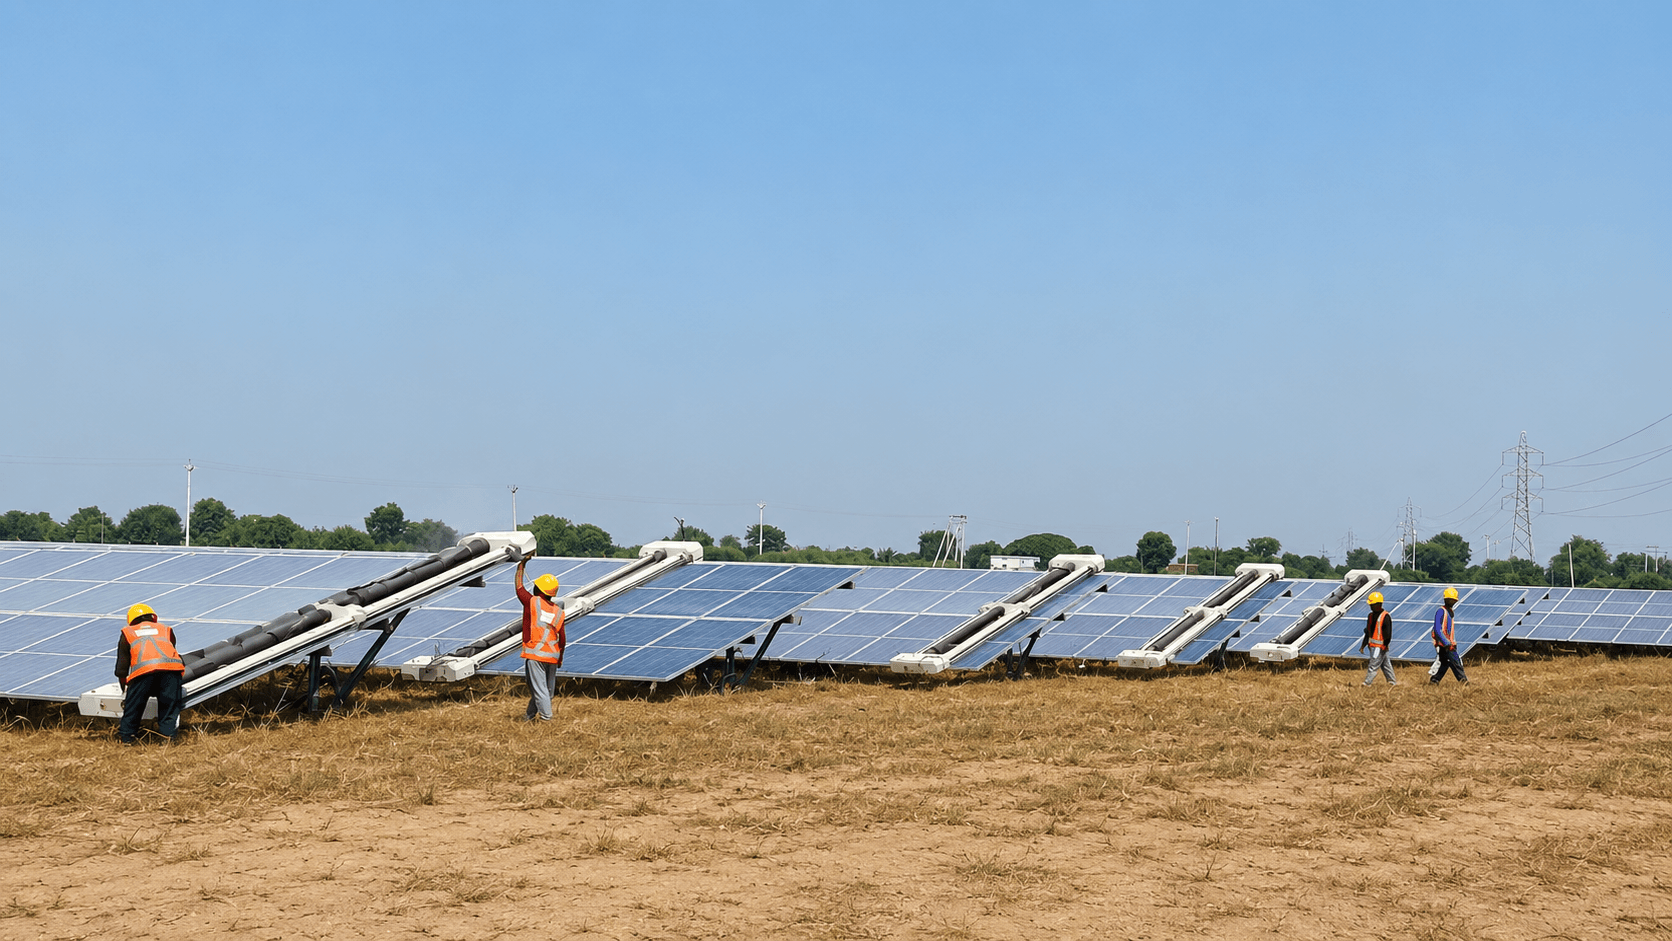
Labor-related risks often mirror water consumption issues. Manual cleaning teams, while flexible in theory, present a high probability of inconsistent cleaning quality across expansive sites. High-turnover labor creates audit risks where cleaning rotations become haphazard, leaving entire blocks or tracker tables untreated. When reviewing your O&M staffing model, look for a lack of standardized performance logs that verify coverage per row. Inconsistent records are a primary indicator that the manual cleaning cycle is not being executed to the required density of 10–15 MW coverage per team.
Furthermore, rely on your site audit to check for excessive moisture usage in regions with high soil salinity, as salt-laced water can leave conductive deposits that degrade module coatings. Transitioning from reliance on variable-quality manual labor to autonomous robotic systems reduces these resource risks by ensuring a predictable, waterless methodology. By auditing your current water usage per MW against the industry-typical performance recovery, you can quantify exactly how much water and labor cost is being wasted on suboptimal manual interventions. Aligning your cleaning strategy with documented fleet sizing metrics will provide the predictable OPEX structure required for sustainable 300 MW+ operations.
Physical damage assessment: Module integrity during cleaning
An essential component of any plant audit is verifying the physical integrity of modules after repeated cleaning cycles. Inconsistent manual cleaning techniques, such as using abrasive brushes or improper pressure, are major red flags that can cause micro-cracks in cells or permanently damage anti-reflective coatings. These subtle defects often remain invisible during standard visual inspections but lead to localized hot spots and accelerated degradation over time. When performing an audit, you must cross-reference your site maintenance logs with periodic drone-based thermography to ensure that your cleaning method has not compromised module glass or frame seals.
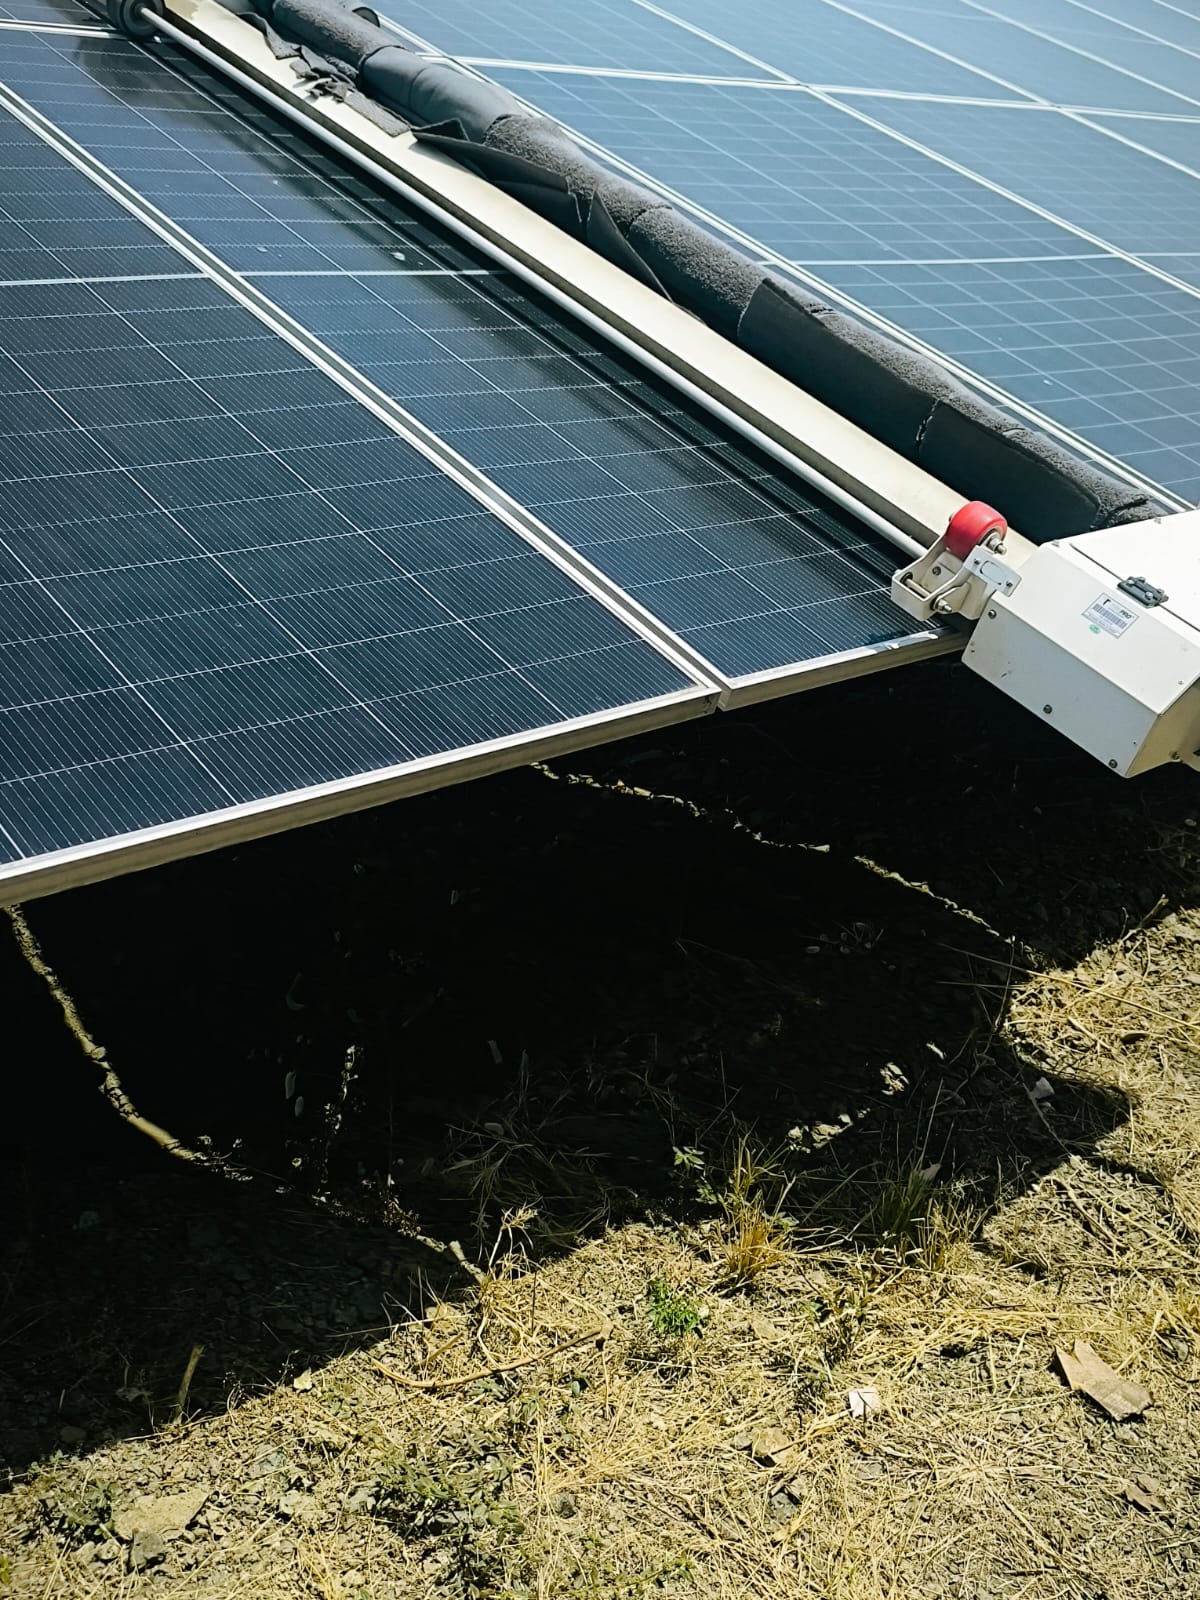
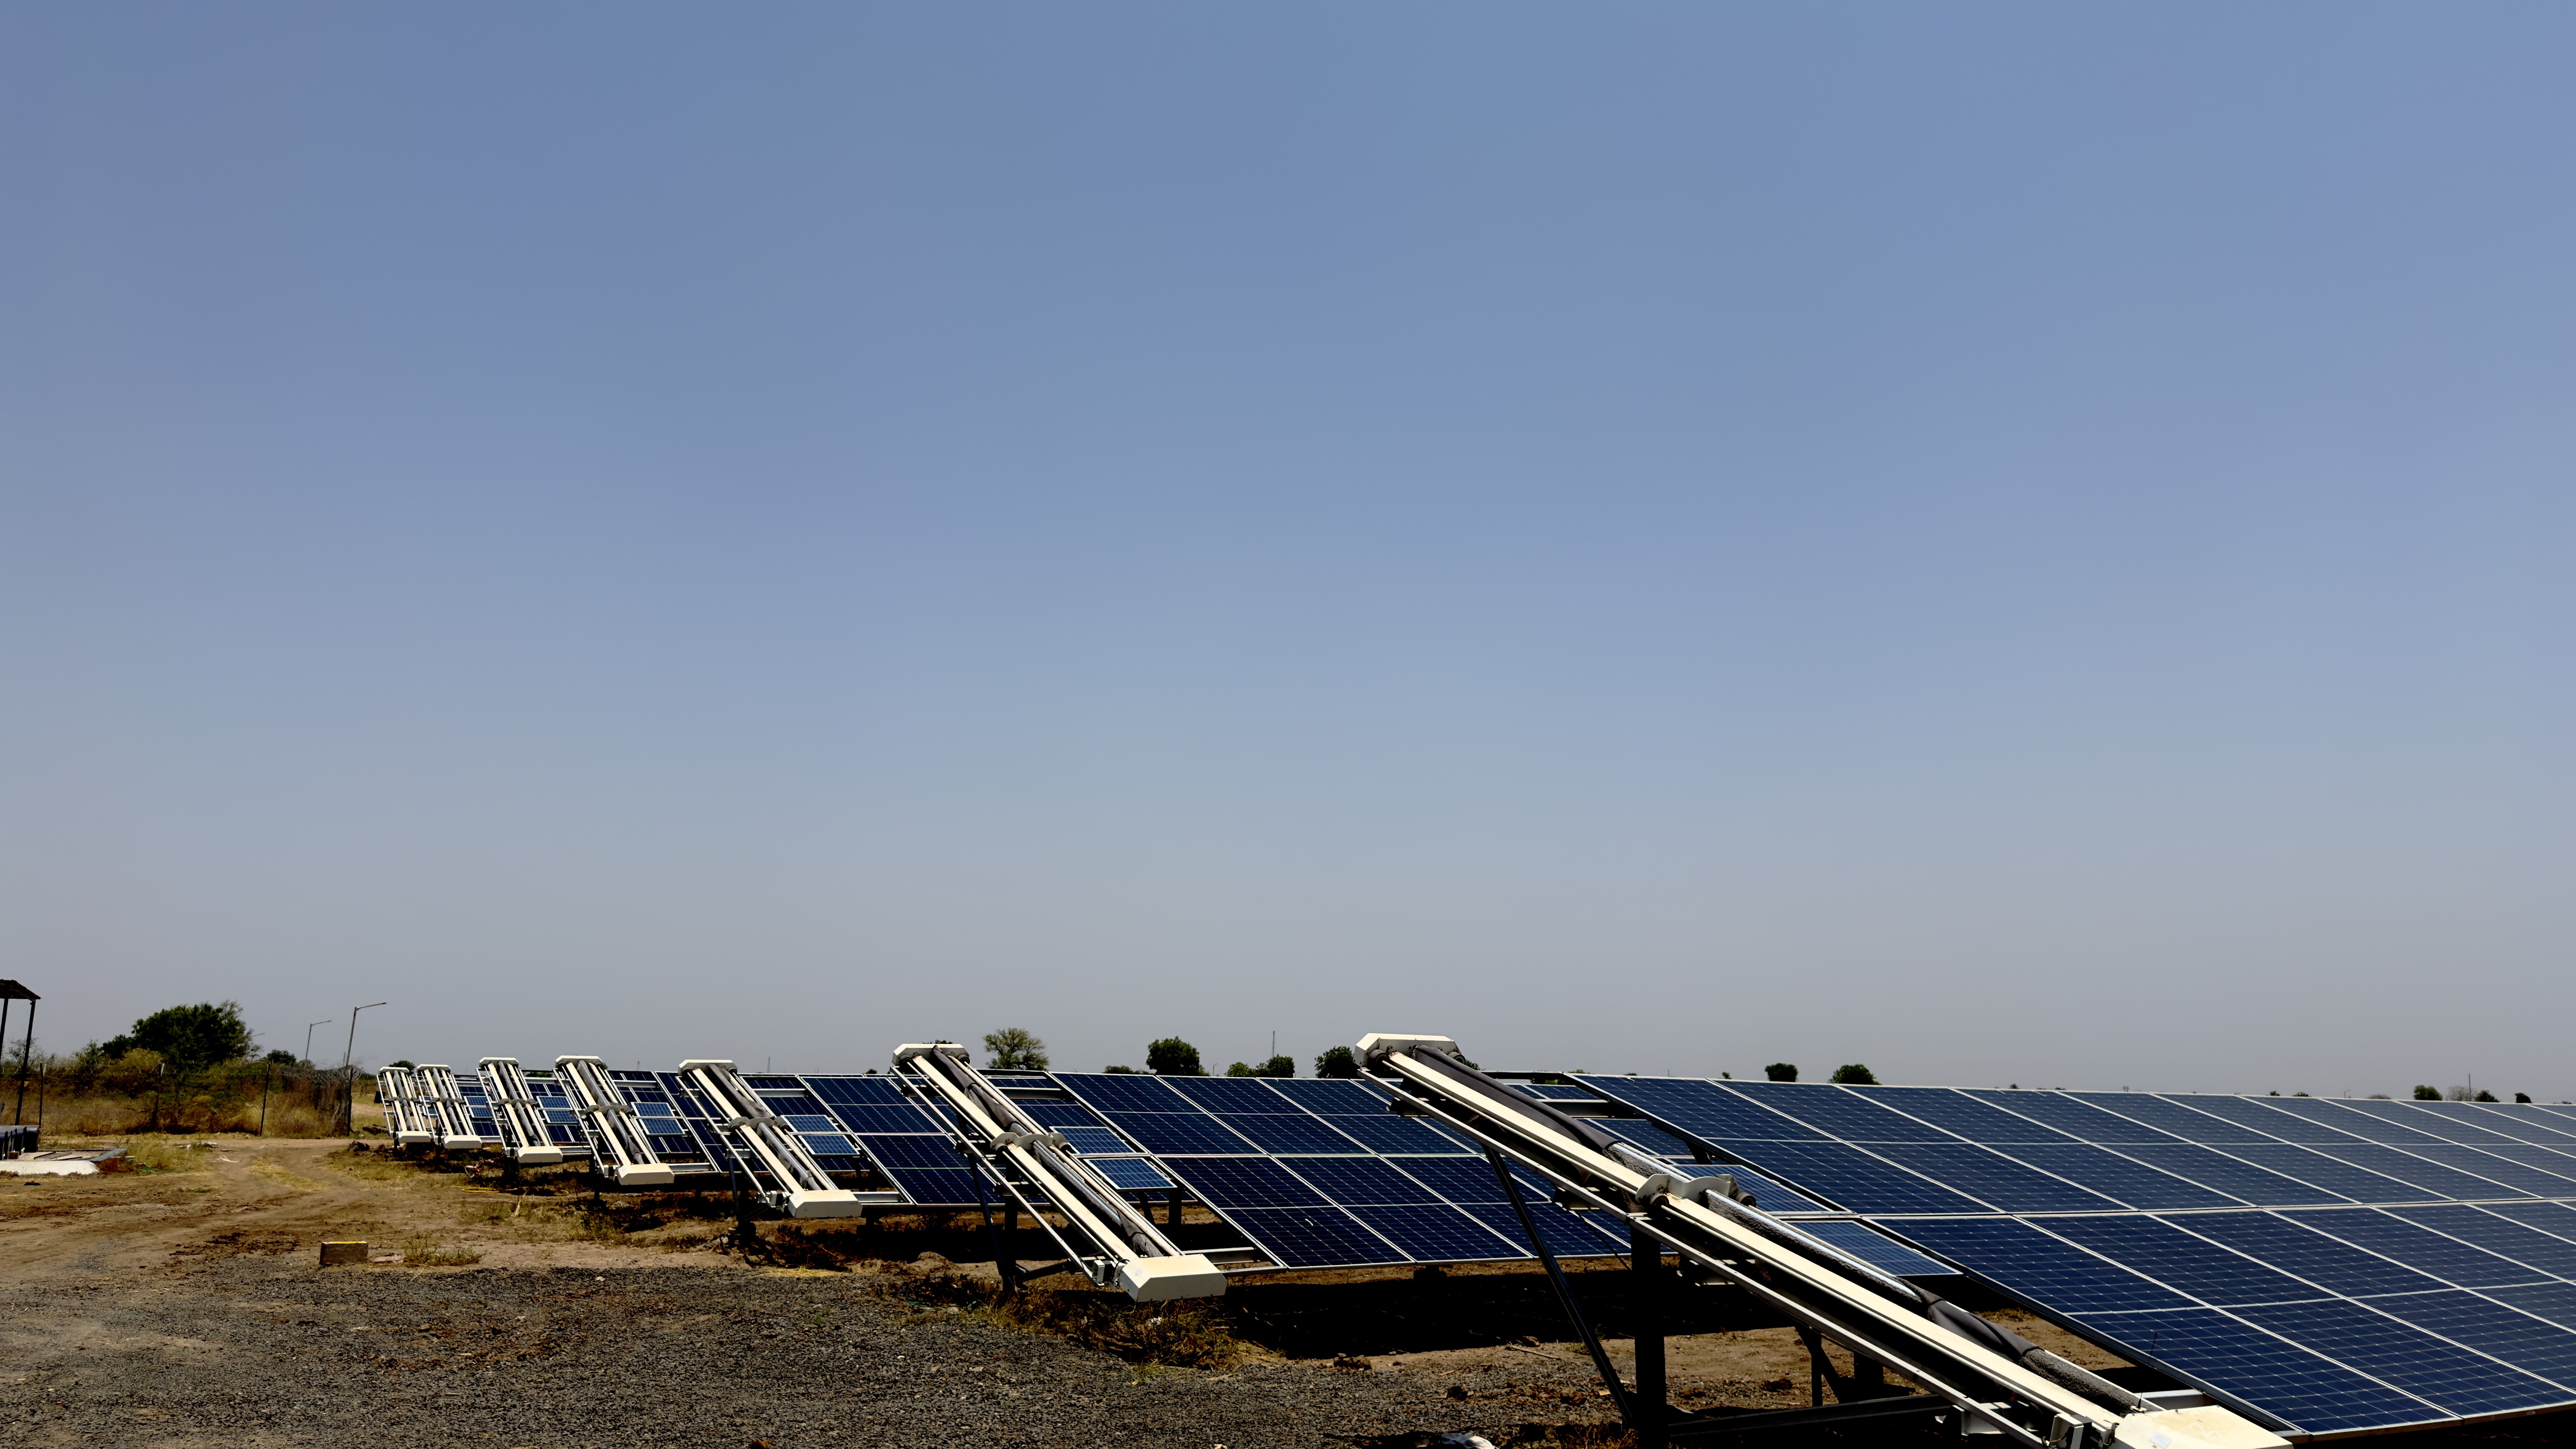
If you observe scratching patterns or worn coating finishes on your modules, it is a clear indicator that your cleaning system is either outdated or poorly calibrated. For utility-scale assets, the move toward autonomous technology is often driven by the need for consistent, non-abrasive contact. Using systems like automatic waterless robots ensures that pressure and brush engagement are precisely controlled, which is critical for protecting high-efficiency TOPCon and HJT modules. If your audit indicates evidence of mechanical wear, you should immediately suspend the current cleaning protocol to avoid further warranty risks and evaluate less abrasive, automated alternatives.
Auditing for cleaning-induced micro-cracks
- Visual check: Inspect the bottom edge of modules for accumulated debris and frame-sealing damage that indicates aggressive manual cleaning.
- Thermographic scan: Conduct biannual thermal imaging to identify cell-level hotspots that may have been triggered by improper contact forces during cleaning cycles.
- Coating longevity: Use gloss meters to compare periodically cleaned sections against control panels to quantify potential anti-reflective coating erosion.
- Record review: Cross-reference maintenance schedules with site incident reports for any documented module breakage or frame denting related to equipment usage.
What is the ideal cleaning frequency for Indian arid vs. coastal regions?
In Indian utility-scale solar, cleaning frequency is a strategic variable rather than a static schedule. Arid zones, such as those found in Rajasthan and Gujarat, experience daily efficiency losses ranging from 0.35% to 0.5% due to high dust accumulation. In these regions, a 7 to 10-day cleaning cycle is common to keep soiling losses under manageable thresholds. Leaving modules uncleaned for 20 days in these environments often results in double-digit energy yield losses that become difficult to recover.
Conversely, coastal plants face salt deposition and high humidity, which can lead to permanent calcification or conductive residue if not managed properly. While the rate of accumulation is lower than arid regions, the potential for long-term module degradation requires a more consistent approach. For coastal sites, a 15 to 20-day cycle is typically sufficient, but the audit must prioritize thorough rinsing or controlled automated cleaning to prevent salt crusting. For asset owners planning these cycles, automatic solar panel cleaning systems offer the reliability required to maintain these cadence targets without the variance inherent in manual labor.
Key takeaways for O&M performance audits
- Establish a baseline: Use your plant SCADA data to calculate the specific soiling rate (loss per day) for your local micro-climate before finalizing the cleaning interval.
- Standardize the records: Ensure every cleaning event is logged in a centralized system, such as NECTYR, to track performance ratio (PR) recovery per cycle.
- Audit your resources: Verify that your water and labor consumption aligns with the recovered generation; if the cost per kWh recovered exceeds your PPA tariff, it is time to shift from manual to automated cleaning methodologies.
- Schedule thermal scans: Integrate biannual drone-based thermography to confirm that your current cleaning method is not introducing micro-cracks or frame damage that could void your module warranties.
Sources and further reading
Frequently asked questions
A proactive solar plant audit requires rigorous tracking of cleaning-related red flags that threaten energy yield. By integrating real-time Performance Ratio (PR) monitoring with physical site inspections, O&M teams can transition from reactive cleaning to condition-based maintenance that protects module integrity and plant financial health.
Inspect modules for signs of surface scratching or damage to anti-reflective coatings. The presence of new micro-cracks or unexplained hotspots often indicates that your cleaning team is using improper manual pressure or abrasive tools that violate manufacturer warranty terms.
Primary signs include a Performance Ratio drop exceeding 3 percent that remains unaddressed, as well as water usage exceeding 5 liters per module in water-stressed regions, which typically signifies suboptimal manual cleaning cycles.
You should compare your costs against the localized efficiency loss, which ranges from 0.35 percent to 0.5 percent per day in arid zones. If your cleaning schedule does not mitigate the 6 percent to 15 percent annual yield loss caused by these patterns, you should transition to condition-based maintenance or autonomous cleaning systems.