Summary for plant managers
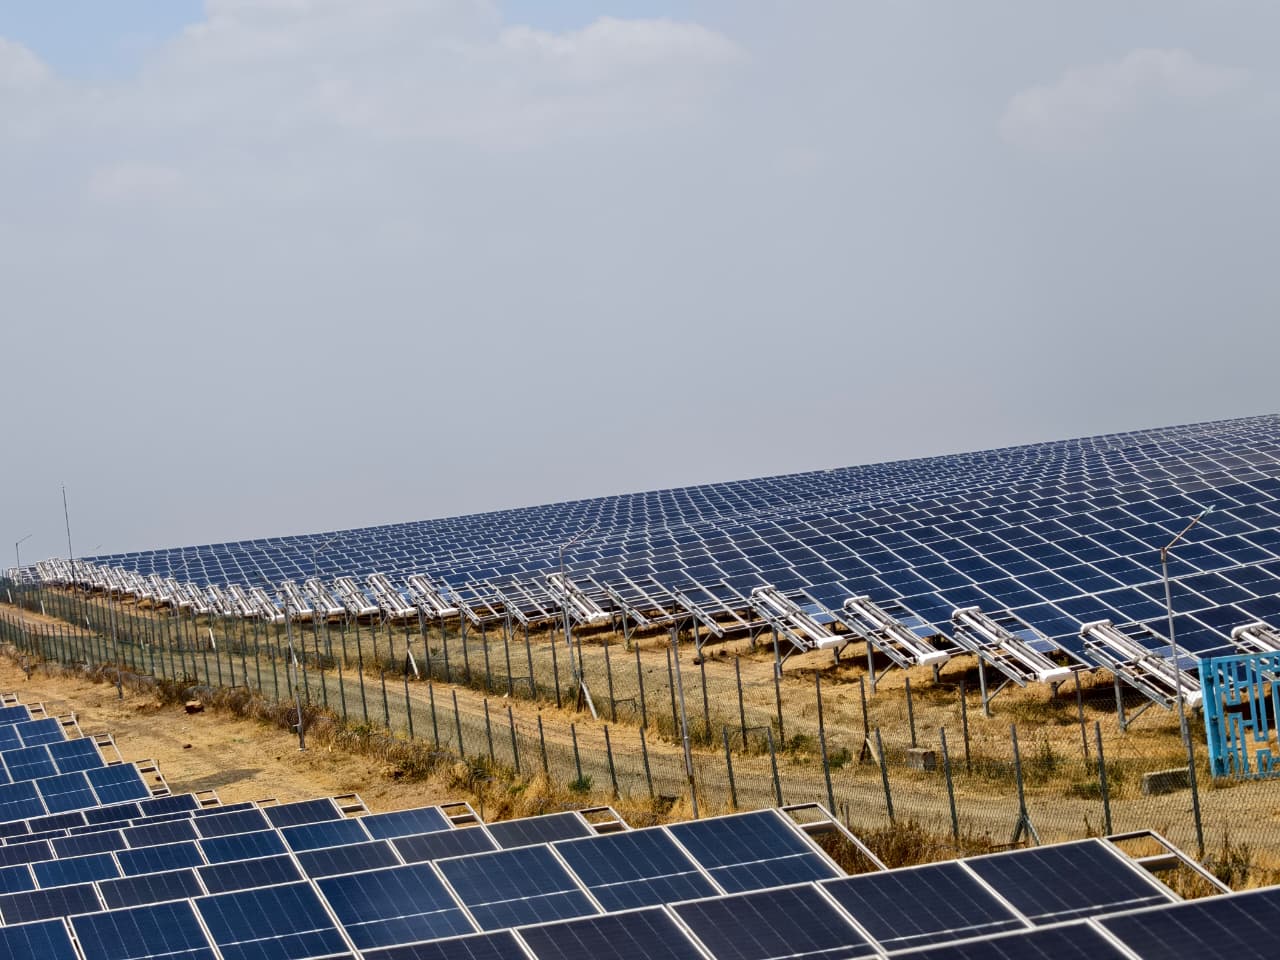
A successful cleaning transformation on a 100MW+ utility plant hinges on shifting from static calendar-based maintenance to dynamic, data-driven cycles. Asset owners in regions like Rajasthan and Gujarat face unique soiling challenges where dust accumulation significantly impacts generation within days. Adopting a systematic approach protects your IRR by aligning cleaning costs with specific plant PR degradation thresholds. For those looking to master this shift, our case study 100mw plant cleaning transformation provides a blueprint for operational efficiency.
- Daily soiling loss in Indian desert regions can reach 0.5% to 1.0% without regular intervention.
- Target a 5% to 15% improvement in Performance Ratio (PR) by optimizing cleaning cycles.
- Water-efficient systems can reduce consumption by up to 90% compared to traditional manual wet cleaning.
- Transitioning to automated systems requires site-wide mapping and infrastructure readiness for 100MW+ scales.
Defining the technical scope of a 100MW cleaning transformation
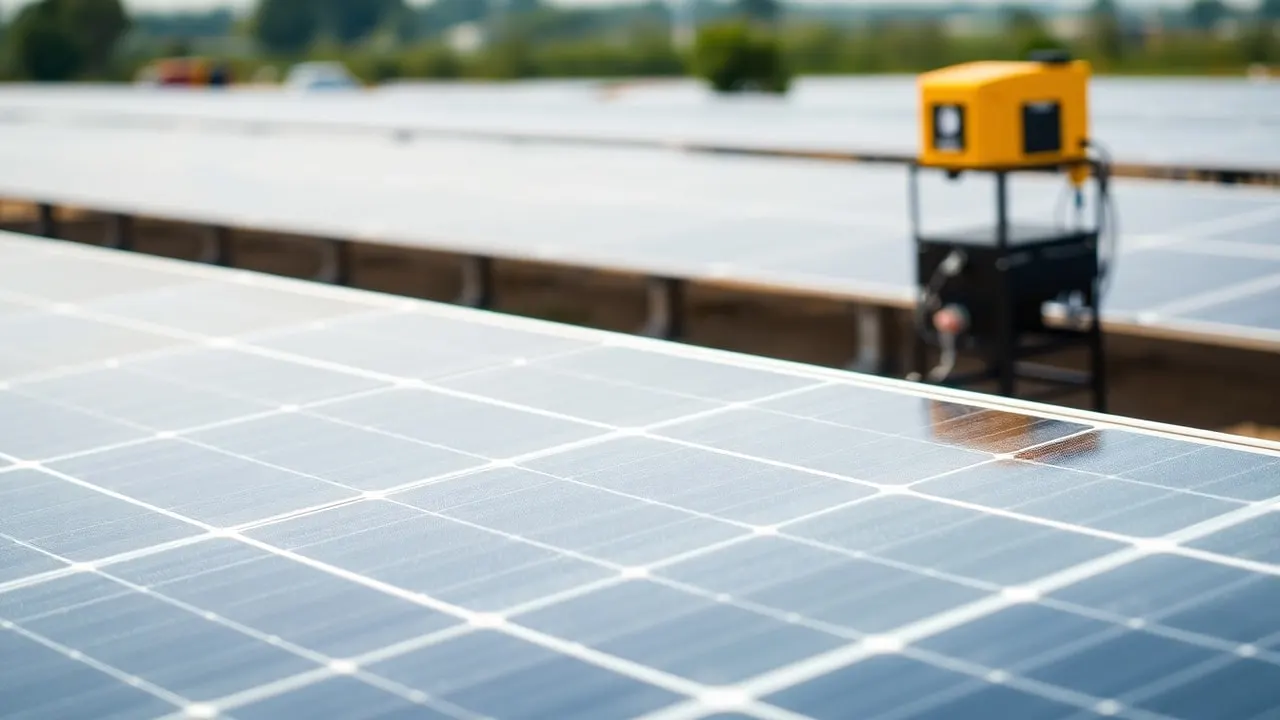
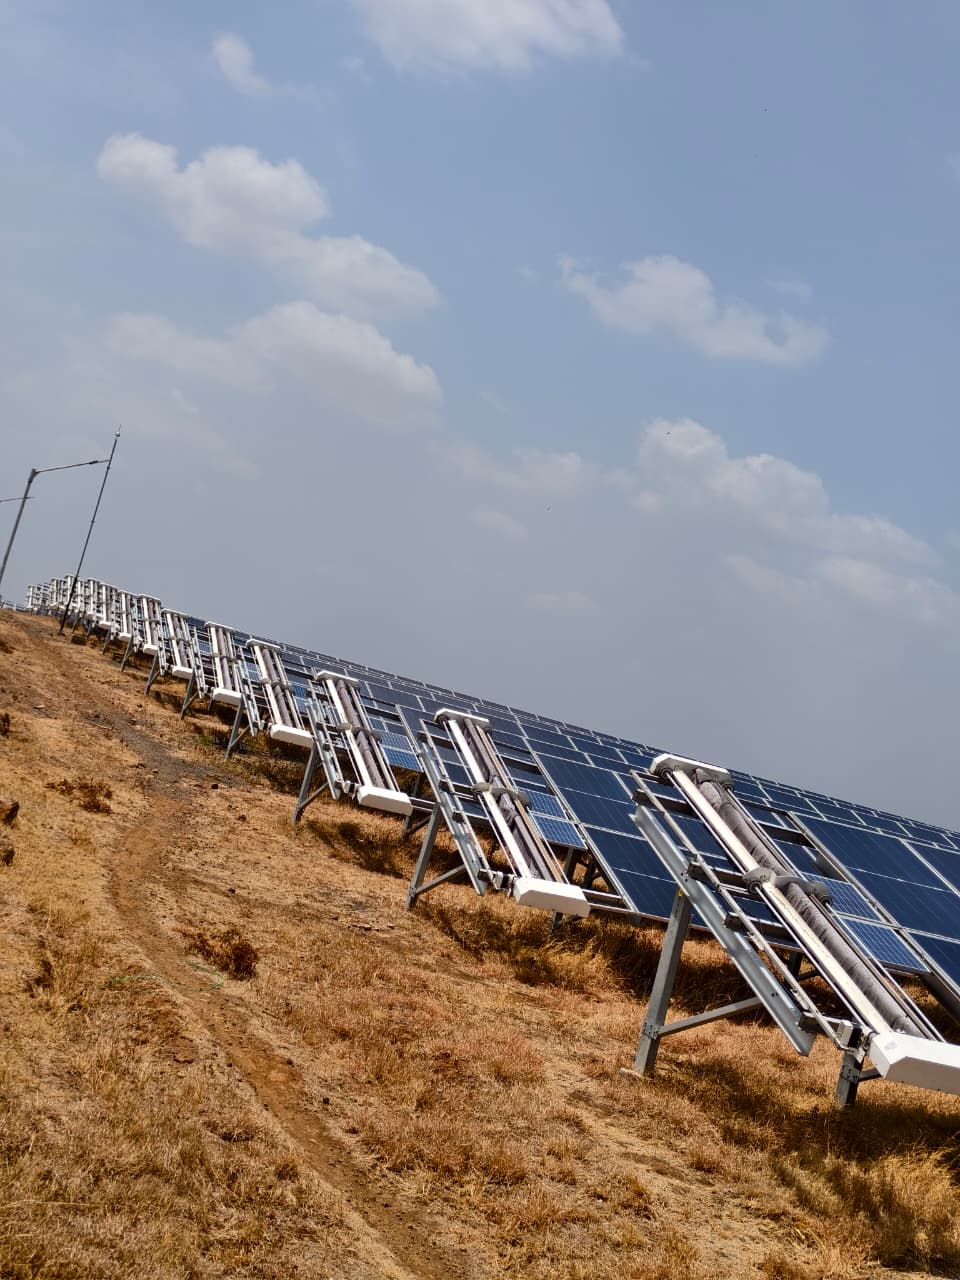
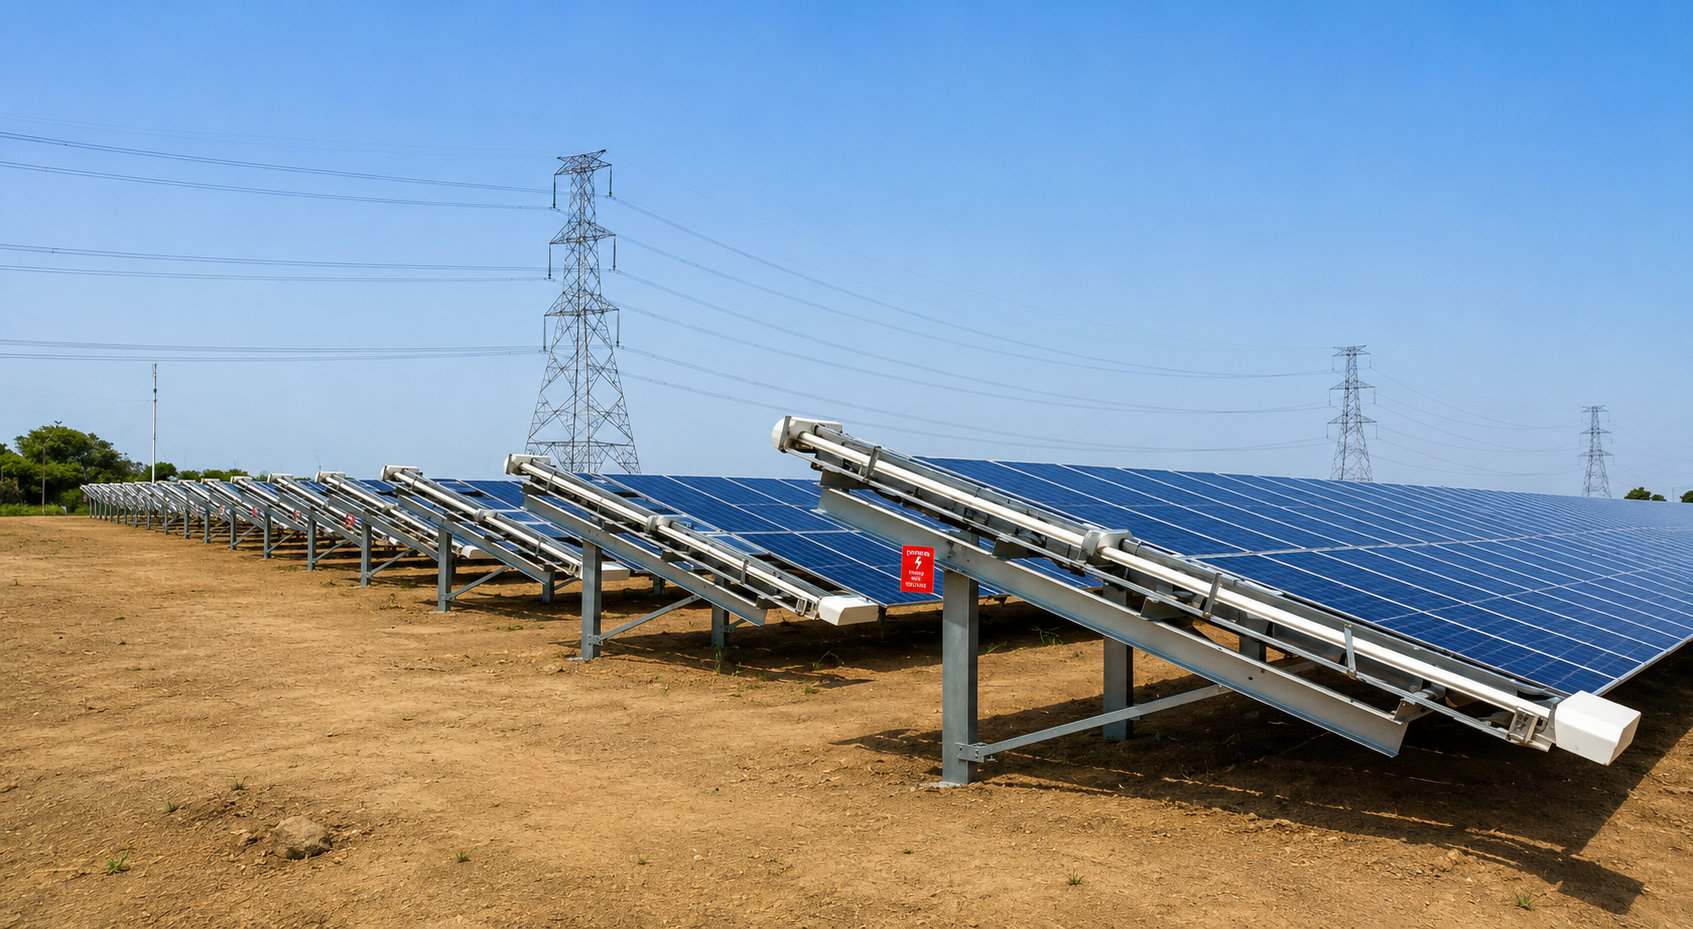
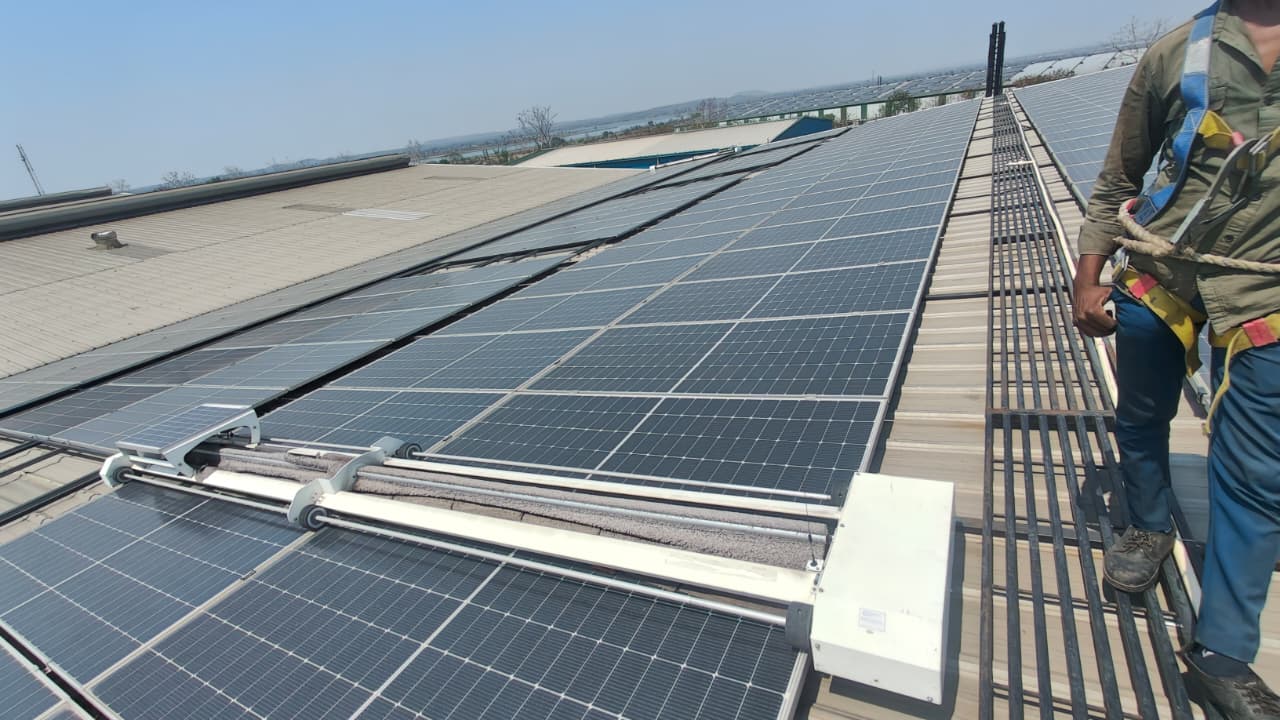
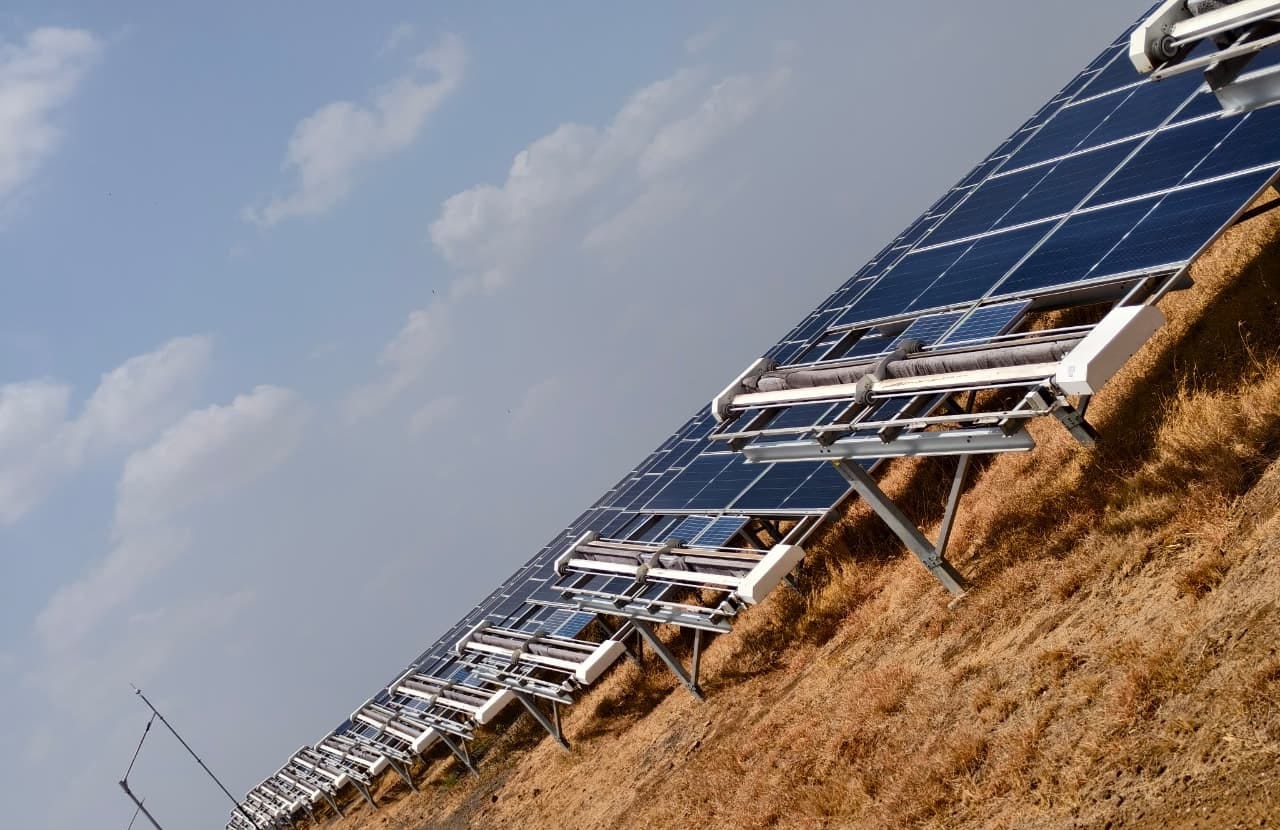
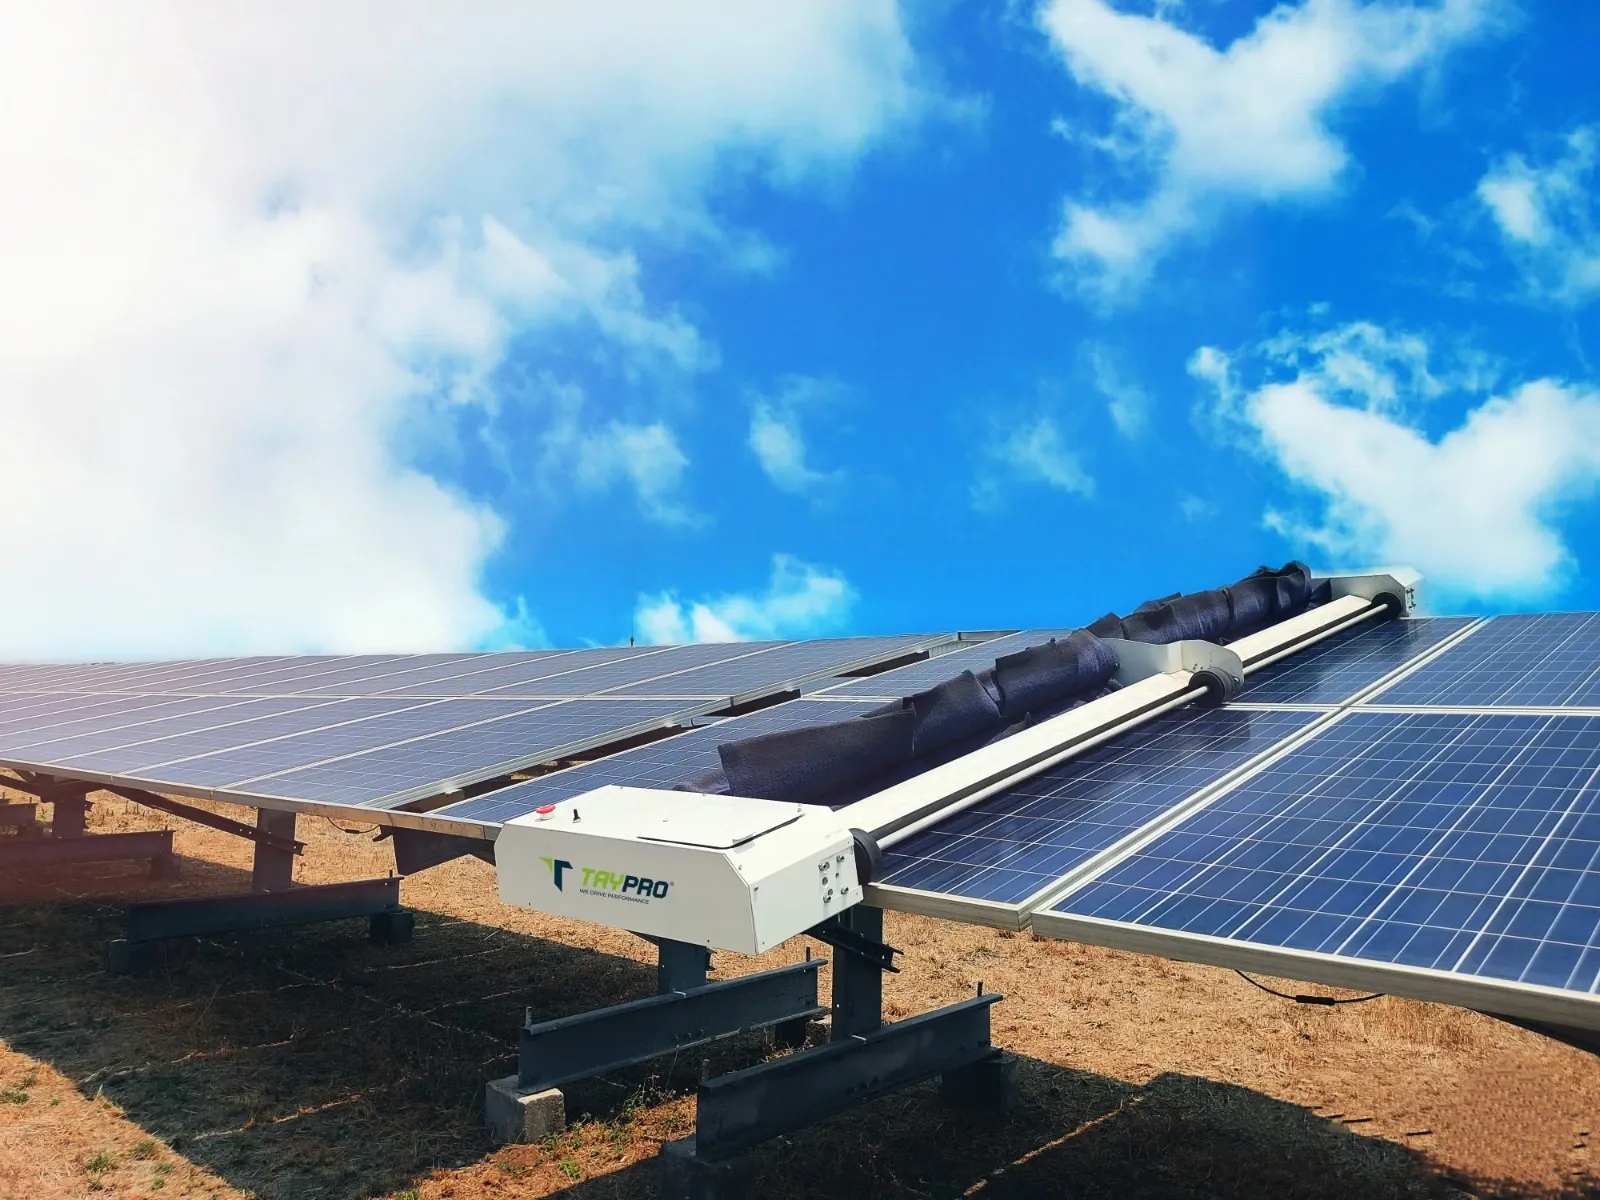
Transforming a 100MW+ plant begins with site segmentation. You must evaluate the plant layout to determine if fixed-tilt rows or single-axis trackers dominate the capacity. Each architecture requires a distinct cleaning methodology. For instance, fixed-tilt systems allow for linear robotic deployment, whereas horizontal trackers demand specialized equipment that can articulate with the module tilt range. You should audit your existing site access routes and end-row clearance before selecting any hardware. Integrating robotic cleaning at this scale is an operational upgrade, not just an equipment procurement. Asset managers should review their solar panel cleaning system options by assessing whether your current site infrastructure supports autonomous docking or requires semi-automatic pick-and-place units. This audit ensures that your chosen solution integrates with the existing SCADA and does not interfere with tracker motors or module warranties.
Evaluating cleaning technology trade-offs
Selecting the right hardware for a 100MW plant involves balancing initial capital expenditure against long-term maintenance costs and operational uptime. The following table highlights the critical differences between manual, semi-autonomous, and fully robotic cleaning systems for large-scale utility projects in India.
| Feature | Manual Wet Cleaning | Semi-Autonomous Systems | Fully Robotic Systems |
|---|---|---|---|
| Labor Cost | High | Moderate | Low |
| Water Usage | Very High | Low | Zero |
| Deployment Speed | Slow | Fast | Very Fast |
| Technical Complexity | Low | Moderate | High |
| Scalability (100MW+) | Poor | Fair | Excellent |
Key procurement criteria for utility portfolios
When selecting your cleaning solution, focus on these three factors: build quality for high-temperature desert environments, compatibility with your existing automatic solar panel cleaning system infrastructure, and vendor support availability in local regions like Bhadla or Khavda. Before finalized procurement, ensure your team has reviewed the Solar Plant Commissioning: Robot Integration Checklist for Utility PV to avoid mechanical bottlenecks. Avoid generic equipment that lacks internal diagnostics, as downtime on a 100MW plant is costly.
Risk mitigation and infrastructure audit checklist
Before scaling your cleaning operations, ensure your O&M team completes this infrastructure audit to prevent deployment bottlenecks. The goal is to maximize the uptime of your automated monitoring systems by ensuring the physical environment is ready for robot transit. Furthermore, integrating Predictive O&M vs Predictive Generation on Indian Utility Solar Plants techniques allows teams to better understand the long-term impact of soiling on revenue.
- Verify end-of-row clearance: Ensure a minimum of 1.5 meters is available for robotic docking and turning.
- Tracker articulation check: Confirm that all modules are aligned to the maintenance stow angle during the cleaning process to prevent mechanical binding.
- Electrical integration: Test the SCADA interface to ensure cleaning alerts are triggered during low-generation periods.
- Path leveling: Grade the access paths to ensure robots do not stall or tilt due to uneven ground.
- Power stability: Confirm that charging stations have consistent connectivity and are protected from extreme heat buildup.
How do you establish a data-driven cleaning schedule for utility-scale sites?
Moving from a fixed monthly calendar to a data-driven schedule is the most effective way to protect your IRR. On 100MW+ sites in India, you should integrate local weather forecasting with real-time soiling loss data to trigger cleaning only when the cost of lost generation exceeds the cost of a cleaning cycle. Instead of cleaning the entire 100MW plant at once, segment your site into blocks based on soiling intensity. Arid regions like Rajasthan require frequent monitoring, as a 0.5% to 1.0% daily PR drop is not uncommon during high-dust seasons.
You must calibrate your schedule against site-specific Performance Ratio (PR) degradation thresholds. If your plant is consistently losing 3% to 5% of potential output between cleans, you should trigger an automated cleaning intervention. By using automated monitoring systems to track output trends, you can avoid the excessive wear caused by over-cleaning and the revenue leakage caused by neglecting high-soiling zones. For a 100MW portfolio, this dynamic adjustment often leads to a 5% to 15% improvement in overall PR.
Managing site logistics for large-scale cleaning deployment
Logistics at the 100MW scale require site infrastructure that supports rapid movement and high-uptime maintenance. If you are integrating robotic systems, you must map out service paths that allow for easy battery swapping or row-to-row transfers using specialized docking platforms like the CRADYL row-transfer station. Without this level of planning, the manual time spent moving equipment across long tracker rows will negate the efficiency gains of your robotic fleet.
Ensure your O&M team maintains clear access roads that can accommodate heavy vehicles during the rainy season, as mud accumulation can hinder both robots and technicians. When evaluating your solar panel cleaning system, check the compatibility of the docking hardware with your existing tracker manufacturer, such as NEXTracker or Gamechanger systems. A clean, obstruction-free end-of-row rail design is essential for ensuring that automated robots can self-dock and recharge without manual intervention. This infrastructure readiness prevents common 100MW+ scale-up failures, where connectivity gaps or limited access points force expensive and time-consuming manual resets.
Reducing water reliance in arid Indian solar regions
For utility plants in Rajasthan or Gujarat, shifting from traditional water-based cleaning to dry robotic systems is a strategic necessity rather than a procurement choice. Manual wet cleaning on a 100MW site can consume millions of litres annually, a volume that is increasingly difficult to source and transport in arid districts. By utilizing waterless cleaning technology, operators can achieve up to 90% reduction in water usage while eliminating the mineral buildup common with hard-water washing. Additionally, asset owners should review ESG Reporting for Indian Utility Solar to better align these water savings with corporate sustainability goals.
Dry-cleaning technology also prevents the slurry formation that often happens when water mixes with fine desert dust. This slurry can harden into a cement-like film that creates permanent hotspots on your PV modules. Switching to an autonomous, waterless cleaning process ensures consistent light penetration and prevents the long-term degradation associated with moisture-heavy cleaning cycles. When planning your fleet, prioritize automatic solar panel cleaning systems that utilize gentle microfiber or UV-stable PBT bristles to ensure glass integrity over the 25-year plant life.
Performance monitoring and PR recovery metrics
After upgrading your cleaning strategy, you must validate the transformation through Performance Ratio (PR) recovery. On a 100MW plant, you should expect a PR improvement of 5% to 15% after implementing a optimized cleaning cadence. Use your SCADA system to isolate soft-losses related specifically to soiling versus electrical or inverter downtime. By tagging these periods of lower yield, you can demonstrate to stakeholders that the investment in automated O&M is directly driving additional MWh revenue.
You can further enhance your data accuracy by installing dedicated reference modules that remain uncleaned for a set period. Comparing the output of these reference panels against your clean blocks provides a real-time 'soiling index' for your site. This metric allows you to move away from calendar-based maintenance and toward dynamic, condition-based cleaning that triggers only when the revenue loss exceeds the cost of a cleaning pass.
Key takeaways for asset owners
- Baseline your site soiling loss early; do not assume manufacturer degradation curves account for regional dust patterns.
- Audit site access and end-of-row rail clearance for 100MW plants to ensure robots can transition rows without manual help.
- Shift to a data-driven cleaning schedule to avoid over-cleaning and reduce operational wear.
- Prioritize waterless technology to minimize the logistical burden of water procurement and mitigate long-term module glass stress.
- Integrate fleet monitoring via a dedicated portal like NECTYR to track daily robot performance and service alerts.
Sources and further reading
Frequently asked questions
A successful cleaning transformation on a 100MW+ utility plant hinges on shifting from static calendar-based maintenance to dynamic, data-driven cycles. Asset owners in regions like Rajasthan and Gujarat face unique soiling challenges where dust accumulation significantly impacts generation within days.
When implemented correctly, automated cleaning systems are designed to operate within the specific articulation limits of tracking systems. It is essential to audit infrastructure to ensure that hardware does not interfere with tracker motors or violate module handling requirements, thereby protecting existing manufacturer warranties.
For Indian desert regions, water-efficient automated systems are the most effective method, as they can reduce water consumption by up to 90% compared to traditional manual wet cleaning. These systems are superior because they allow for frequent, cost-effective intervention to mitigate daily soiling losses of 0.5% to 1.0%.
The primary risks include misaligning the cleaning technology with existing site architecture, such as fixed-tilt versus horizontal tracker layouts. Additionally, failing to verify SCADA integration and infrastructure readiness for autonomous docking can lead to operational bottlenecks and increased costs.